The
Blizzard of 2013 (8–9 February)
- GFS D(prog)/Dt
charts (courtesy Kyle Griffin)
6-hr precip: (8/12 UTC)
(9/00 UTC)
(9/12 UTC)
500
hPa vorticity: (8/12 UTC)
(9/00 UTC)
(9/12 UTC)
precipitable
water: (8/12 UTC)
(9/00 UTC)
(9/12 UTC)
850
hPa temperature: (8/12 UTC)
(9/00 UTC)
(9/12 UTC)
DT
pressure: (8/12 UTC)
(9/00 UTC)
(9/12 UTC)
MSLP
/ 250 hPa wind speed: (8/12 UTC)
(9/00 UTC)
(9/12 UTC)
- 8 February map discussion summary (includes references to literature)
- Some criticism of NOAA NWP shortcomings for this event (Cliff Mass)
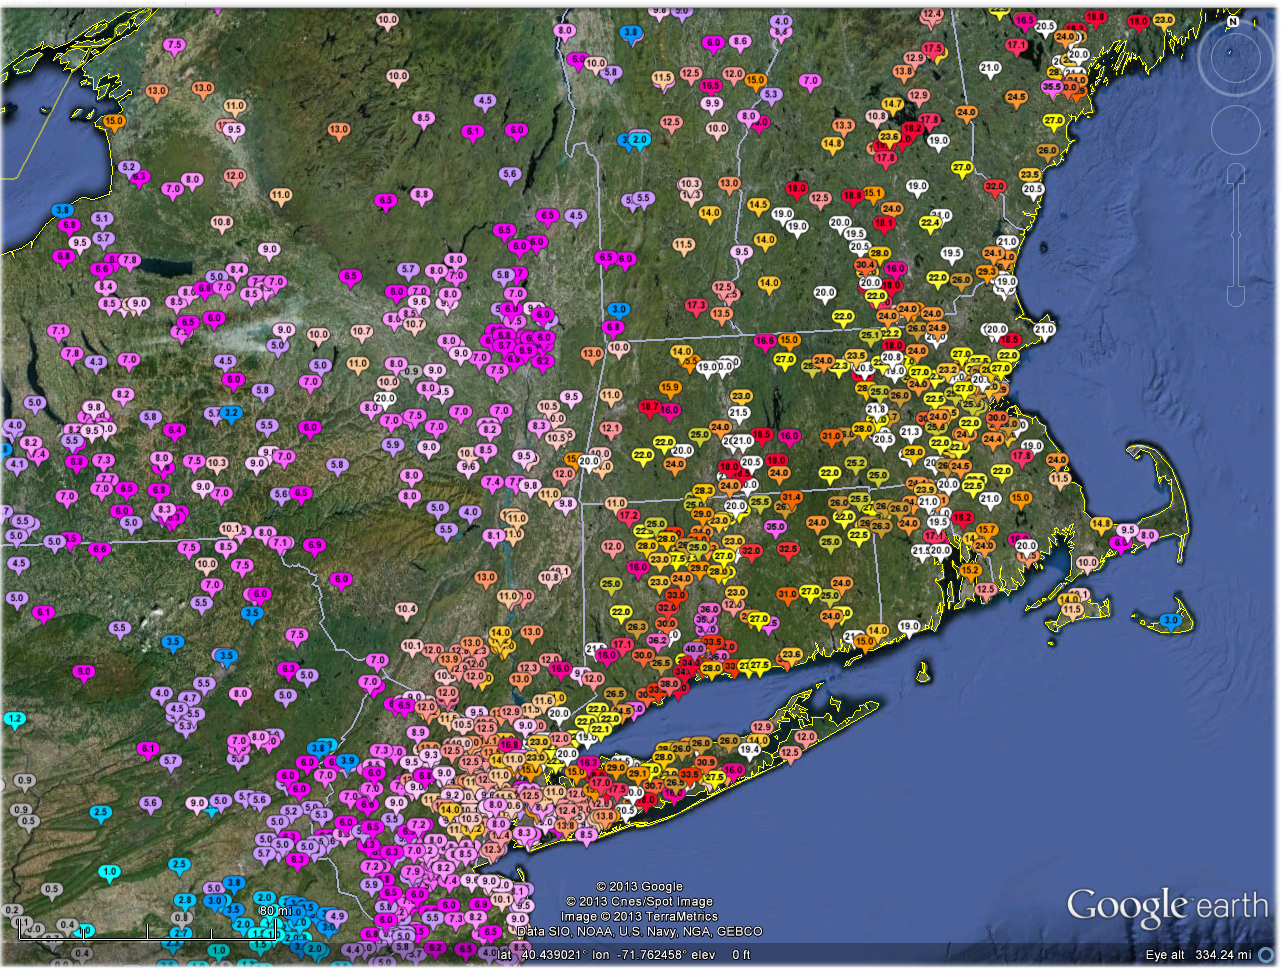
- Preliminary
snowfall totals (unofficial / non-QC):
source 1 and source 2
- HPC event summary
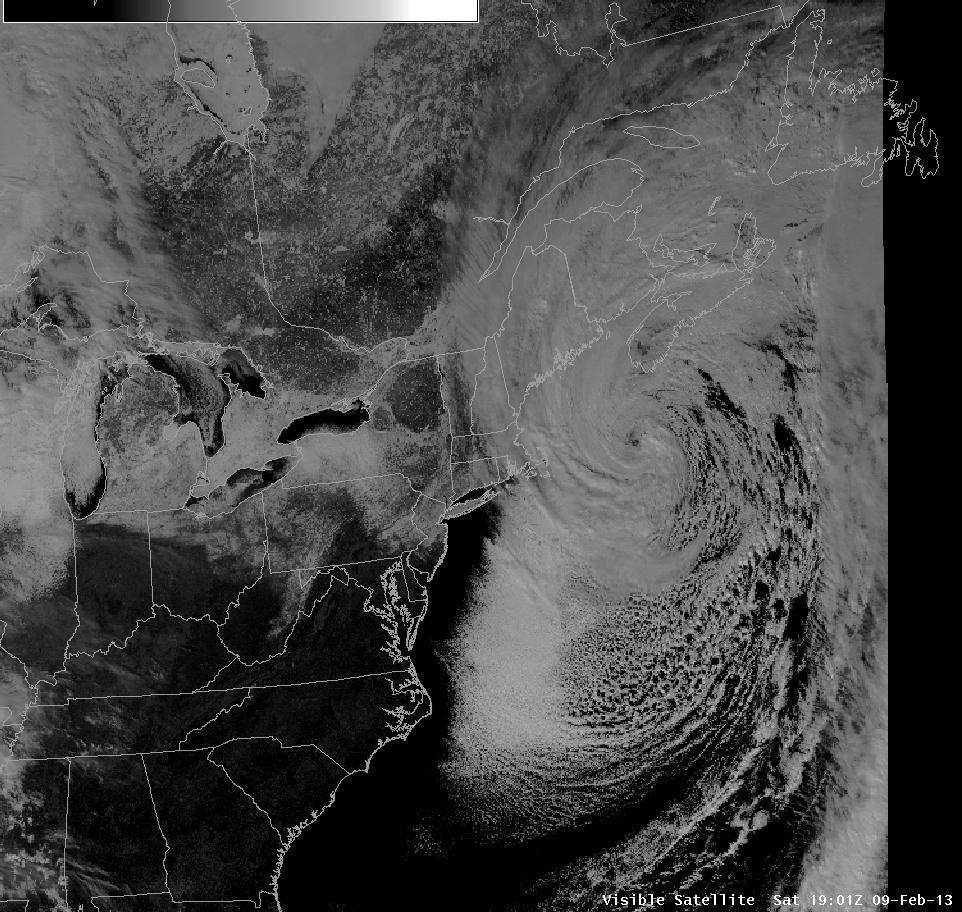
- Visible
satellite image (1901 UTC 9 Feb)
- Northeast U.S.
radar reflectivity mosaic: source 1 and source 2
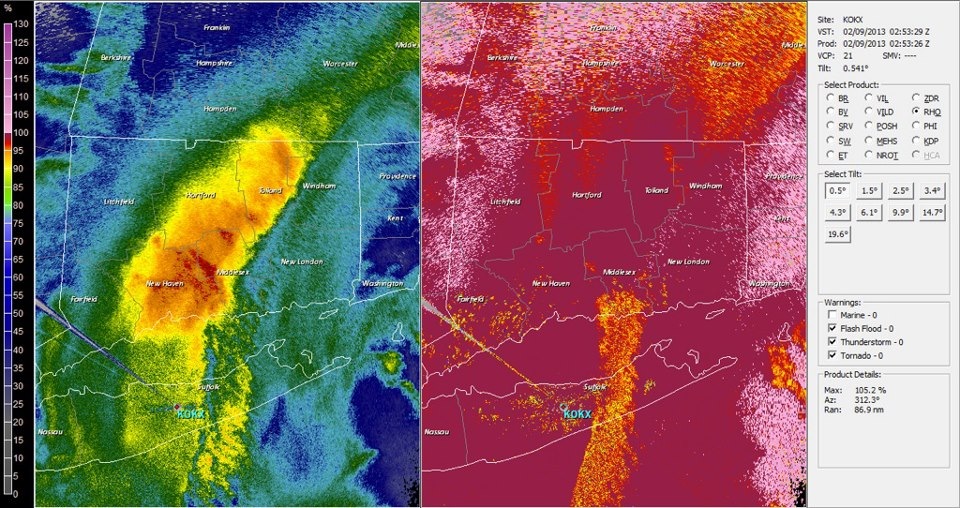
- Dual-polarized
radar imagery of an intense mesoscale snowband:
Interpretation of dual-polarized imagery (specific to this event)
- 8–9
February 2013 Blizzard Report (source:
Richard Grumm)