Advanced Research WRF
High Resolution
Simulations of the
Inner Core Structure of Hurricanes Katrina, Rita and
Wilma (2005)
The Hurricane Group of the
Mesoscale
and Microscale Meteorology (MMM) division of the National
Center for Atmospheric Research (NCAR) produced
real-time
prediction and retrospective research simulations of
Atlantic and
eastern North Pacific tropical cyclones (TCs) using the
Advanced
Research core of the Weather
Research and
Forecasting model (WRF) from 2004 to 2007,
inclusive.
(See Davis
et al. 2008
for a full description of the model setup and parameters.)
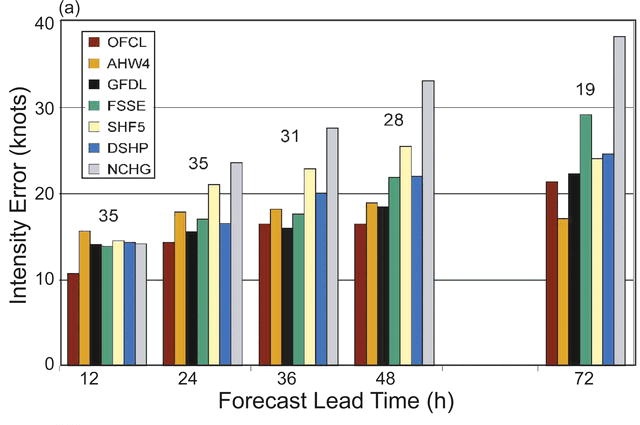
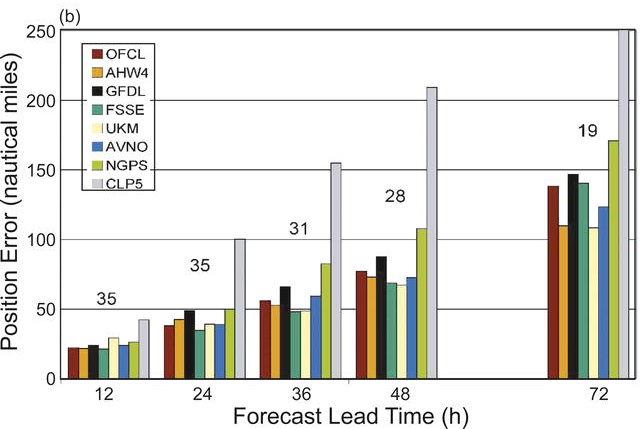
Verification of the intensity and track errors of the WRF forecasts has shown that the 4 km simulations perform as well as, and occasionally superior to, the National Hurricane Center (NHC) official forecasts and other operational forecast systems.
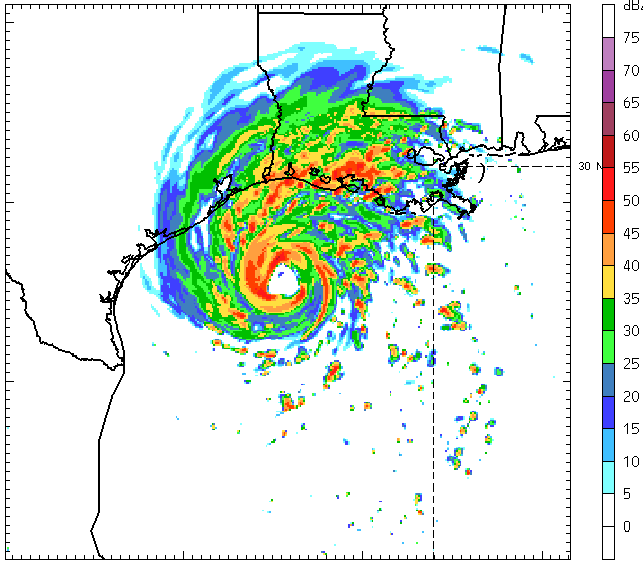
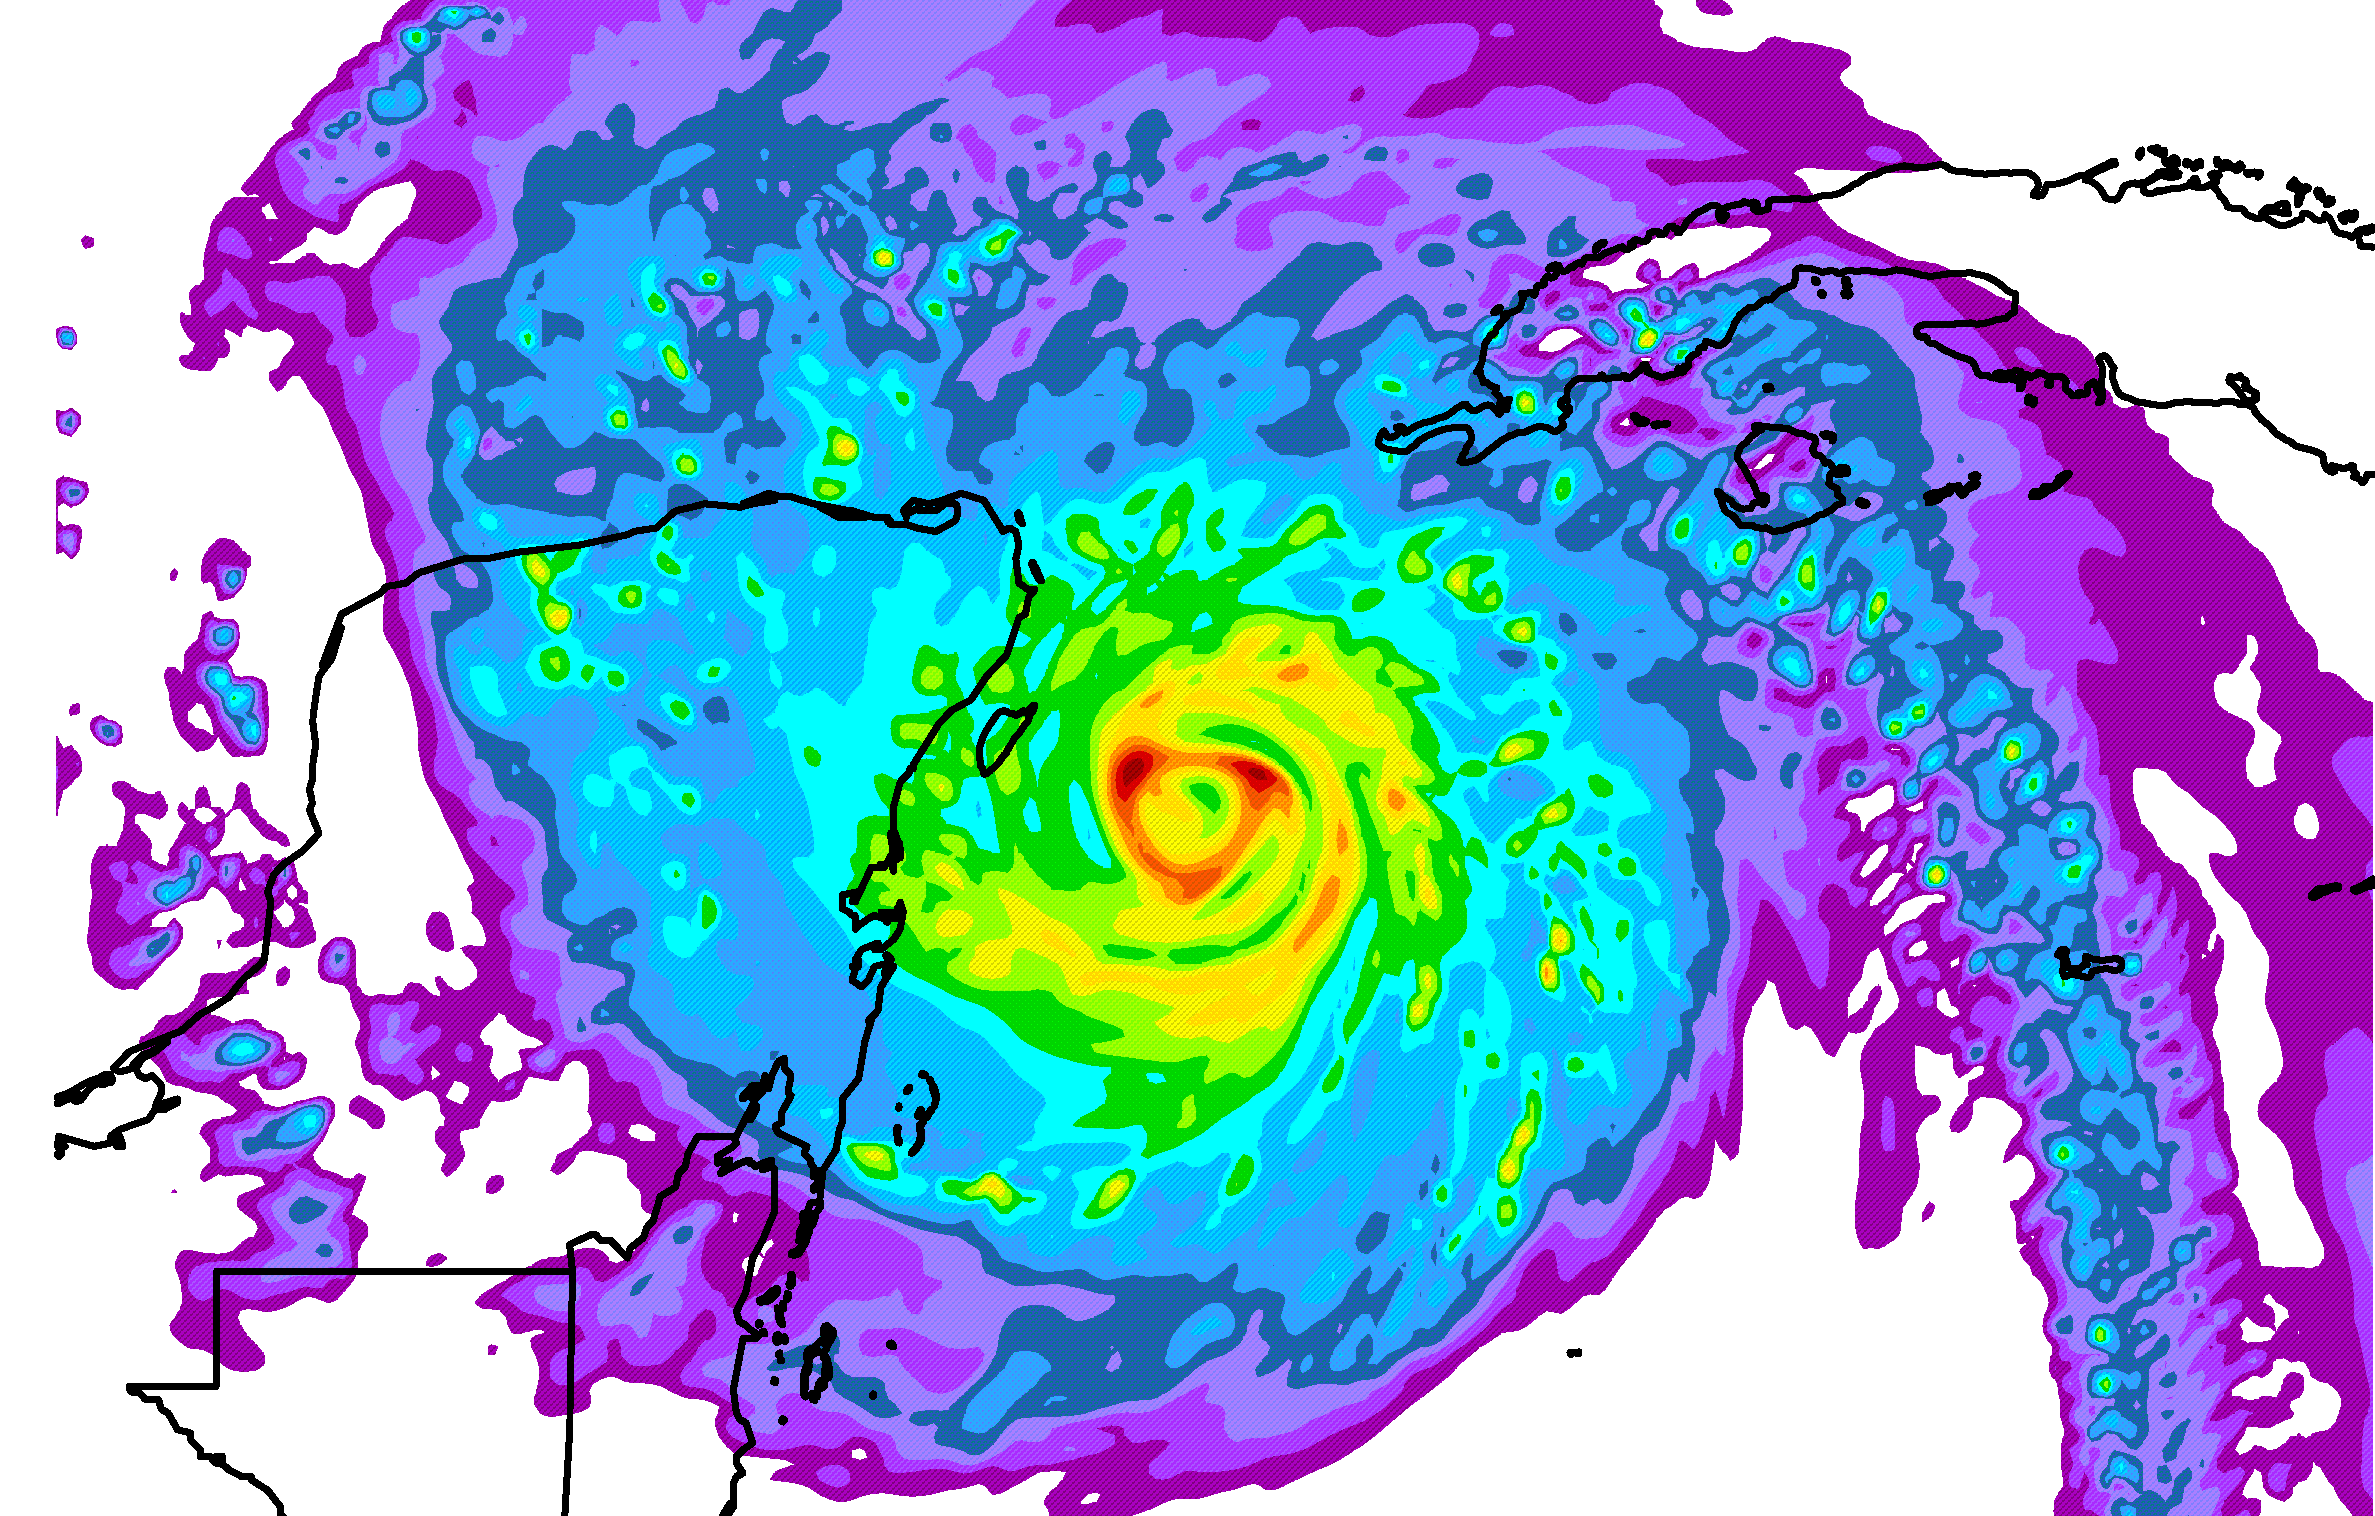
Verification of the inner core structure of the simulated storms, examined with a finest mesh of 1.33 km, has proven less successful. Realistic eye, eyewall and inner spiral rainband structures are simulated on the finest mesh (1.33 km; middle image below), but the eye is generally too small and the eyewall convection too wide. As an example, compare the 4 km (left) and 1.33 km (middle) Hurricane Katrina (2005) reflectivity patterns at 0000 UTC 29 August (48h forecast) to the NOAA/AOML/HRD P-3 lower fuselage radar image (~1.5 km resolution) at 2317 UTC 28 August (right).
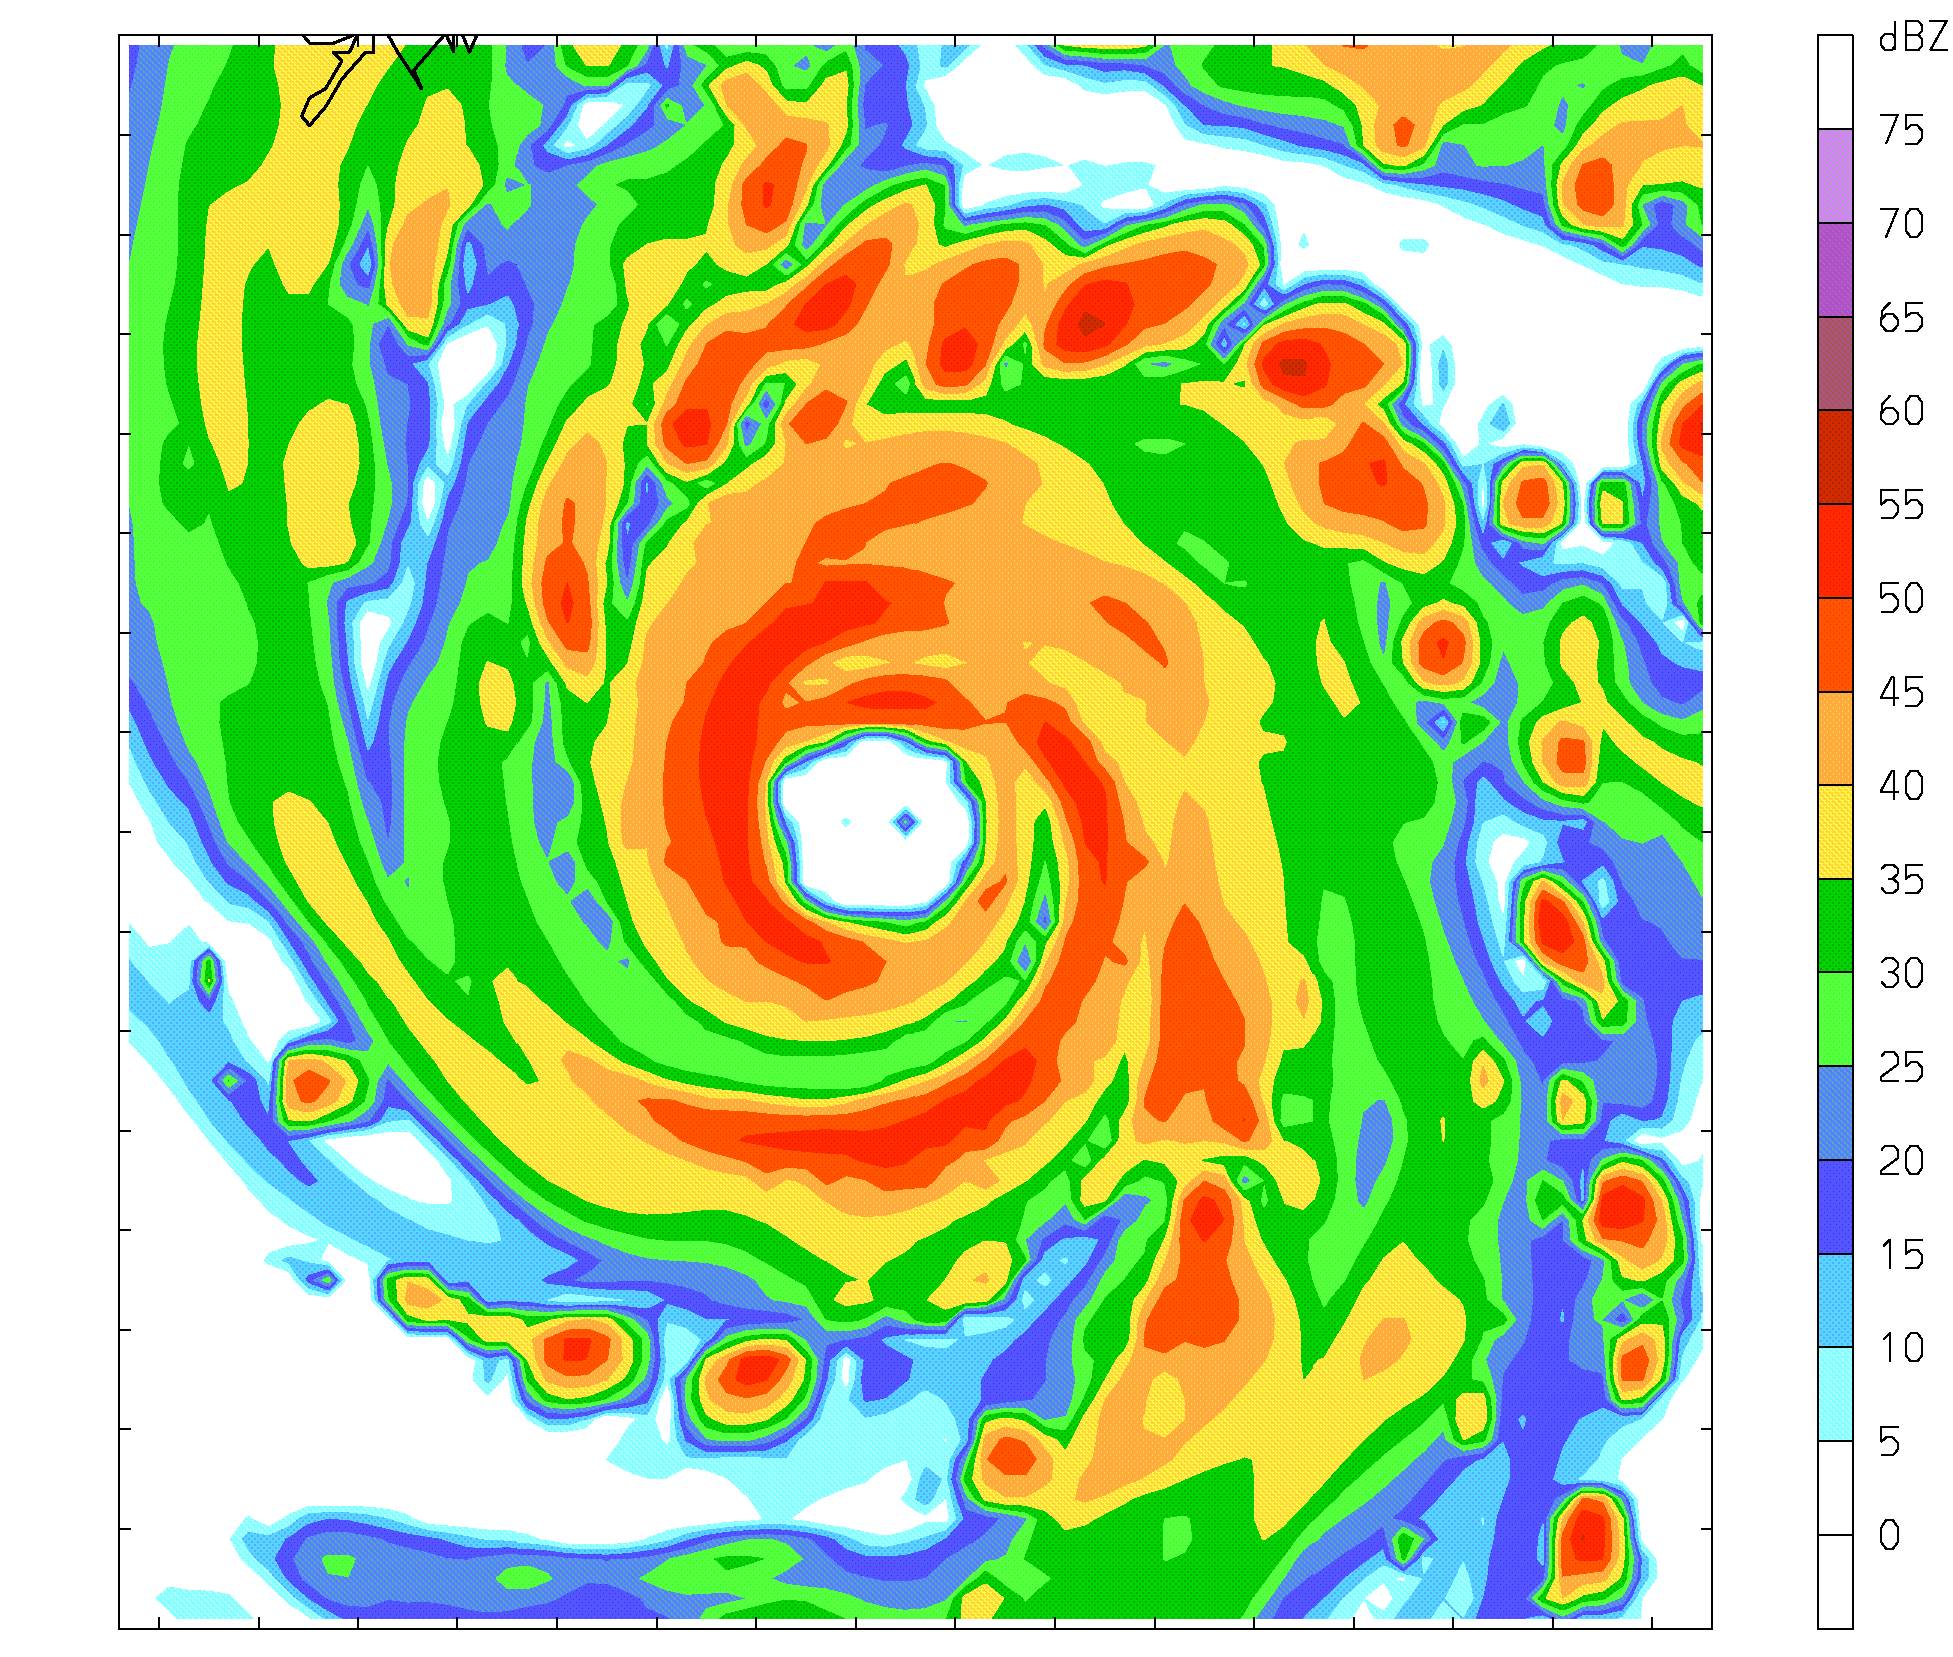
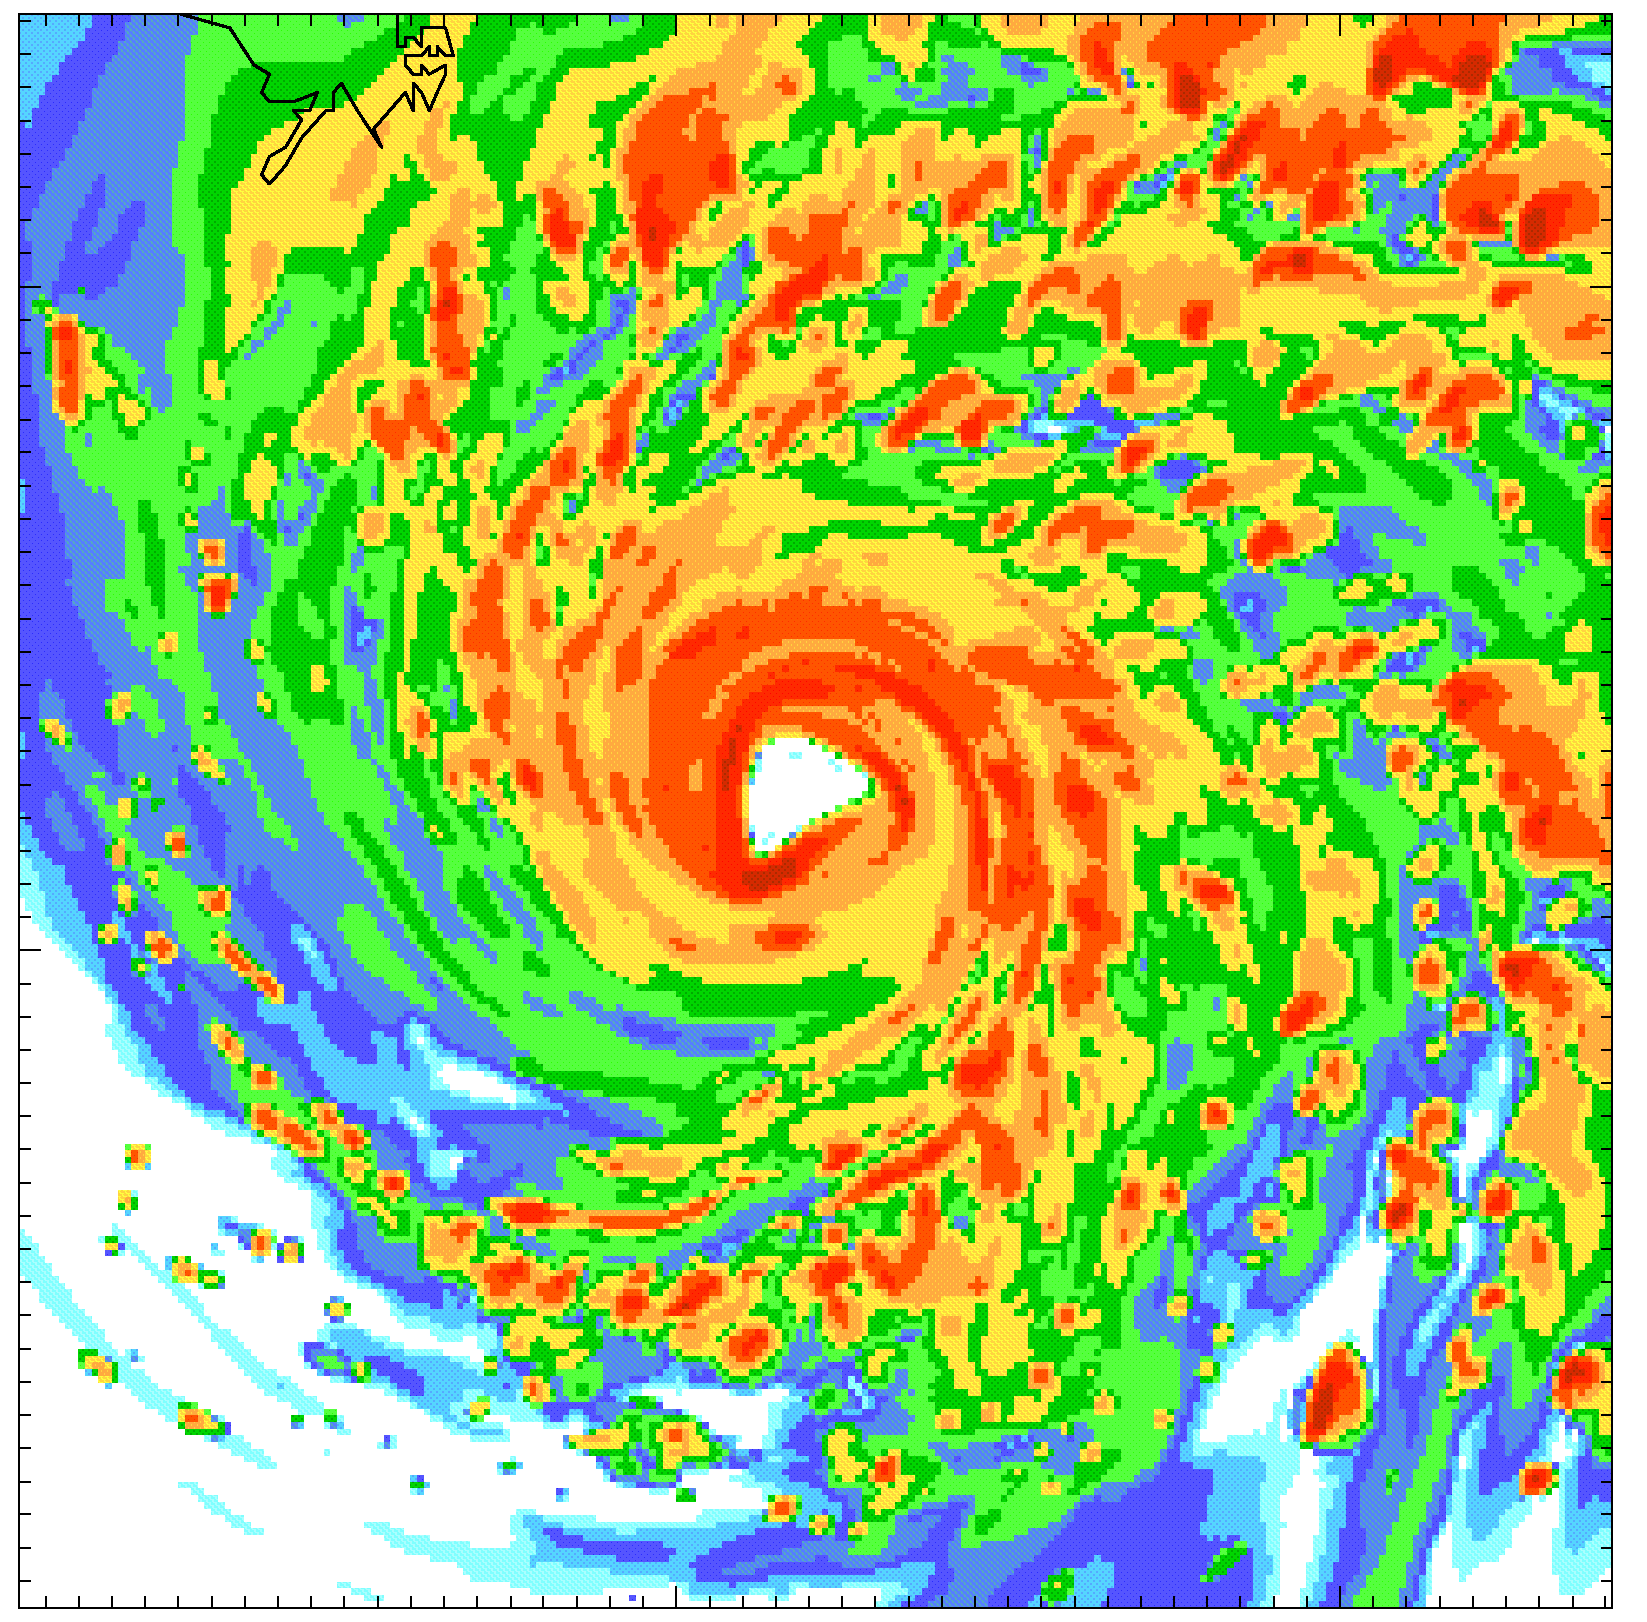
The scales of the images are nearly identical with both WRF images being 320 km on a side and the P-3 radar being 360 km.
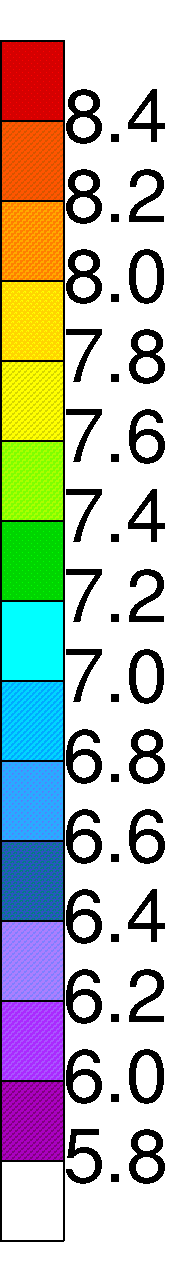
An unusually large number of polygonal eyewall shapes were noted on both the 4 km and 1.33 km grids, as seen in the 1.33 km Katrina reflectivity plot above (middle) and 4 km Hurricane Rita (2005) reflectivity (dBZ; left) and precipitable water (cm; right) plots shown below
at 0300 UTC 24 September (39h forecast).
*** Additional times from both of these runs are shown in the "Loops" section below. ***
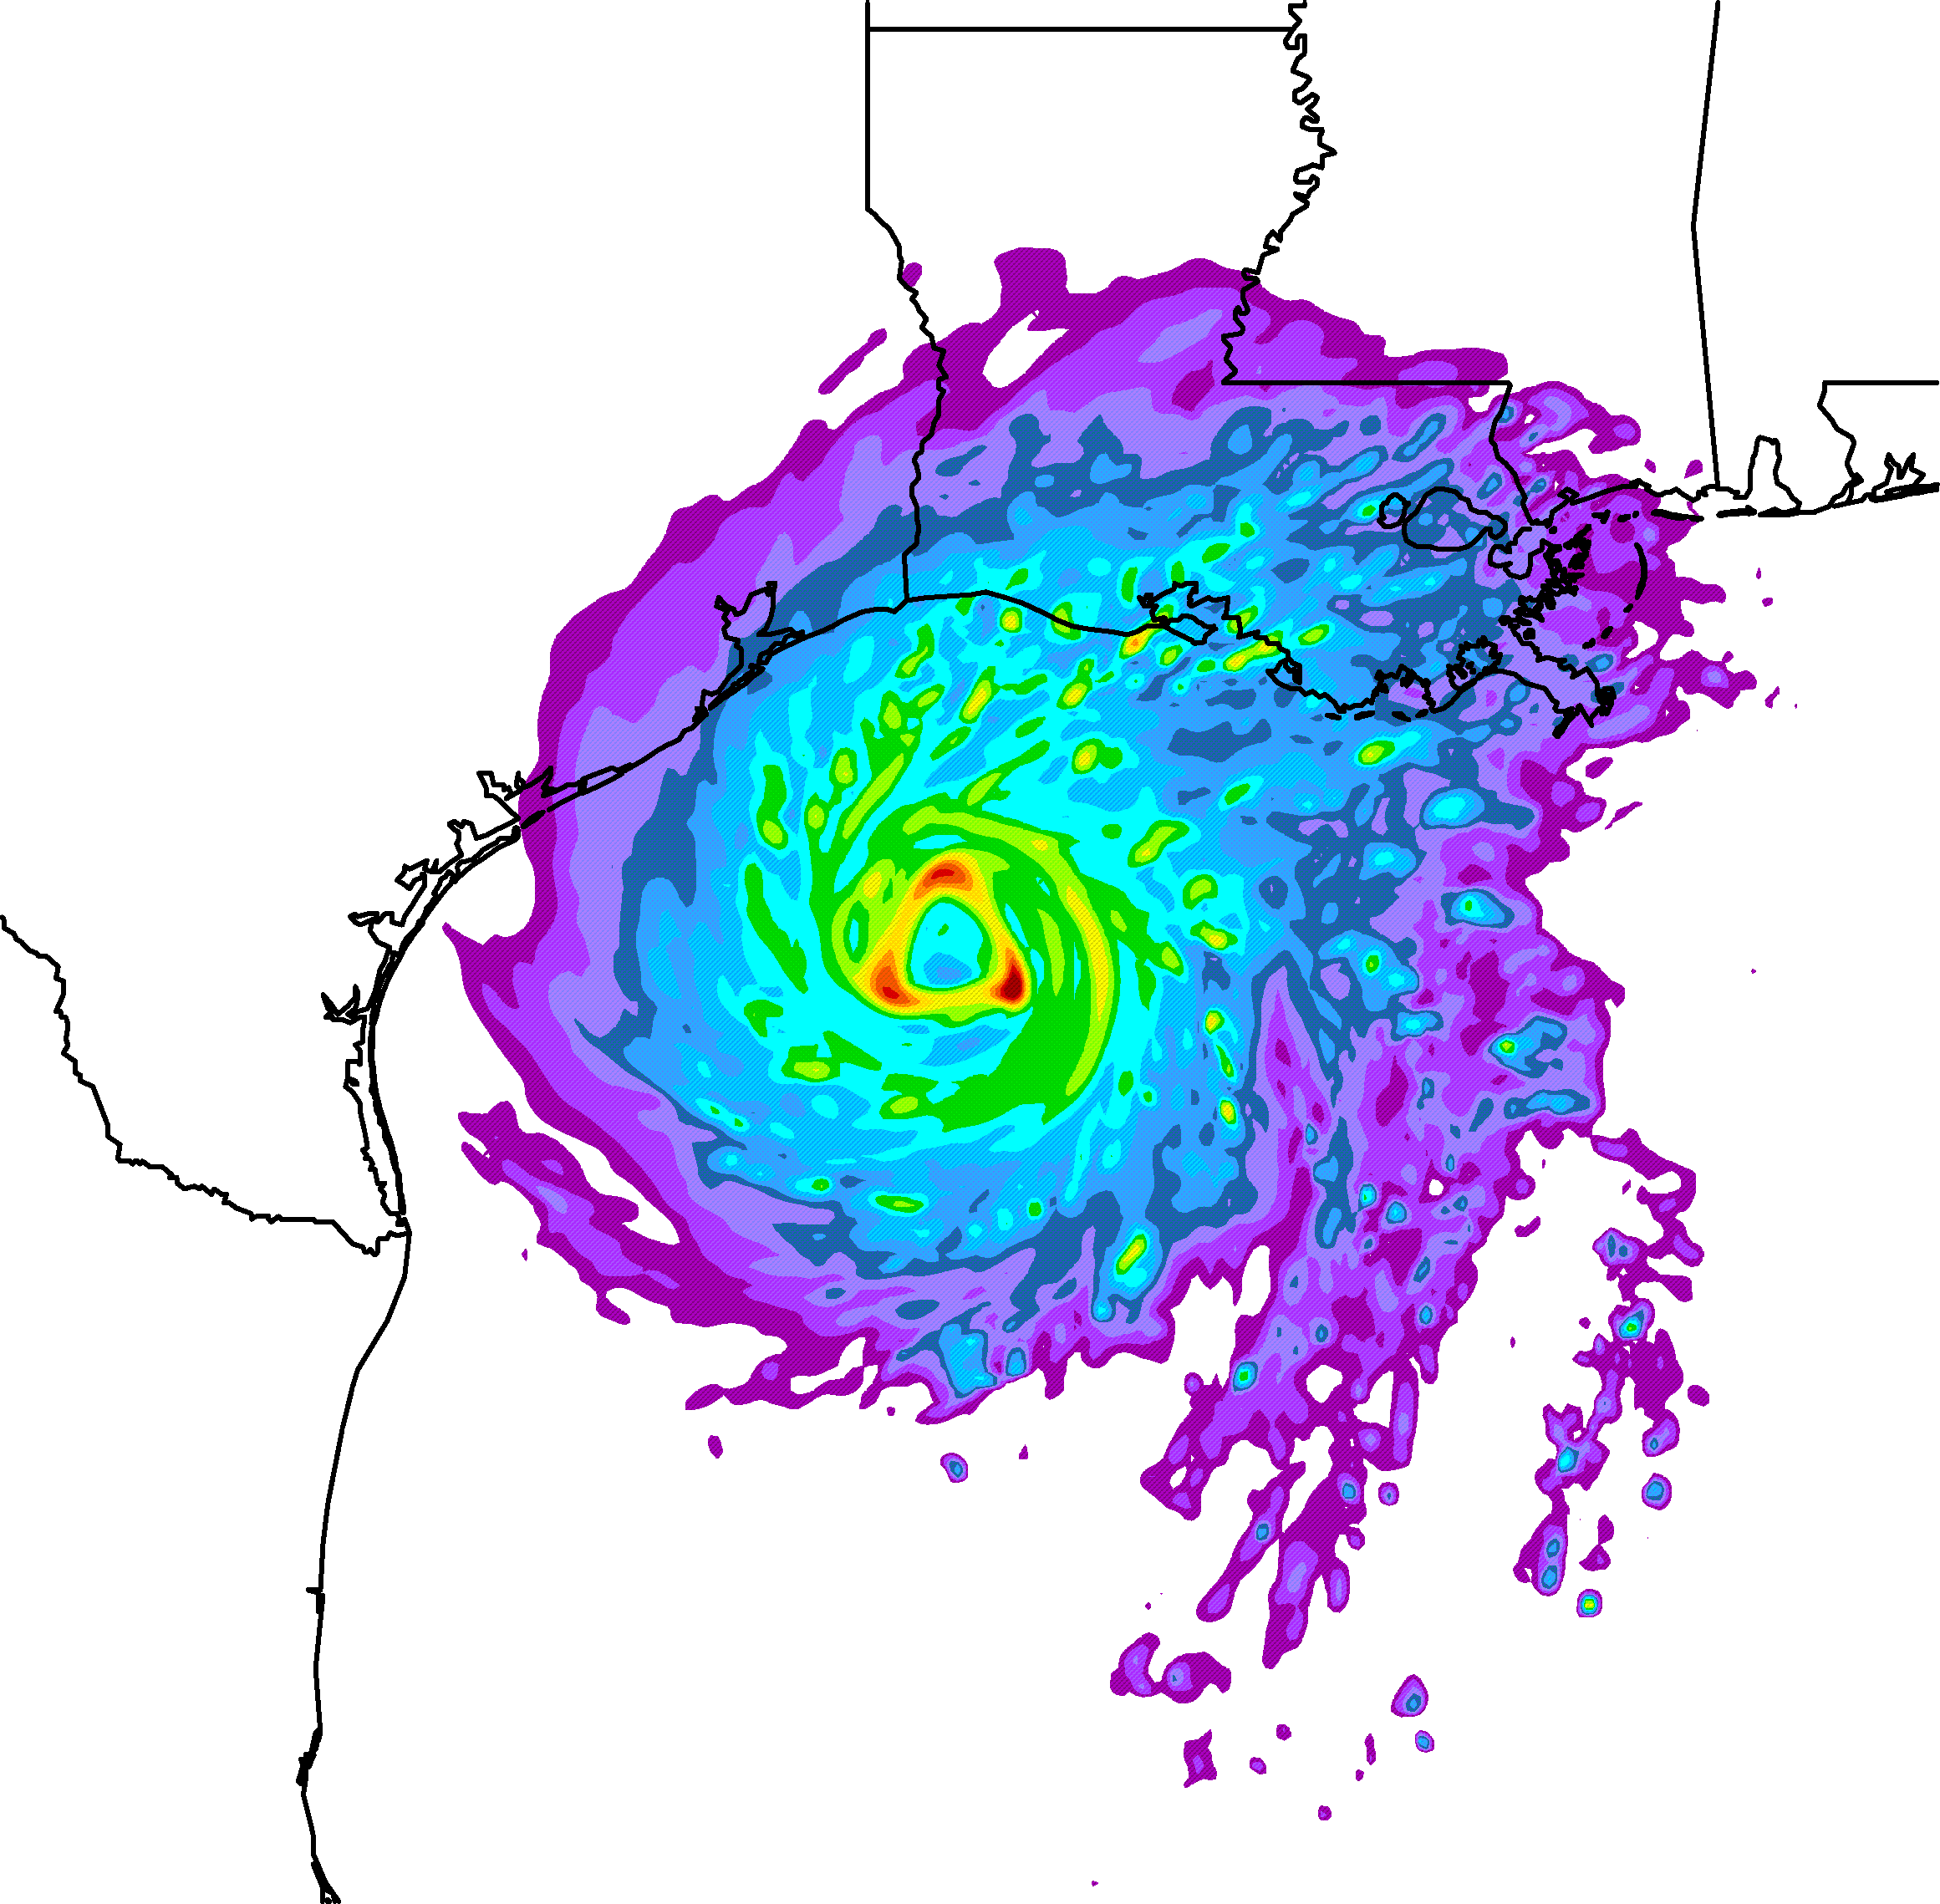
The vertices of the polygonal eyewalls (three in the case of the Rita triangular eyewall above) show up equally well in the fields of radar reflectivity and precipitable water (the column integrated water vapor) and thus a combination of both are shown in the animations below highlighting the ubiquitous nature of elliptical, triangular, square, and higher wavenumber polygons in the eyewalls of WRF simulated TCs across different resolutions and incarnations of the model.
* A triangular eyewall is evident throughout most of the run, becoming more distinct as Rita approaches the Texas coast
~ Hurricane Rita, retrospective AHW 2.1, 18 UTC 21 September - 12 UTC 23 September (forecast hours 18-60), 1.33 km precipitable water
* Triangles, squares and pentagons abound in this higher spatial resolution animation
~ Hurricane Wilma, real time AHW 2.1, 00 UTC 20 October - 00 UTC 24 October (forecast hours 01-96), 4 km Reflectivity
* Note the triangular eyewall from 21 UTC 20 October - 04 UTC 21 October (frames 21-28) and again after 00 UTC 23 October (frames 72+)
~ Hurricane Katrina, retrospective AHW 2.1, 00 UTC 28 August - 11 UTC 29 August (forecast hours 24-59), 1.33 km precipitable water
* Note the square eyewall from 1700-2000 UTC 28 August (frames 18-21) that transitions to a triangle at 2100 UTC
~ Hurricane Katrina, retrospective AHW 2.2, 00 UTC 28 August - 12 UTC 29 August (forecast hours 24-60), 1.33 km precipitable water
* This newer version of the model has fewer squares, more rounded quadrilaterals, and a spectacular triangular eyewall on 29 August (frames 26-29)
TCs were captured (e.g. Lewis and Hawkins 1982), but only recently has
their existence been explained using barotropic instability in a series of
papers by Wayne Schubert and James Kossin (Schubert et al. 1999;
Kossin and Schubert 2001, 2004; Kossin et al. 2002, 2004; ), although the
idea was first proposed by Muramatsu (1986). Briefly, mature and rapidly
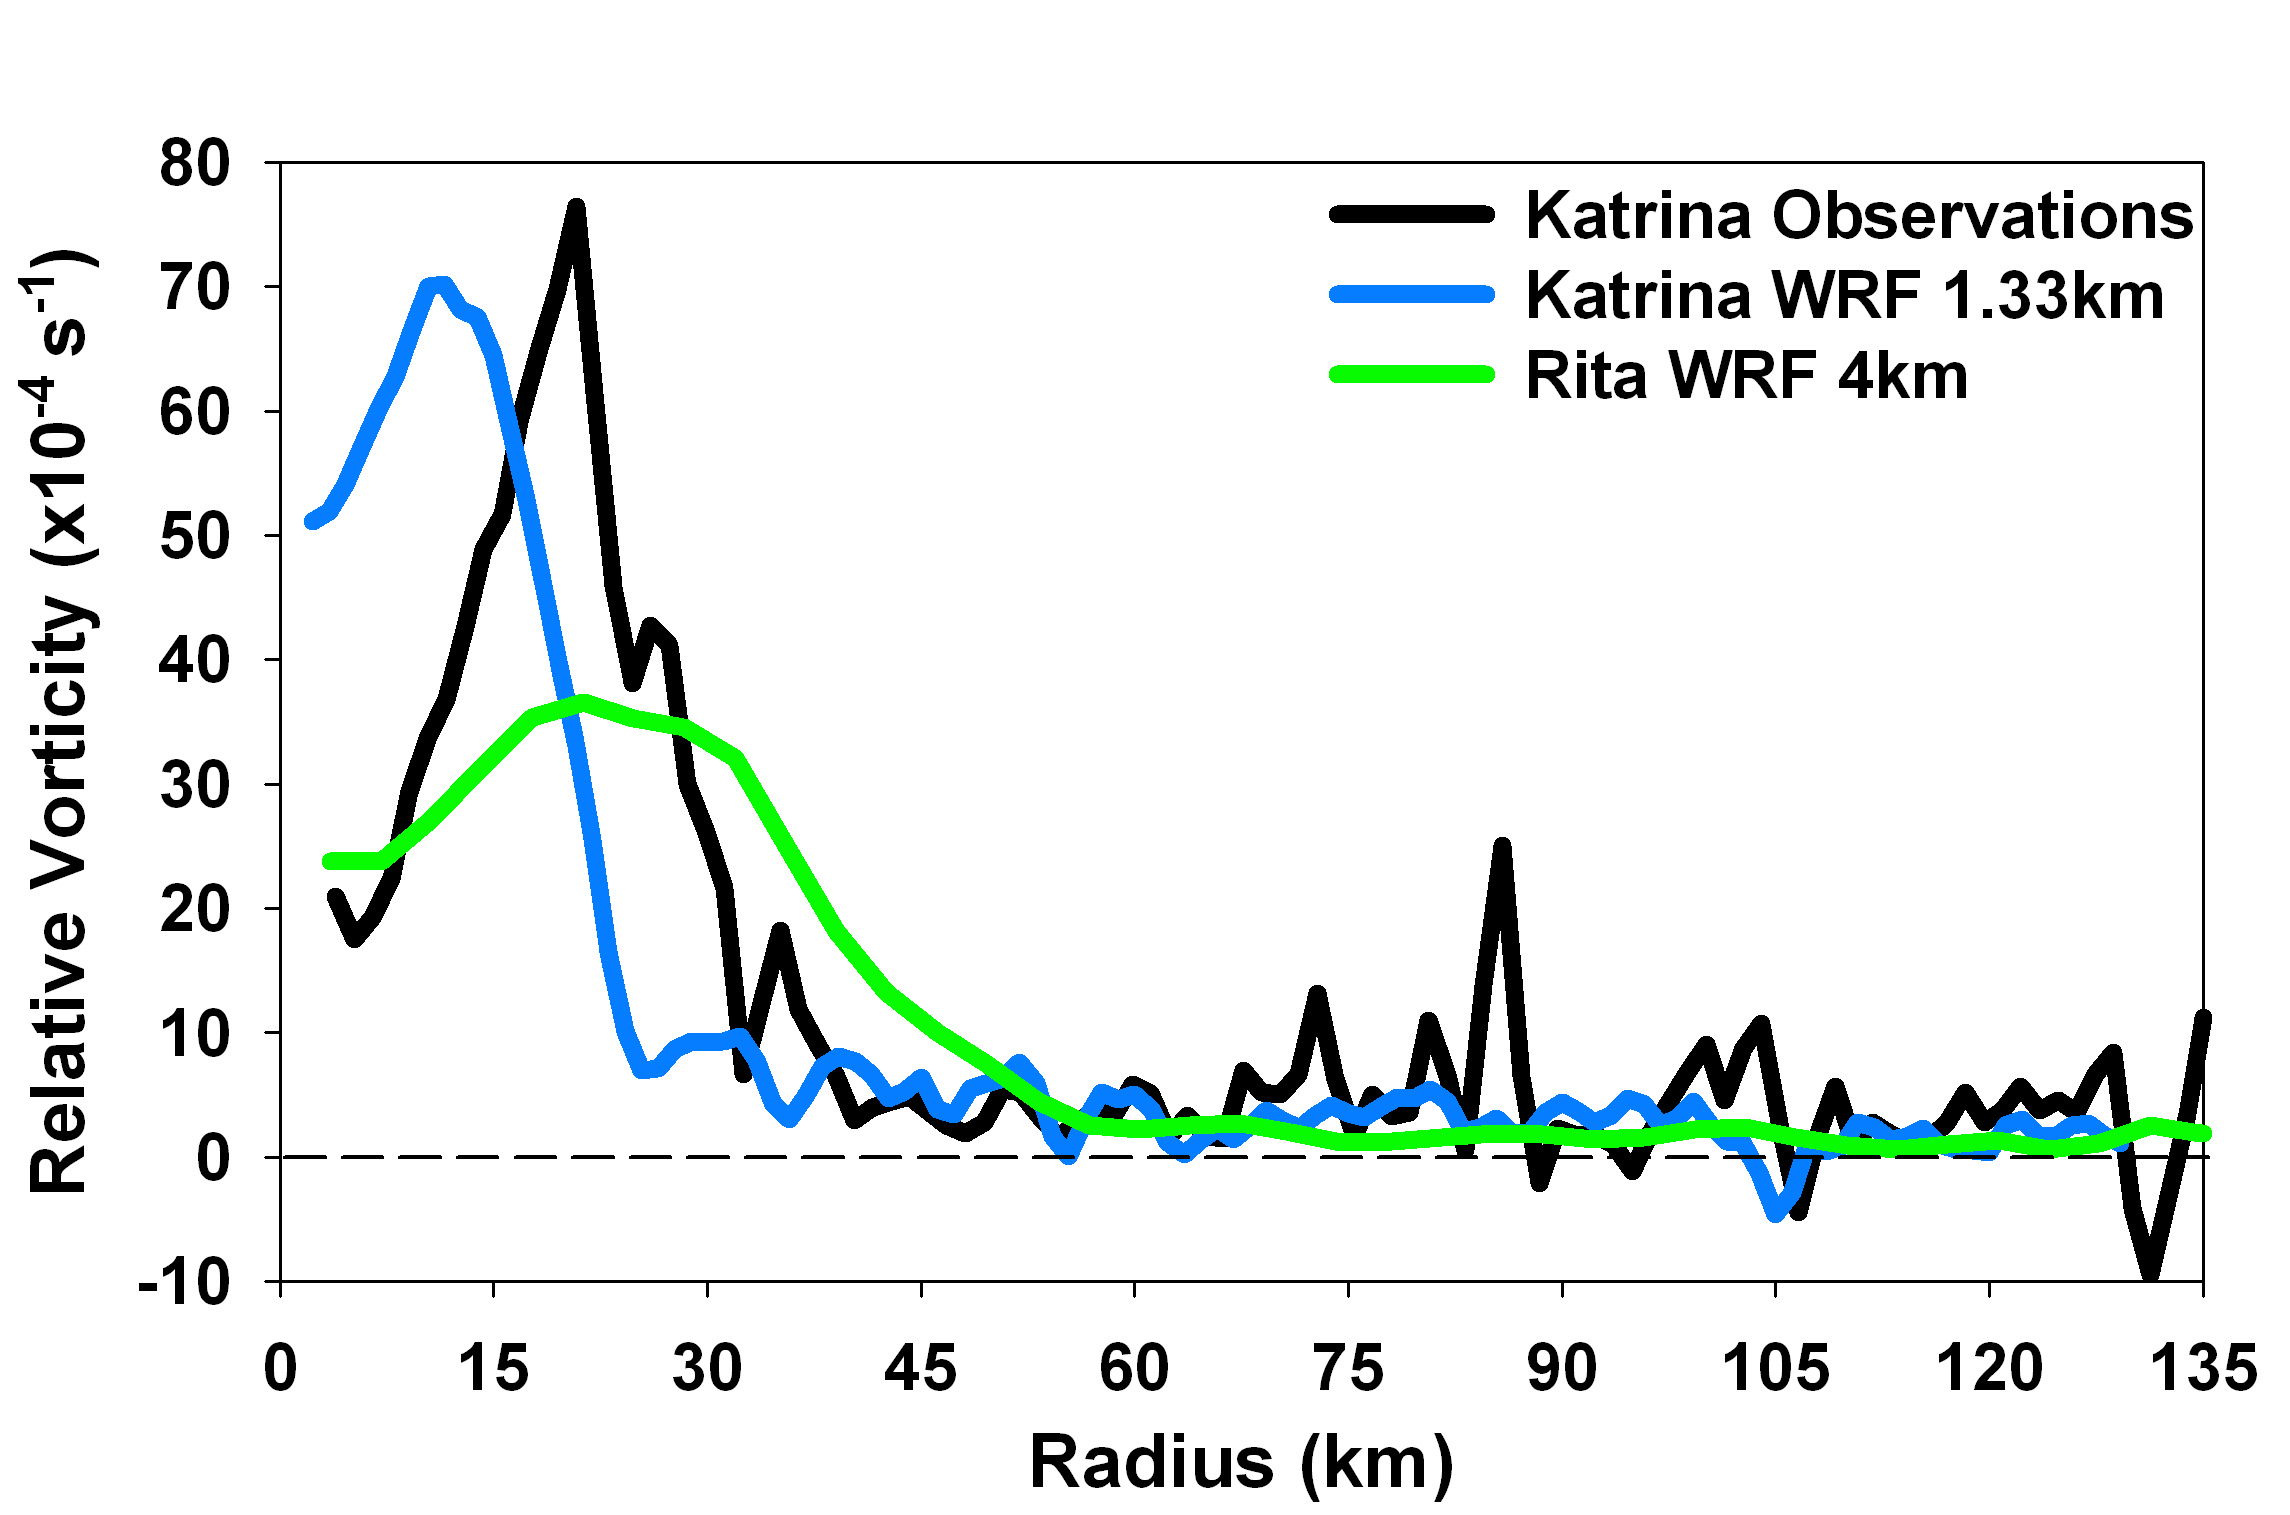
intensifying TCs exhibit elevated rings of potential vorticity (or relative
vorticity; see image at right) on the inner edge of the eyewall (Kossin and
Eastin 2001; Mallen et al. 2005). Analogous to Rossby waves in the large
scale circulation of the Earth, counter-propagating waves with respect to
the flow (deemed vortex Rossby waves or VRWs; Montgomery and
Kallenbach 1997) exist on the oppositely signed radial gradients of
potential vorticity (PV).

If these waves become phase-locked, they grow in concert and lead to the exponential
instability of the ring, whereby the eyewall vorticity pools into discrete areas, creating
mesovortices (see Figure 3 of Schubert et al. 1999). Depending on the initial conditions of
the PV ring, the mesovortices either merge over time and relax to a monopole (Schubert et
al. 1999; Chen and Yau 2003), or remain separate to form a quasi-steady,
cyclonically-rotating lattice of vortices that give the appearance of elliptical (two
mesovortices), triangular (three mesovortices) or polygonal (four or more mesovortices)
eyewalls (Kossin and Schubert 2001).
While most of the polygonal shaped eyewalls are short lived (< 2-3 hr) and change readily
between shapes and intervals of roundness in both nature and the WRF model, TCs (real
and simulated) will sometimes "lock on" to shapes for several hours such as the starfish in
Hurricane Isabel (2003) (left; Kossin and Schubert 2004) and the triangle or squares
and triangles in the WRF simulated Rita and Katrina, respectively. Higher temporal
resolution model output (every 10 min) was generated for these instances so the direction
and rate of rotation of the vertices could be determined and compared to theory and
previous observational studies of polygonal eyewalls.
High temporal Resolution (10 min) Precipitable Water Loops
~ Hurricane Katrina, retrospective AHW 2.1, 12-18 UTC 28 August (forecast hours 36-42, every 10 min), 1.33 km precipitable water
* Squares and pentagons abound in this higher time resolution loop
~ Hurricane Katrina, retrospective AHW 2.2, 01-03 UTC 29 August (forecast hours 49-51, every 10 min), 1.33 km precipitable water
* A long lived triangular eyewall appears to rotate clockwise in this newer version of the model
In the loop above, a distinct maximum in eyewall precipitable water (PW) can be traced cyclonically around from due west of the center at 0140 UTC, to south of the center at 0150 UTC, east at 0200 UTC, north at 0210 UTC and northwest at 0220 UTC. The feature can also been seen as a local maximum in eyewall relative vorticity and thus can be identified as an eyewall mesovortex.
The mesovortex completed one full rotation of the eyewall at a radius of 20 km in just over 40 min, with a speed of ~50 m s-1. Assuming this feature behaves as a linear edge wave (Lamb 1932), since it's propagating on the very steep vorticity gradient shown above, it should have a speed of C = Vmax(1-1/n), where Vmax = the maximum tangential wind speed = 70 m s-1 and n = azimuthal wavenumber = 3, or C = 47 m s-1. Thus, it appears this wavenumber 3 feature is indeed an eyewall mesovortex that exhibits the propagation characteristics of a PV edge wave, consistent with the studies of Kuo et al. (1999) and Reasor et al. (2000). It remains to be seen, however, if the real Hurricane Katrina (2005) exhibited such persistent eyewall mesovortices.
 The very active 2005 Atlantic TC season was
fortunate enough to feature
the
Hurricane Rainband and Intensity Change
The very active 2005 Atlantic TC season was
fortunate enough to feature
the
Hurricane Rainband and Intensity ChangeExperiment (RAINEX) which was designed to explore the dynamic relationships between the eyewall, inner spiral rainbands
and intensity change in tropical cyclones. Extensive observations were collected in both Katrina and Rita and copious
amounts of data are available to validate our WRF simulations against and to investigate whether the storms actually
featured the realistic looking polygonal eyewalls simulated with the model.
Hurricane Wilma also shows no indications of a triangular eyewall in this LOOP of lower fuselage
radar images from 1842-2309 UTC 20 October. This is in stark contrast to plot to the left which
shows the 23 h forecast of precipitable water from the real time, 4 km WRF run of Wilma initialized
at 00 UTC 20 October (the same run shown in the Wilma reflectivity loop above).
The first two images of the loop do, however, show some straight line edges to the eastern half of
the eyewall and there is a hint of a pentagon- or hexagon-shaped eyewall at 2019 UTC.
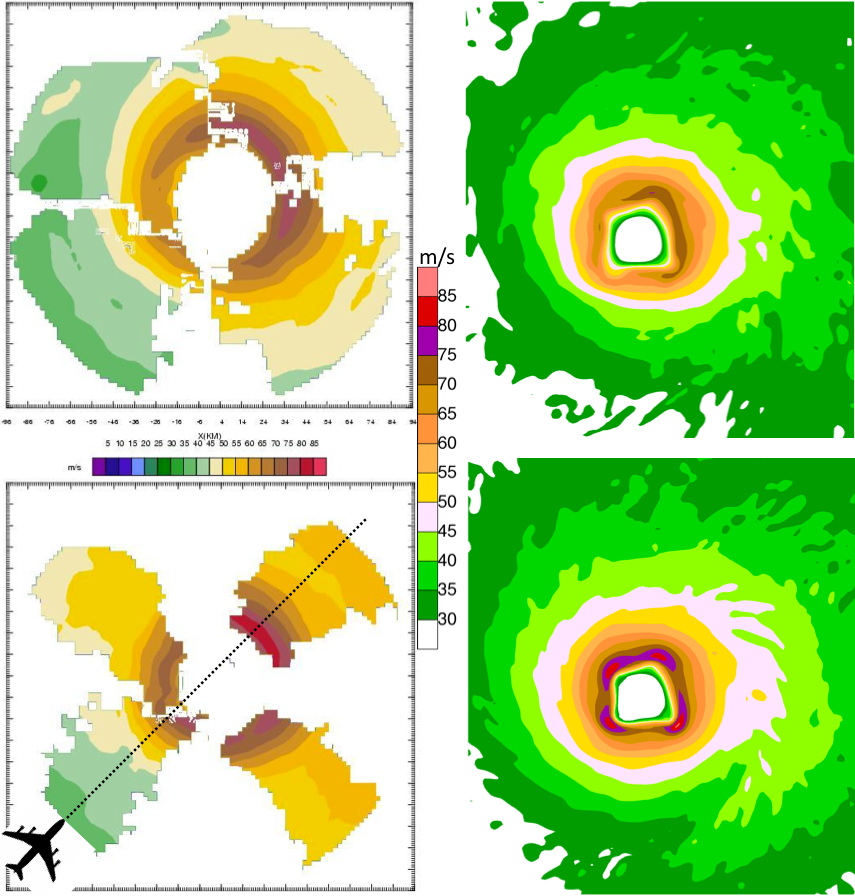
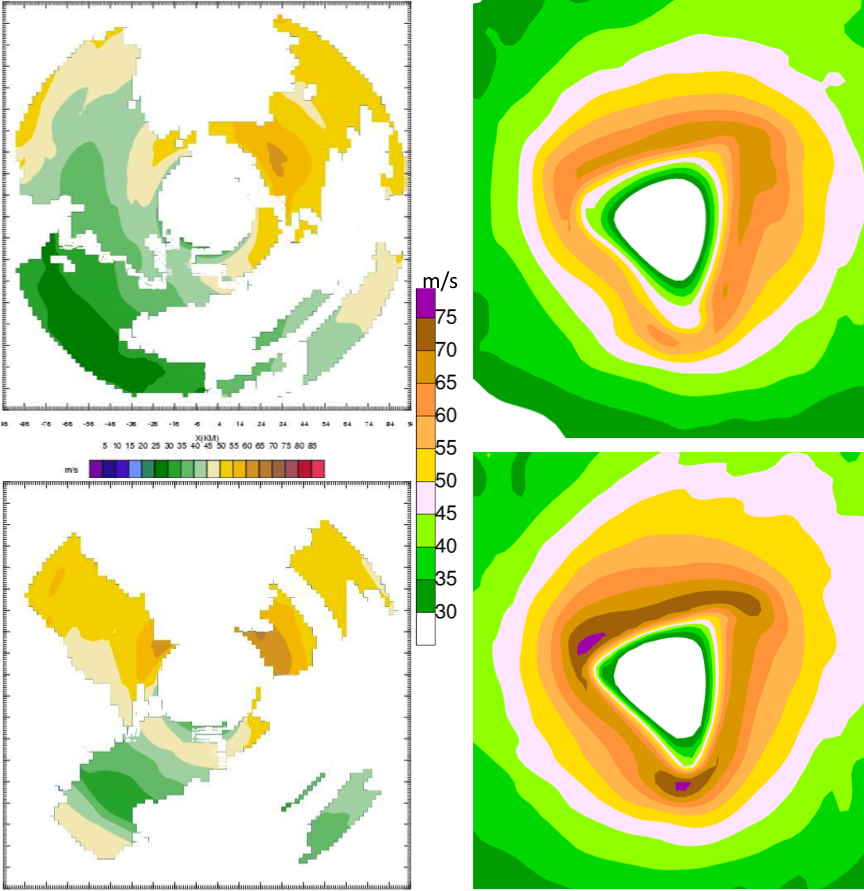
Right: Rita HRD composite winds 2015-2208 UTC 23 September and AHW 2.1 4 km winds at 01 UTC 24 September.
The geometric patterns and distinct maxima in reflectivity, precipitable water and relative vorticity discussed above also stand out clearly in the total wind field, especially at .5 km (bottom right frame of each panel). No such wavenumber 3 (triangle; Rita, right) or 4 (square; Katrina, left) asymmetries show up in the observations, which reveal more of a wavenumber 1 pattern with maximum winds north and northeast (downshear to downshear right) of the center. This pattern is captured by the AHW simulations at the 3 km level (top right frame of each panel), as is the larger radius of hurricane strength winds in the northwest quadrant. The radial profile of the winds, however, is much too narrow (i.e., the wind speed decreases much too quickly with radius) in all quadrants except to the southwest.
Finally, the AHW 2.1 1.33 km simulated eye size is consistently too small (see above left plots for Katrina), while the 4 km simulated eye size (see above right plots for Rita) is much closer to the observations recorded in both storms.
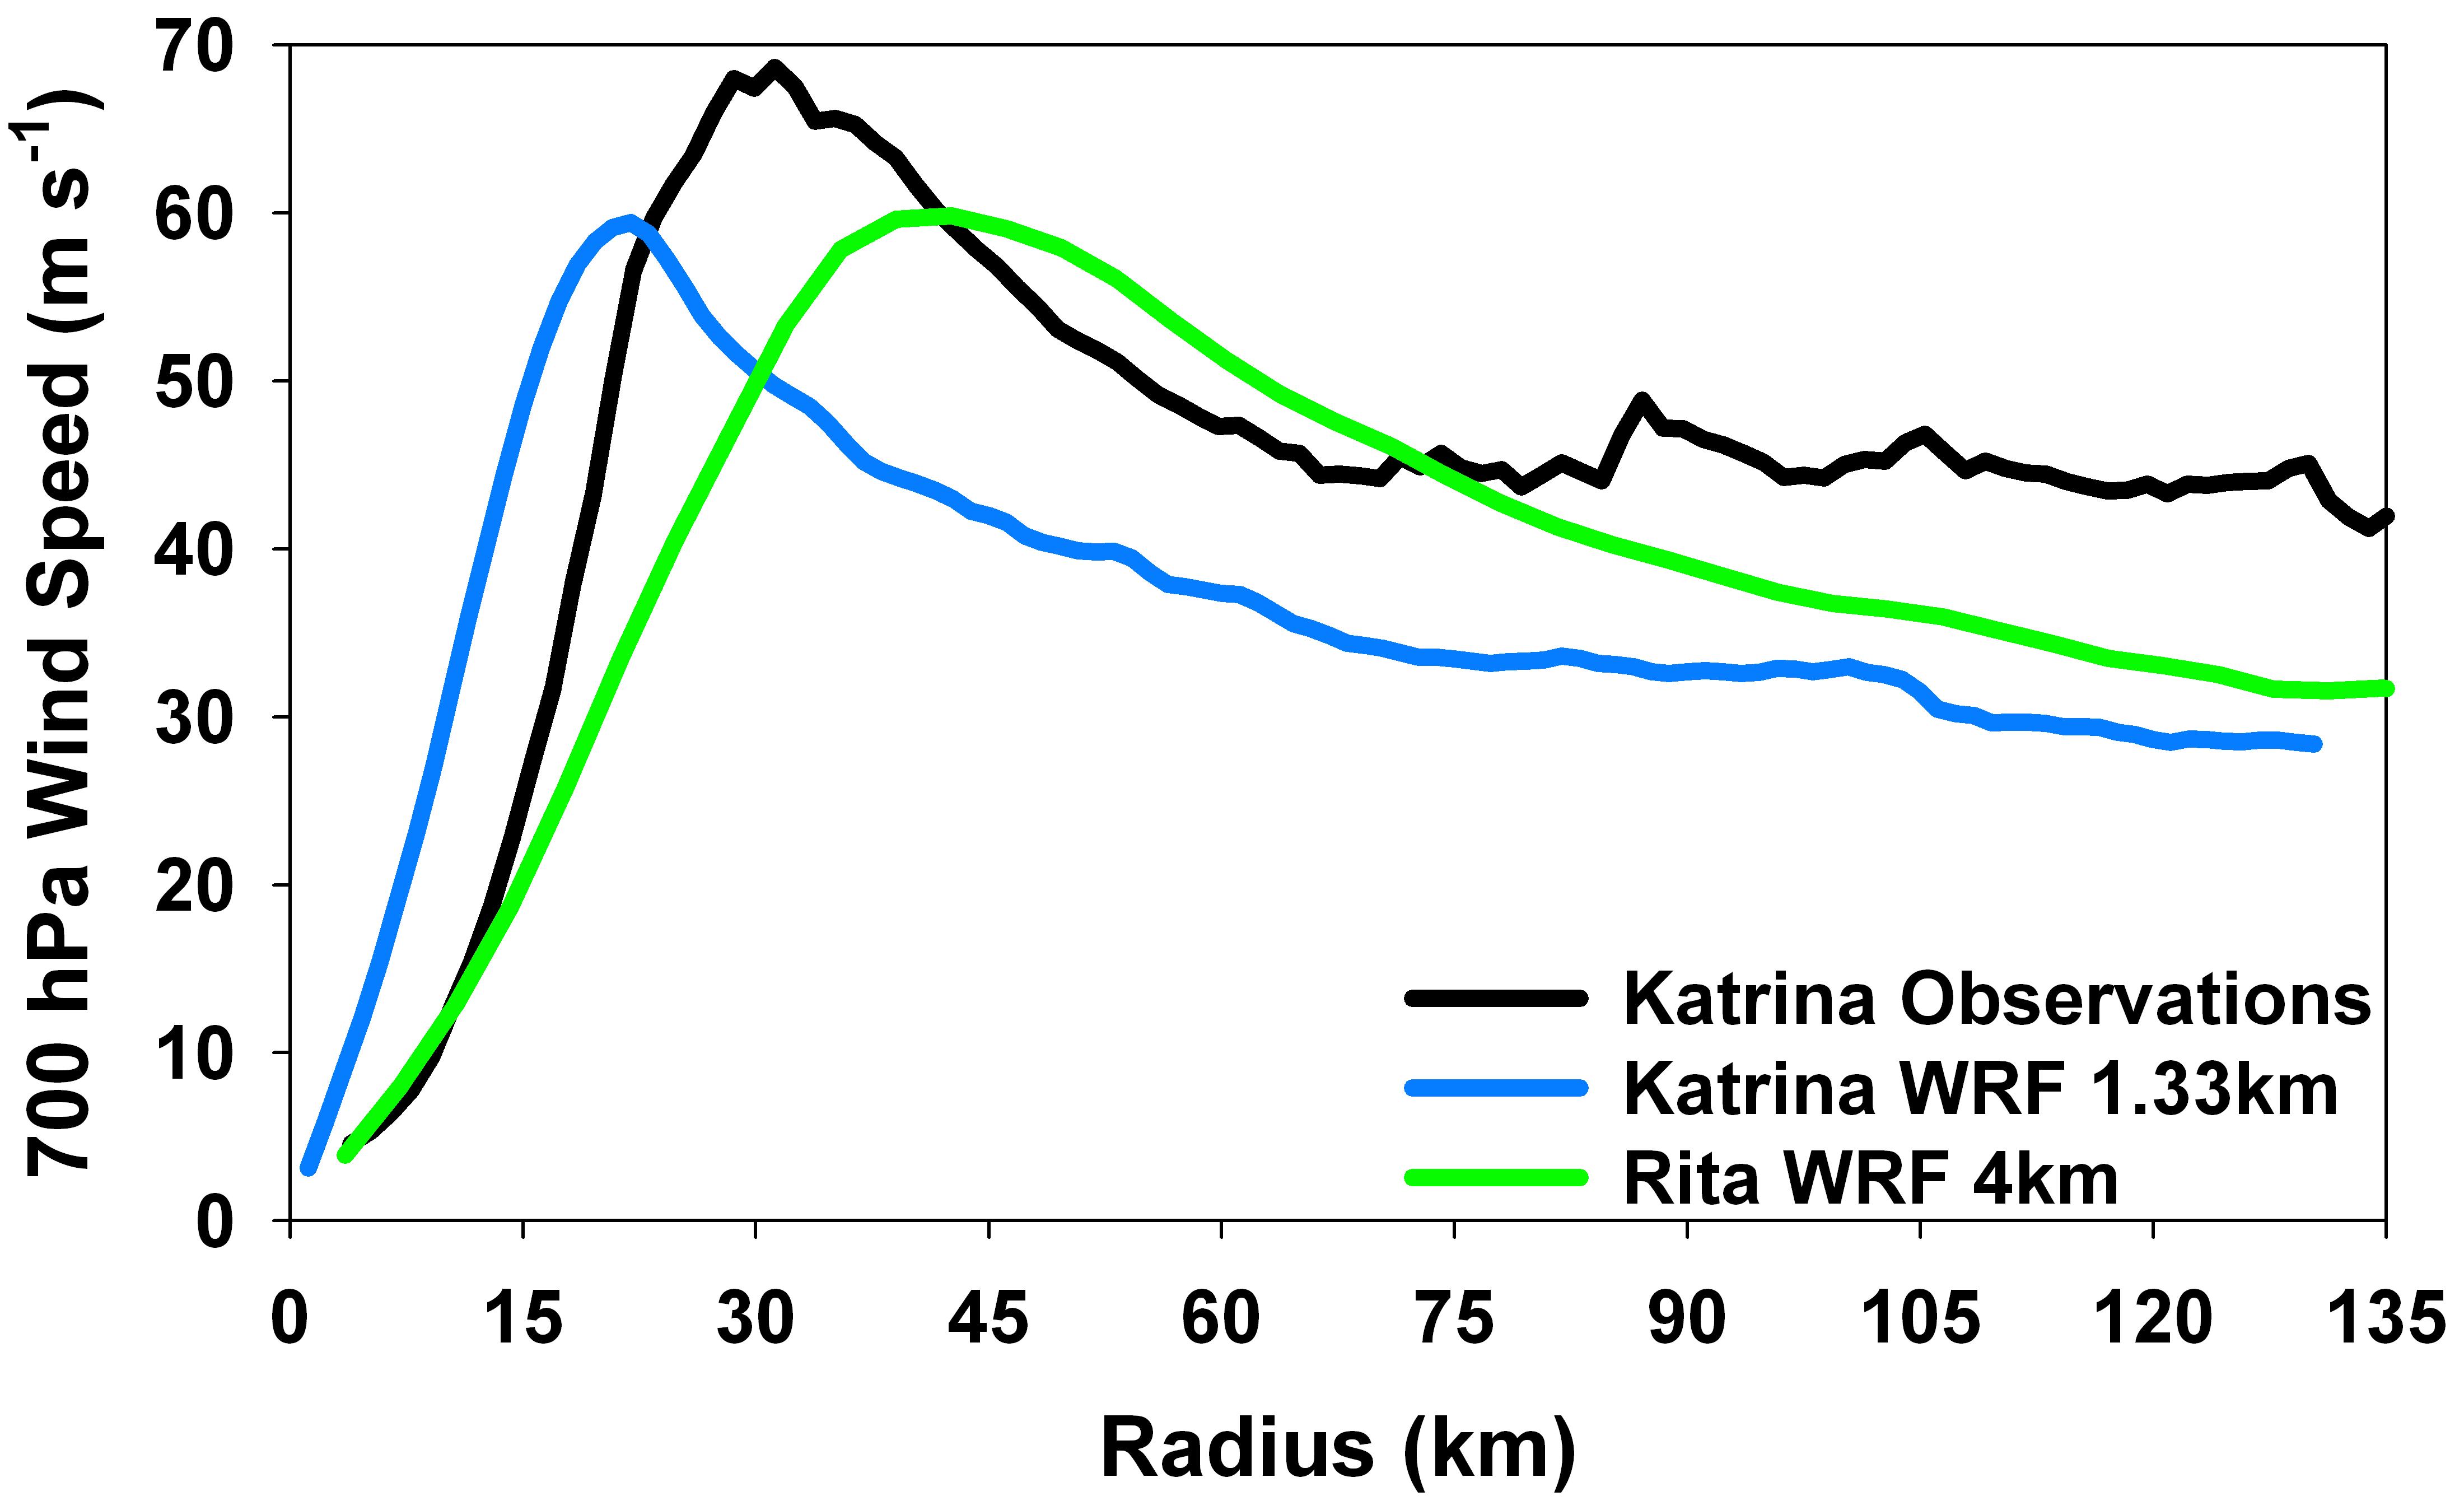
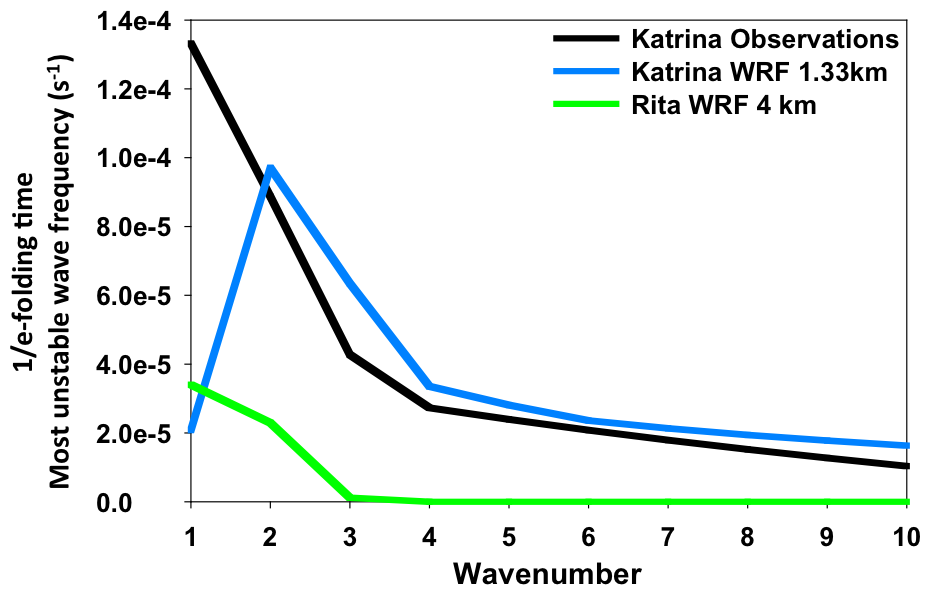
Because of the difference between the simulated and observed radial profiles of tangential wind speed noted above and shown in the left panel above, it is possible that the AHW simulated Katrina and Rita may support higher wavenumber asymmetries than the real storms. To address this question, a linear stability analysis (code provided by M. Bell and M. Montgomery of the Naval Postgraduate School) of the radial profiles of relative vorticity (see radial vorticity plot next to the discussion on VRWs and mesovortices above) was conducted.
As can be seen in the right panel above, the 1.33 km WRF simulation of Katrina is most unstable to wavenumber 2, with significant wavenumber 1-4 instability, while the observations show the real Katrina was most unstable to wavenumbers 1 and 2. The 4 km WRF simulation of Rita is most unstable to wavenumbers 1 and 2, with very little instability at higher wavenumbers, consistent with its wider vorticity peak and gentler vorticity gradients (Schubert et al. 1999). Thus, the linear stability analysis reveals no "smoking guns" when it comes to the fastest growing modes being the wavenumber asymmetries most often seen in the simulations. Other possible explanations for the exceeding active wavenumber 3 and 4 asymmetries in the simulated storms may be insufficient cloud microphysical schemes, model resolution or Cartesian grid geometry. These options are currently being explored in the AHW model.