The top two diagrams represent projections of analysis fields and
the GFS (left) and ECMWF (right) model forecasts onto the Wheeler and
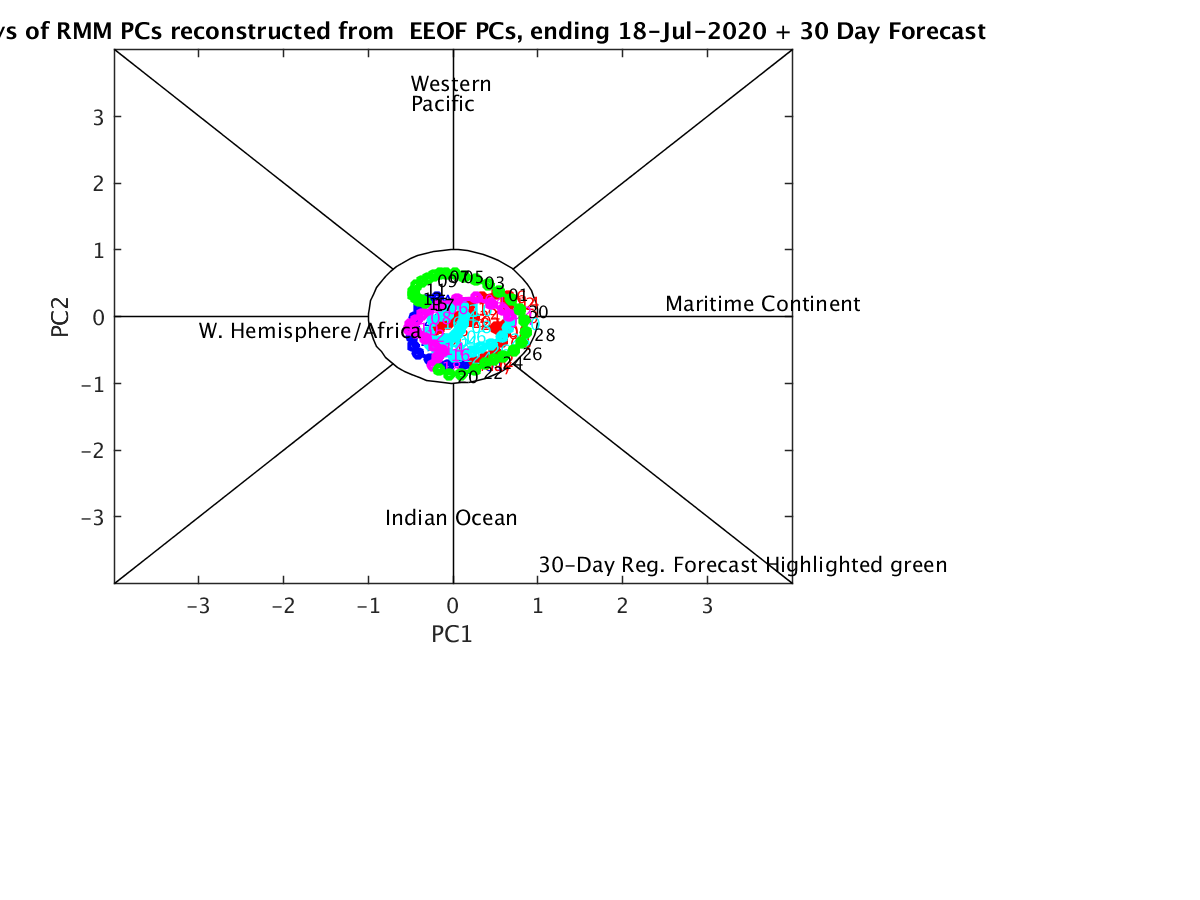
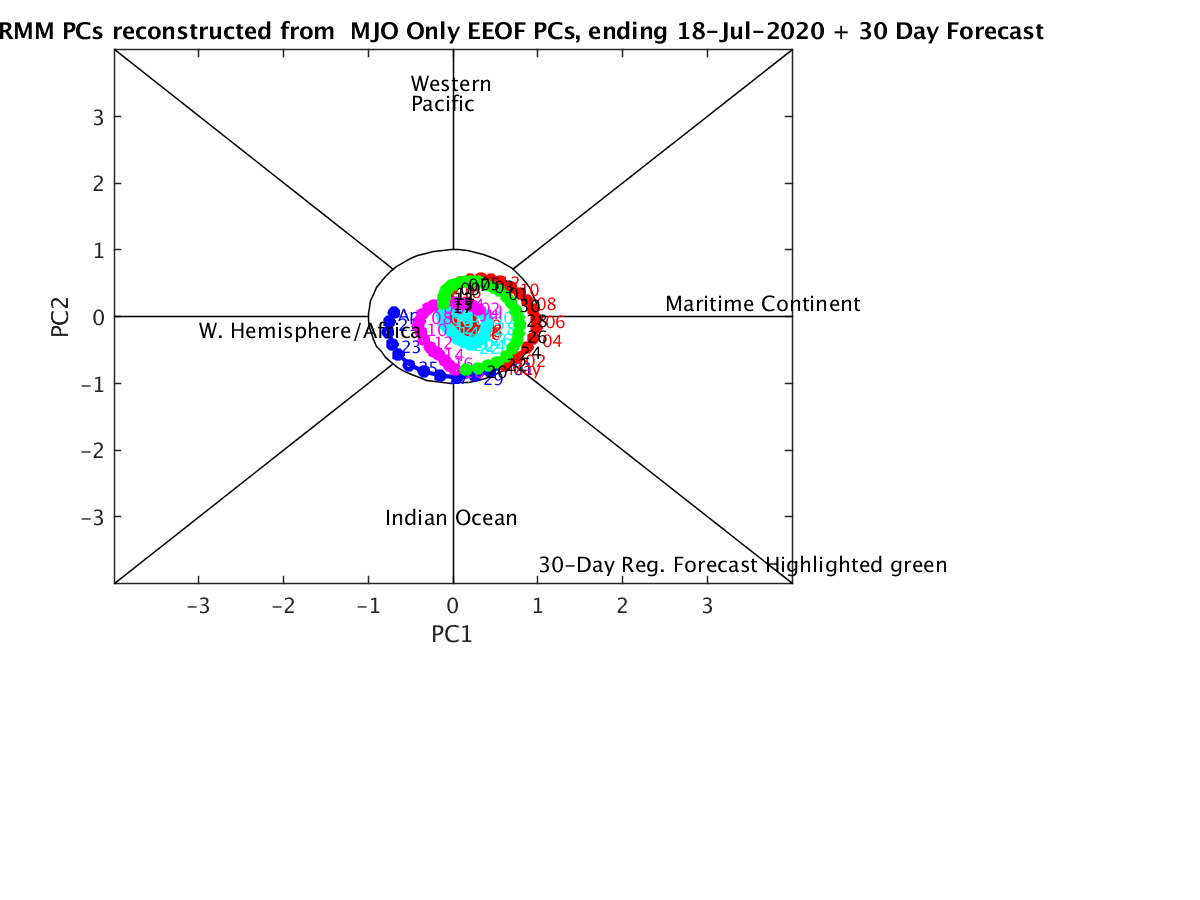
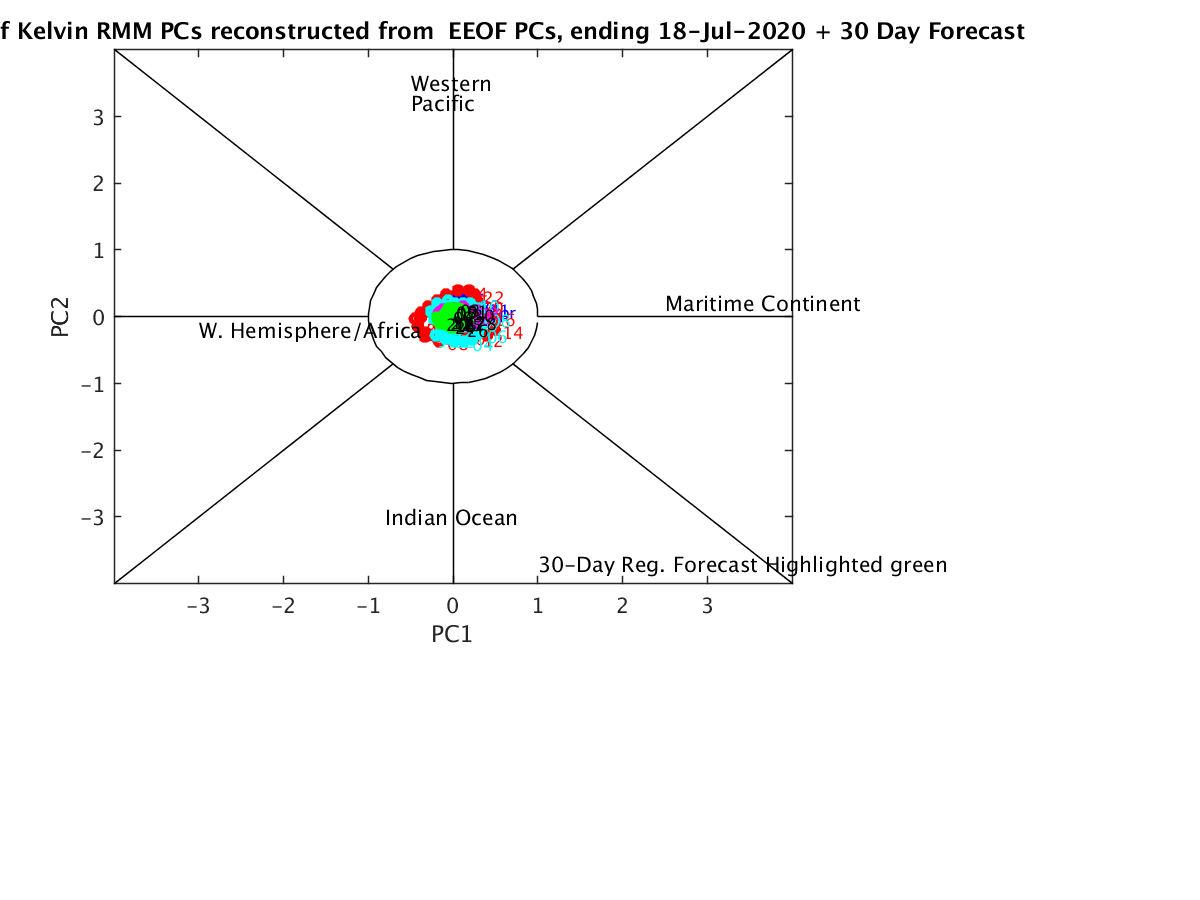
Hendon RMM PCs. The bottom four are statistical representations and forecasts
of the RMM PCs,with the one on the second row on the left including OLR projections of
the MJO and convectively coupled equatorial Rossby and Kelvin waves,
and the one on the right in the second row including only signals originating from zonal
wave numbers 0-9 eastward and periods of 30-100 days. The bottom left
figure includes only the contribution from the equatorial Rossby
wave band, while the one on the bottom right includes only the
contributions of the convectively coupled Kelvin wave band.
Clicking on the bottom
four figures provides the corresponding text files.


Click on the bottom two images to obtain the corresponding text files.