Map Disco: 22 Nov 2013
Busted Models and Mediterranean Mischief
Busted Models
ECMWF Fantasy Cyclone
Comparison of deterministic ECMWF vs. Ensemble mean
(192 hr forecasts verifying 0000 UTC 15 Nov) Nick Schiraldi
Full Ensemble Bust
Original map post email from Anthony Fracasso
(13 Nov) - Anthony Fracasso
500 hPa geopotential height spaghetti plot depicting various ensembles from EPS, GEFS with verifying solution (white line)
(204 hr forecasts valid 1200 UTC 11 Nov) - Anthony Fracasso
Comparison of 500 hPa Geopotential Height Error between the GEFS and EPS
(204 hr forecasts valid 1200 UTC 11 Nov) - Anthony Fracasso
Verifying 500mb height pattern with standardized anomalies
(1200 UTC 11 Nov) - Mike Bodner / WPC
500 hPa Geopotential Height ECMWF ensemble normalised standard deviation
(192 hr forecast valid 1200 UTC 12 Nov) - ecmwf.int
Mediterranean Mischief
In House Graphics
GFS Analysis and Forecast: Atlantic Ocean and Europe
Synoptic Overview(DT/Irro.Wind/PW,MSLP,Jets/500-hPa vort./Coupling Index/Thermal vorticity)
(0000 UTC 5 Nov - 0600 UTC 30 Nov) Alicia Bentley
GFS Analysis and Forecast: Mediterranean
Integrated Vapor Transport (1000-700 hPa) - 850 hPa Geopotential Height
(0000 UTC 17 Nov - 1800 UTC 19 Nov) Ben Moore
CAPE - PMSL - 10m Wind
(1200 UTC 17 Nov - 1800 UTC 19 Nov) Ben Moore
48-h backwards kinematic air parcel trajectories where gridpoints >90% RH over Sardinia, Italy
(1200 UTC 17 Nov - 0000 UTC 19 Nov) Ben Moore
Vertical Cross Section of Theta-E, Omega, Mixing Ratio, and Zonal Wind (0-15oE)
(0000 UTC 15 Nov - 1800 UTC 19 Nov) Julian Quinting
GFS Analysis and Forecast: North America
Synoptic Overview(DT/Irro.Wind/PW,MSLP,Jets/500-hPa vort./Coupling Index/Thermal vorticity)
(0000 UTC 5 Nov - 0600 UTC 30 Nov) Alicia Bentley
GFS Analysis and Forecast: Pacific
Synoptic Overview(DT/Irro.Wind/PW,MSLP,Jets/500-hPa vort./Coupling Index/Thermal vorticity)
(0000 UTC 1 Nov - 0600 UTC 30 Nov) Alicia Bentley
Satellite Imagery
CIMSS Satellite Blog
(22 Nov 2013) - CIMSS / University of Wisconsin - Madison
----
Color Enhanced Infrared Large Scale Satellite Loop
(00 UTC 15 Nov - 00 UTC 20 Nov 2013)
----
Color Enhanced Water Vapor Satellite Loop
(00 UTC 15 Nov - 00 UTC 20 Nov 2013)
----
Color Enhanced Infrared Satellite Loop - Zoomed In
(08:00 UTC - 18:30 UTC 18 Nov 2013)
----
Visible Satellite Loop - Zoomed In
(08:00 UTC 5 Nov - 18:00 UTC 18 Nov 2013)
Radar Imagery
Radar Rain Rate (mm/hr) + IR Satellite of Italy
(01:00 UTC 18 Nov - 01:00 UTC 19 Nov 2013)
Radar Rain Rate (mm/hr) + IR Satellite of Italy
(01:00 UTC 19 Nov - 01:00 UTC 20 Nov 2013)
Radar Reflectivity (dBZ) of Severe Weather Outbreak
(16:00 UTC 17 Nov - 12:00 UTC 18 Nov 2013) Philippe Papin
Surface Observations
Sardinia, Italy Observations
(14 Nov - 20 Nov) - Dipartimento Specialistico Regionale Idrometeoclimatico
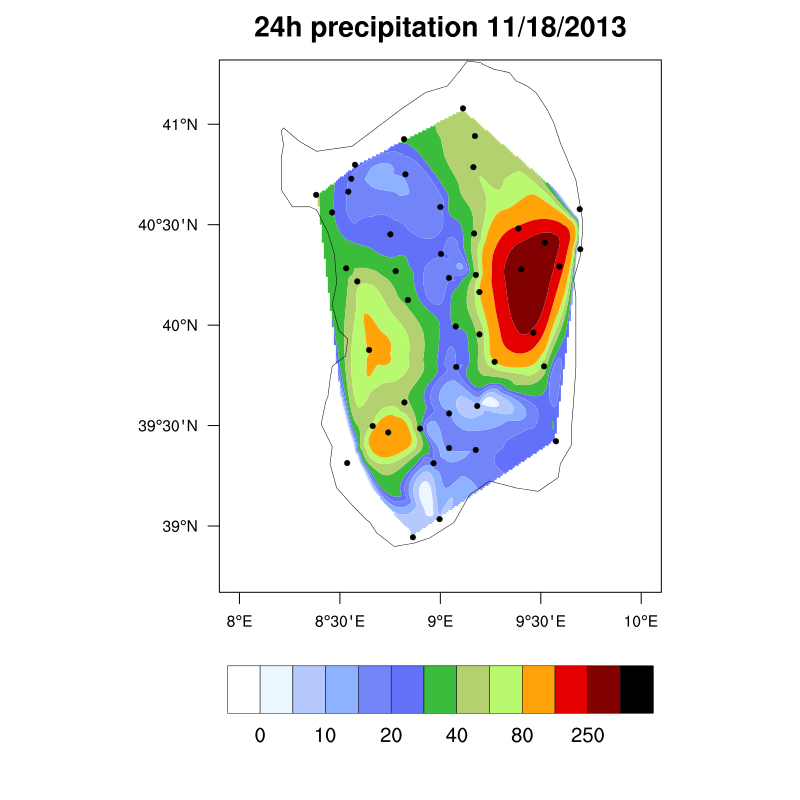
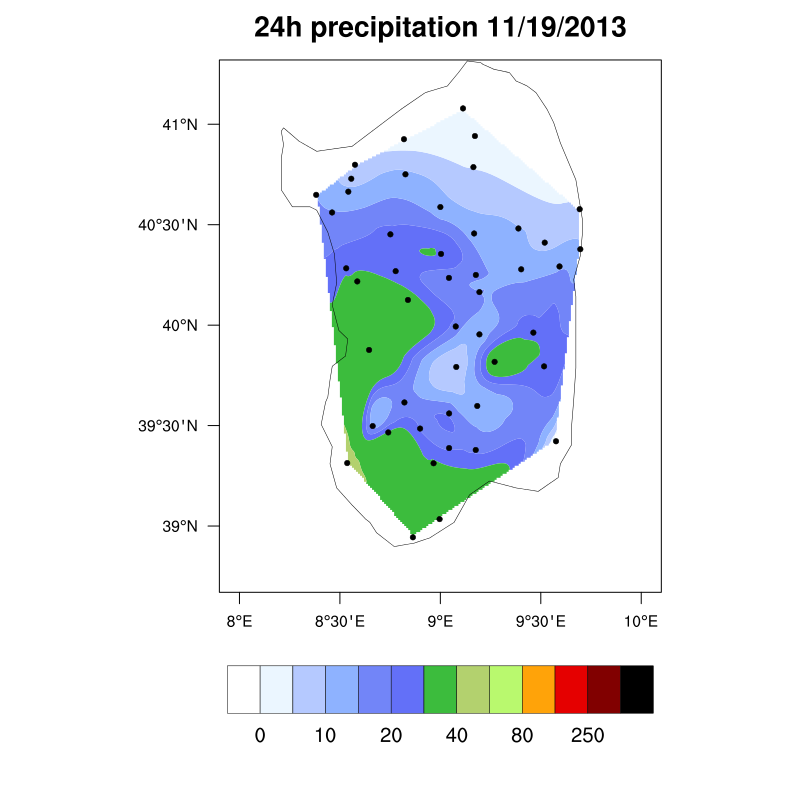
Sardinia, Italy Precipitation Totals (mm)
(18 Nov) - Julian Quinting
Sardinia, Italy Precipitation Totals (mm)
(19 Nov) - Julian Quinting
News and Media Reports
Apocalyptic storm floods parts of Sardinia, downing bridges and killing at least 16
(19 Nov) - The Washington Post
A drone's view of Illinois tornado damage
(21 Nov) - CNN
Relevant Papers
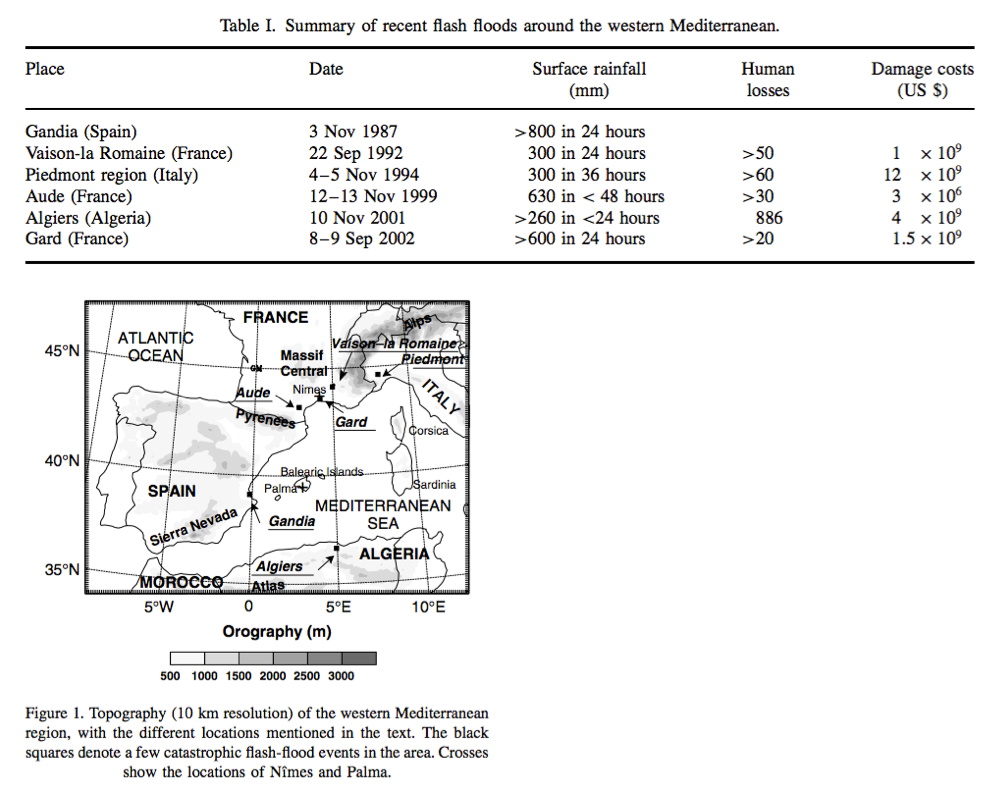
Nuissier et al. (2008)
Quarterly Journal of the Royal Meteorological Society
----
Table 1 and Figure 1
- Summary of recent flash floods around the western Mediterranean
Other Graphics
World record point precipitation measurements
Hydrometeorological Design Studies Center - NOAA - NWS
Global Sea Surface Temperatures
CIMSS - SSEC
Looking Ahead: Large Uncertainty with the Pre-Thanksgiving Storm
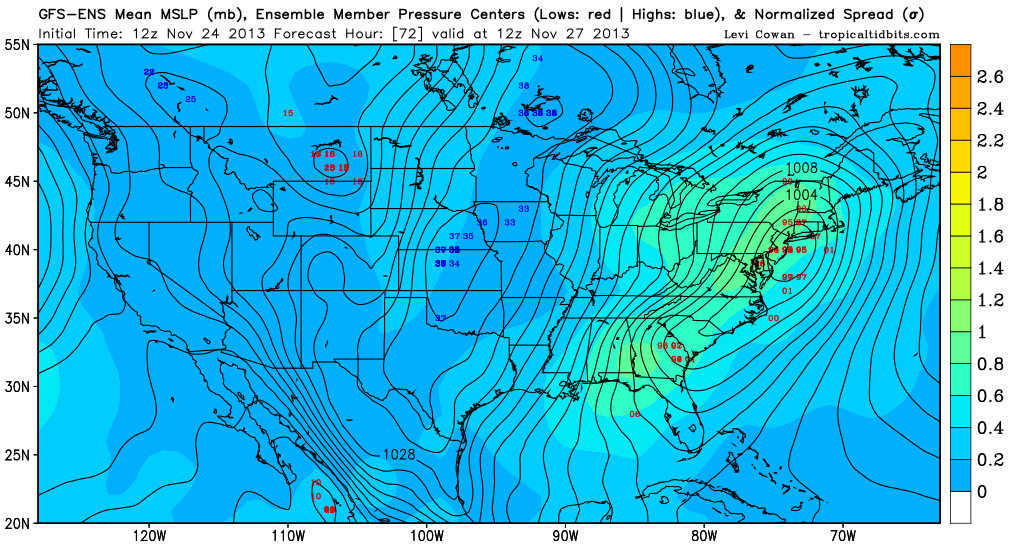
GFS Ensembles
GEFS normalized SLP spread (shading) and individual member SLP positions with min pressure (numbers)
(72 hour forecast valid 1200 UTC 27 Nov) - http://www.tropicaltidbits.com/
GEFS normalized 500 hPa geopotential height anomalies (shading) and mean (black contours)
(72 hour forecast valid 1200 UTC 27 Nov) - Kyle MacRitchie
Deterministic GFS Dprog/Dt of 500 hPa geopotential height (contours) and vorticity (shaded), and vertical velocity (blue contours)
(Forecast valid 1200 UTC 27 Nov) - Kyle Griffin
Other Miscellaneous Products
SPC Meso Archive
National Snow Analyses - NOHRSC
World Climate Index Map
Mike Ventrice's TRMM Precipitation / MJO Filtered VP200 hPa / 200 hPa Winds
Wyoming Sounding Page
Twister Data
National Buoy Data Center
Storm Prediction Center Meso-analysis
Penn State's EWALL Model Page
High Resolution Rapid Refresh Home Page
Kyle Griffin's Maps: Main Page
Ron-Mctaggart Cowan's DT Maps and Coupling Index
Heather Archambault's 2013 GFS Analyses
Tom Galarneau's Real Time Diagnostics
RAP-UCAR Real-Time Weather Data
Digital Typhoon - Typhoon Images and Information
PSD Maproom - ESRL
NeXt Generation Weather Lab - College of DuPage
Free Relief Maps
Modis Satellite Imagery World Viewer