Sarah Ditchek
Associate Scientist
Cooperative Institute for Marine and Atmospheric Studies (CIMAS) | University of Miami (UM)
Hurricane Research Division (HRD) | NOAA's Atlantic Oceanographic and Meteorological Laboratory (AOML)
TC Diurnal Pulse Archive
The graphics in this archive use the two objective metrics created by and detailed in Ditchek et al. (2019a) and Ditchek et al. (2019b) to identify pulse type and electric activity in Atlantic basin tropical cyclones (TCs), respectively. For details on data sets used and how to download the graphics in the archive, please see the README. For brief details on the criteria for both objective metrics and their associated terms and definitions, expand the below.
To objectively identify pulse type, four criteria are used:
- Cooling (Warming) Cloud Tops: lower (upper) quartile of 6-h IR BT difference values
- On-The-Clock: spatial location of cloud tops follow the diurnal clock schematic (Ditchek et al. 2019a, Fig. 2b)
- Areal Criterion: upper half of cloud-top areal coverage distribution
- Longevity: number of hours in a given day where the above 3 conditions were satisfied to account for outward propagation
- LLCP (long-lived cooling pulse): days that have on-the-clock cooling cloud tops that satisfy the areal criterion and exist for ≥9 h
- LLWP (long-lived warming pulse): days that have on-the-clock warming cloud tops that satisfy the areal criterion and exist for ≥9 h
- SLCP (short-lived cooling pulse): days that have on-the-clock cooling cloud tops that satisfy the areal criterion and exist for 3–6 h
- SLWP (short-lived warming pulse): days that have on-the-clock warming cloud tops that satisfy the areal criterion and exist for 3–6 h
- NP (no pulse): days that have no identifiable outward-propagating cooling or warming cloud tops, have cooling or warming cloud tops that do not satisfy the areal criterion, or have cooling or warming cloud tops that satisfy the areal criterion but exist for <3 h
- Pulse Lightning Flash Density: upper half of the distribution
- Areal Criterion: upper half of pulse lightning areal coverage distribution
- Longevity: number of hours in a given day where the above 2 conditions were satisfied
- ACT (electrically active pulse): pulses that satisfy both the pulse lightning flash density and areal criterion and exist for ≥9 h
- QUASI (quasi-electrically active pulse): pulses that satisfy both the pulse lightning flash density and areal criterion and exist for 3–6 h
- INACT (electrically inactive pulse): pulses that do not satisfy both the pulse lightning flash density and areal criterion or exist for <3 h
CHOOSE A YEAR
CHOOSE A STORM
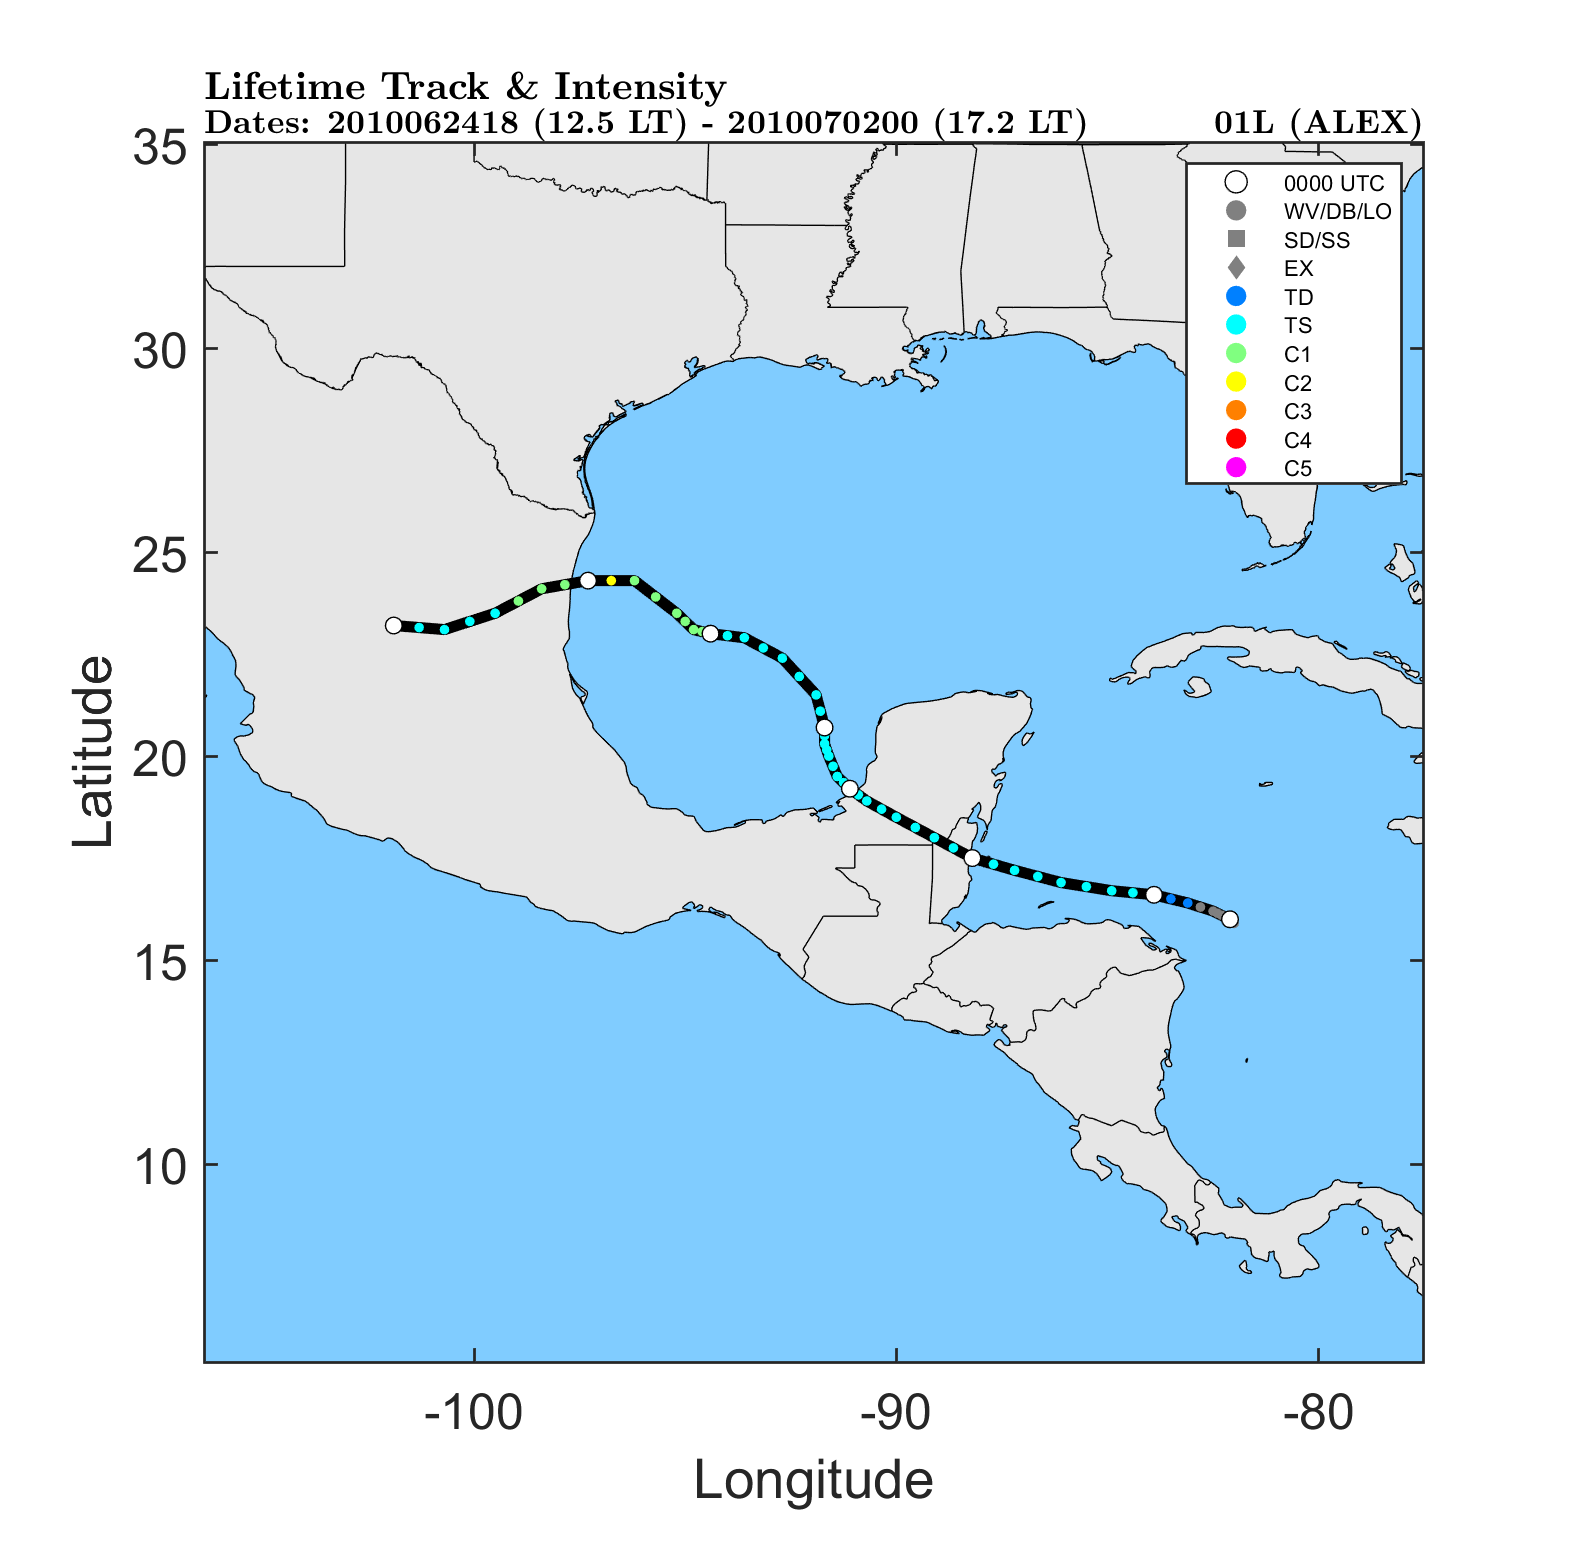
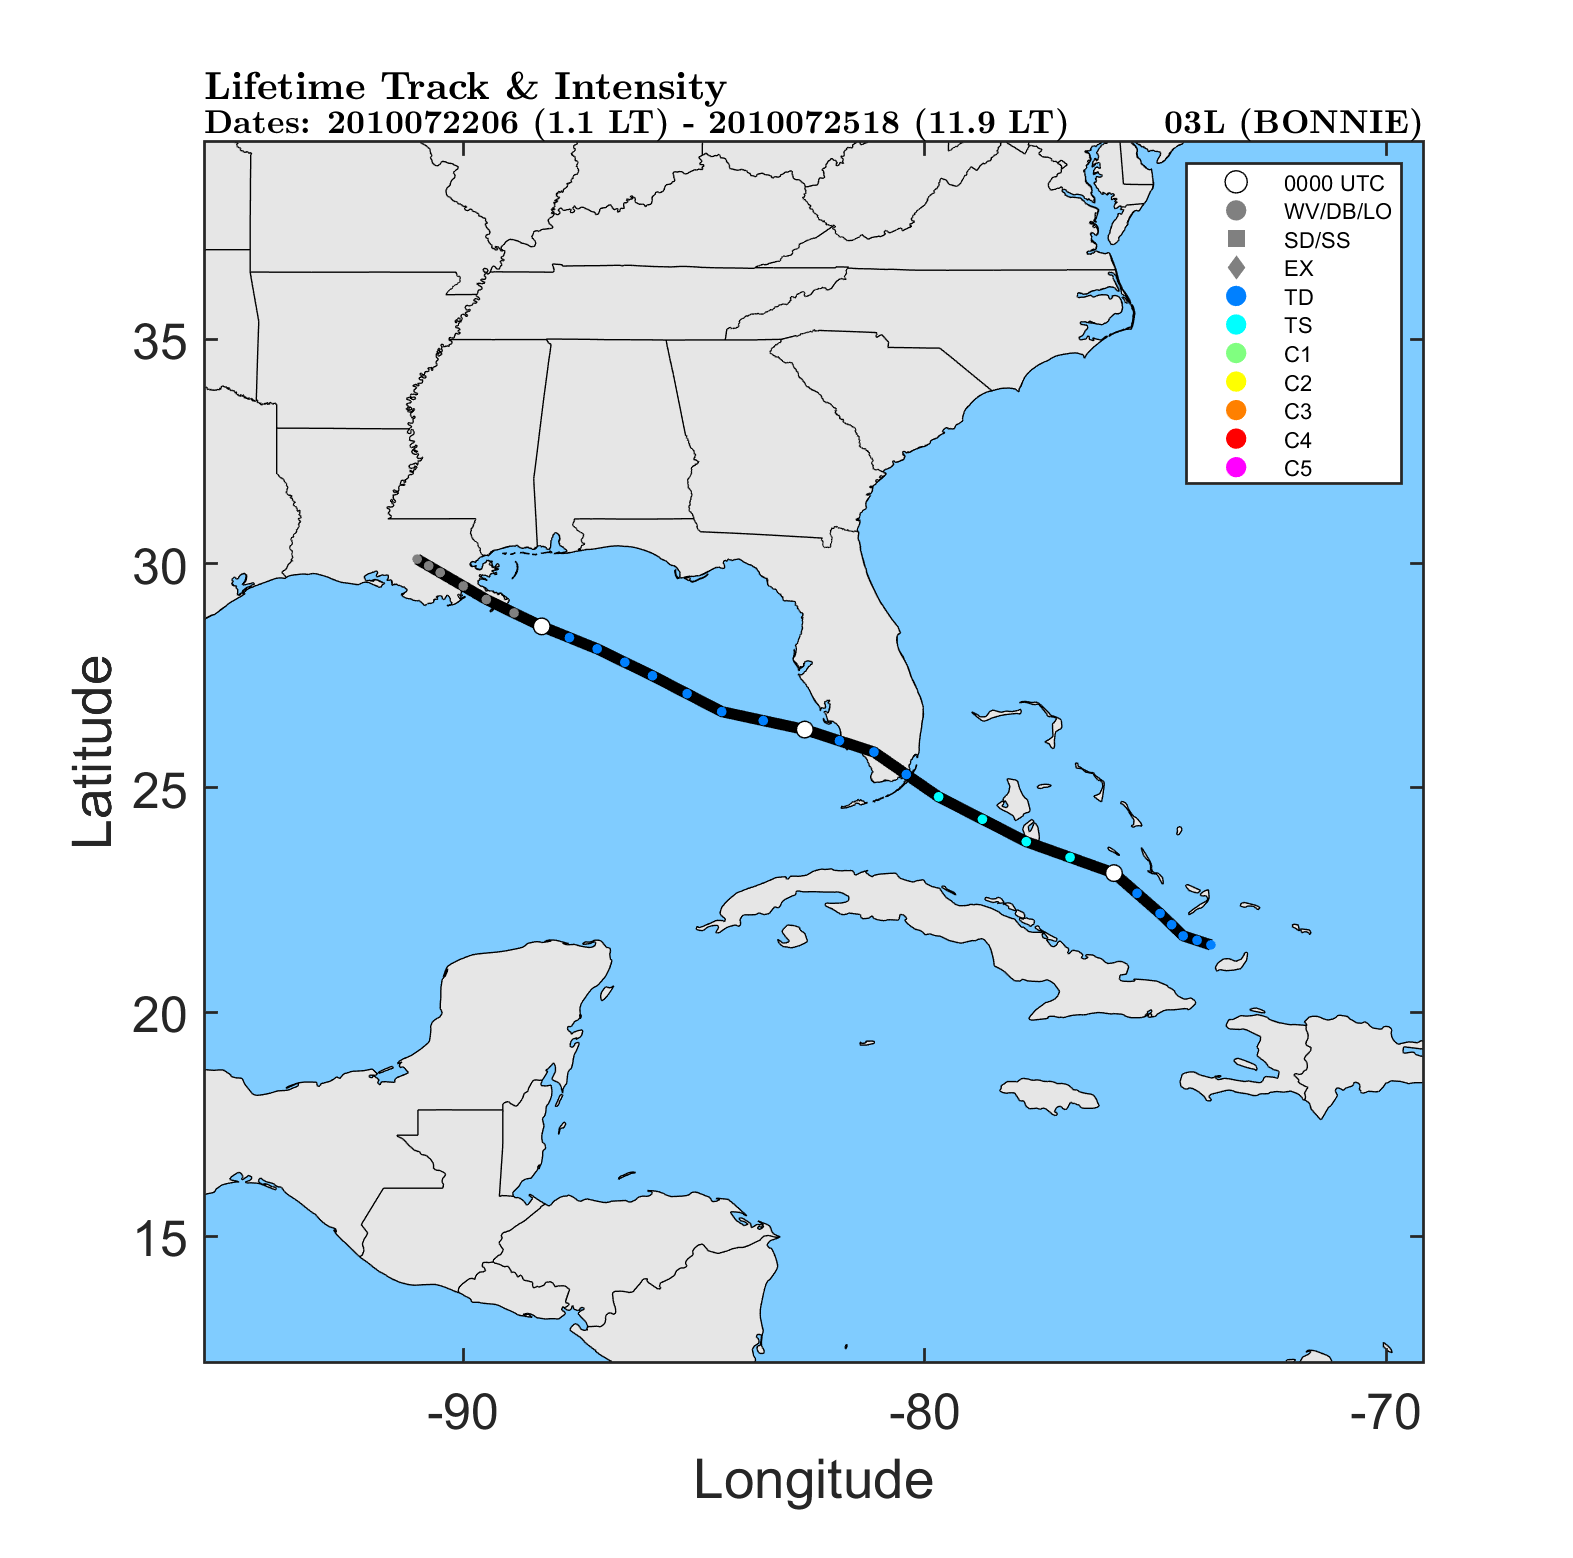
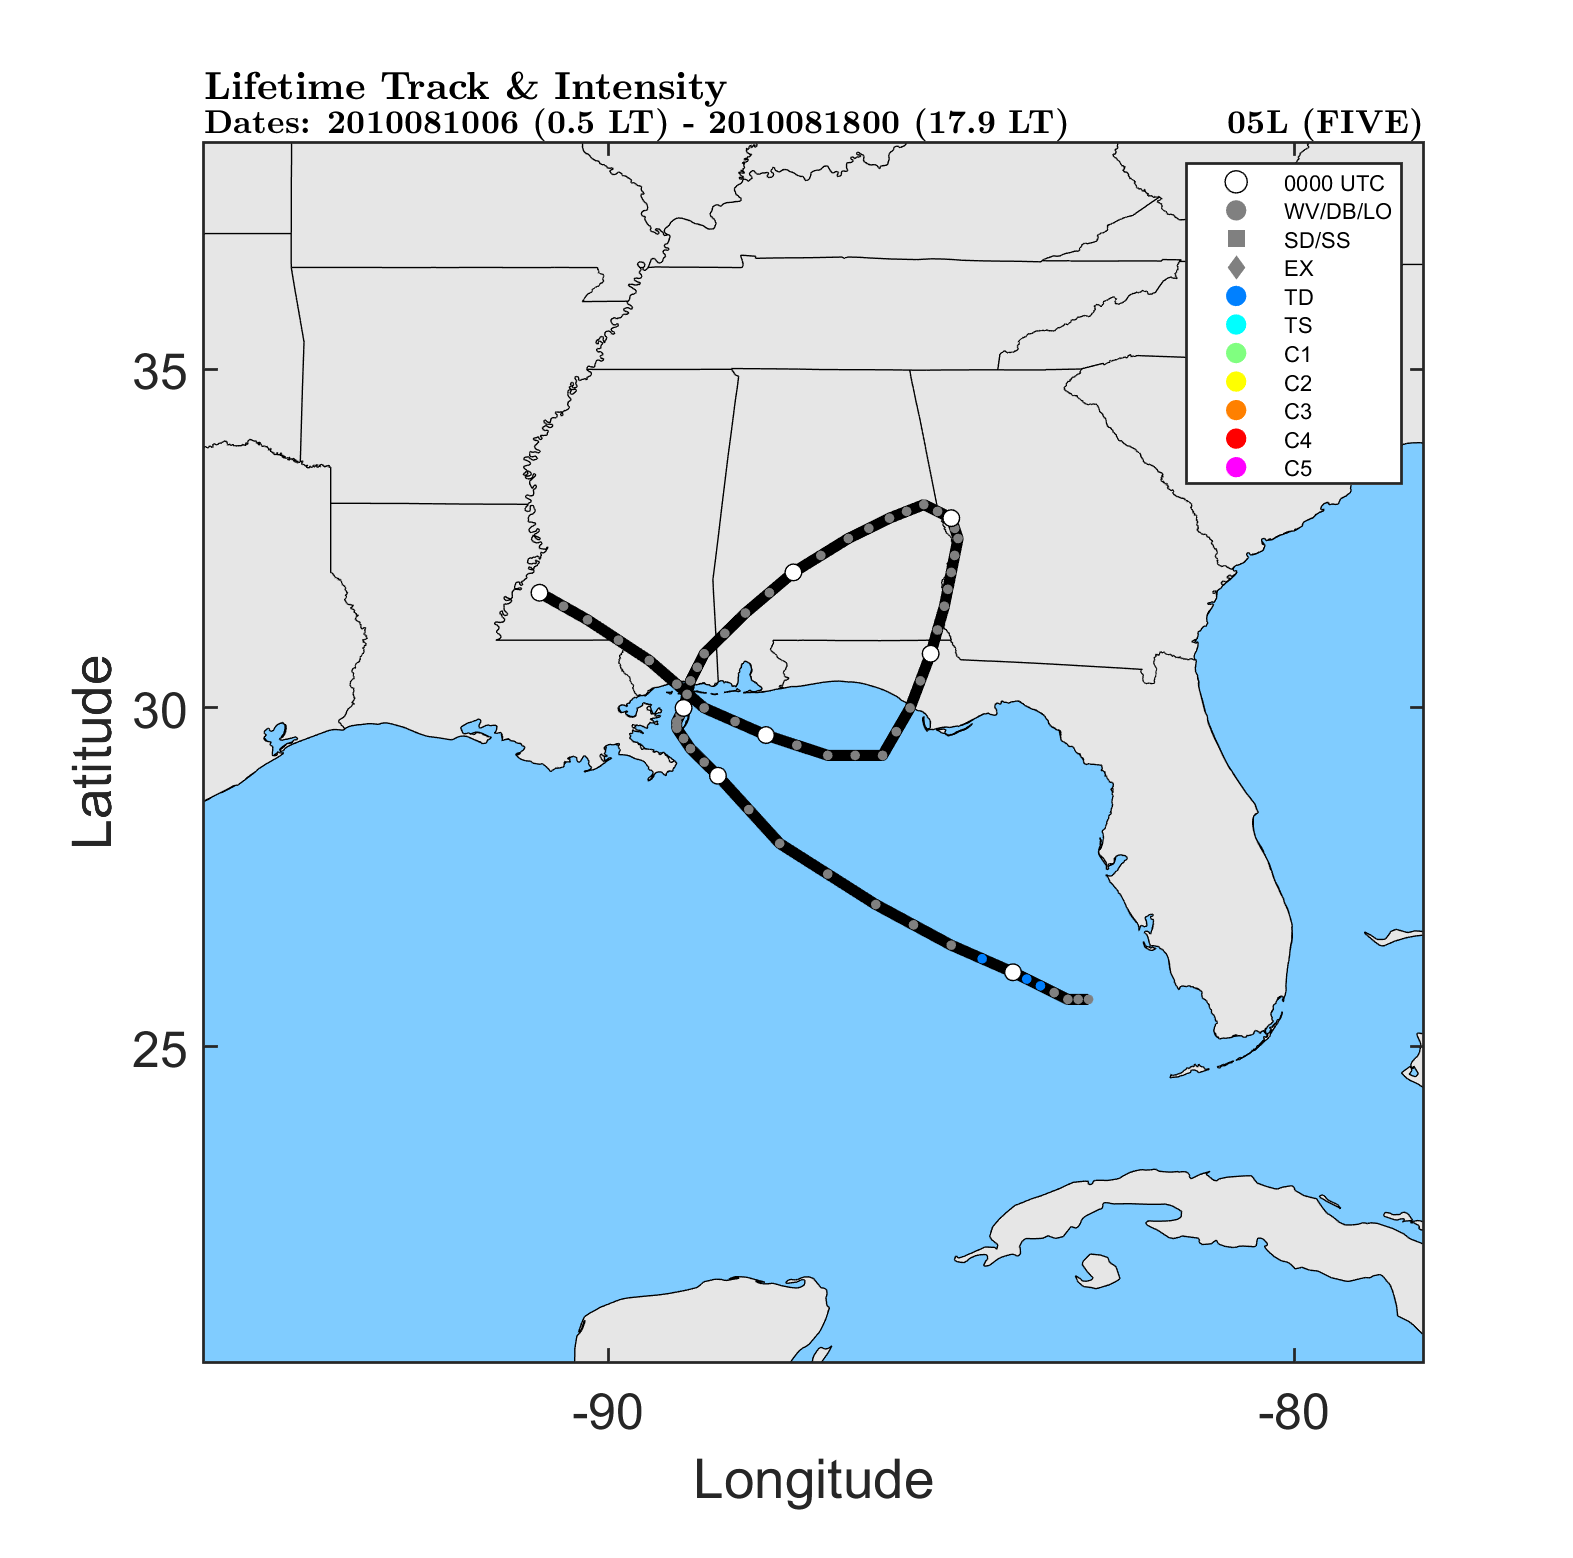
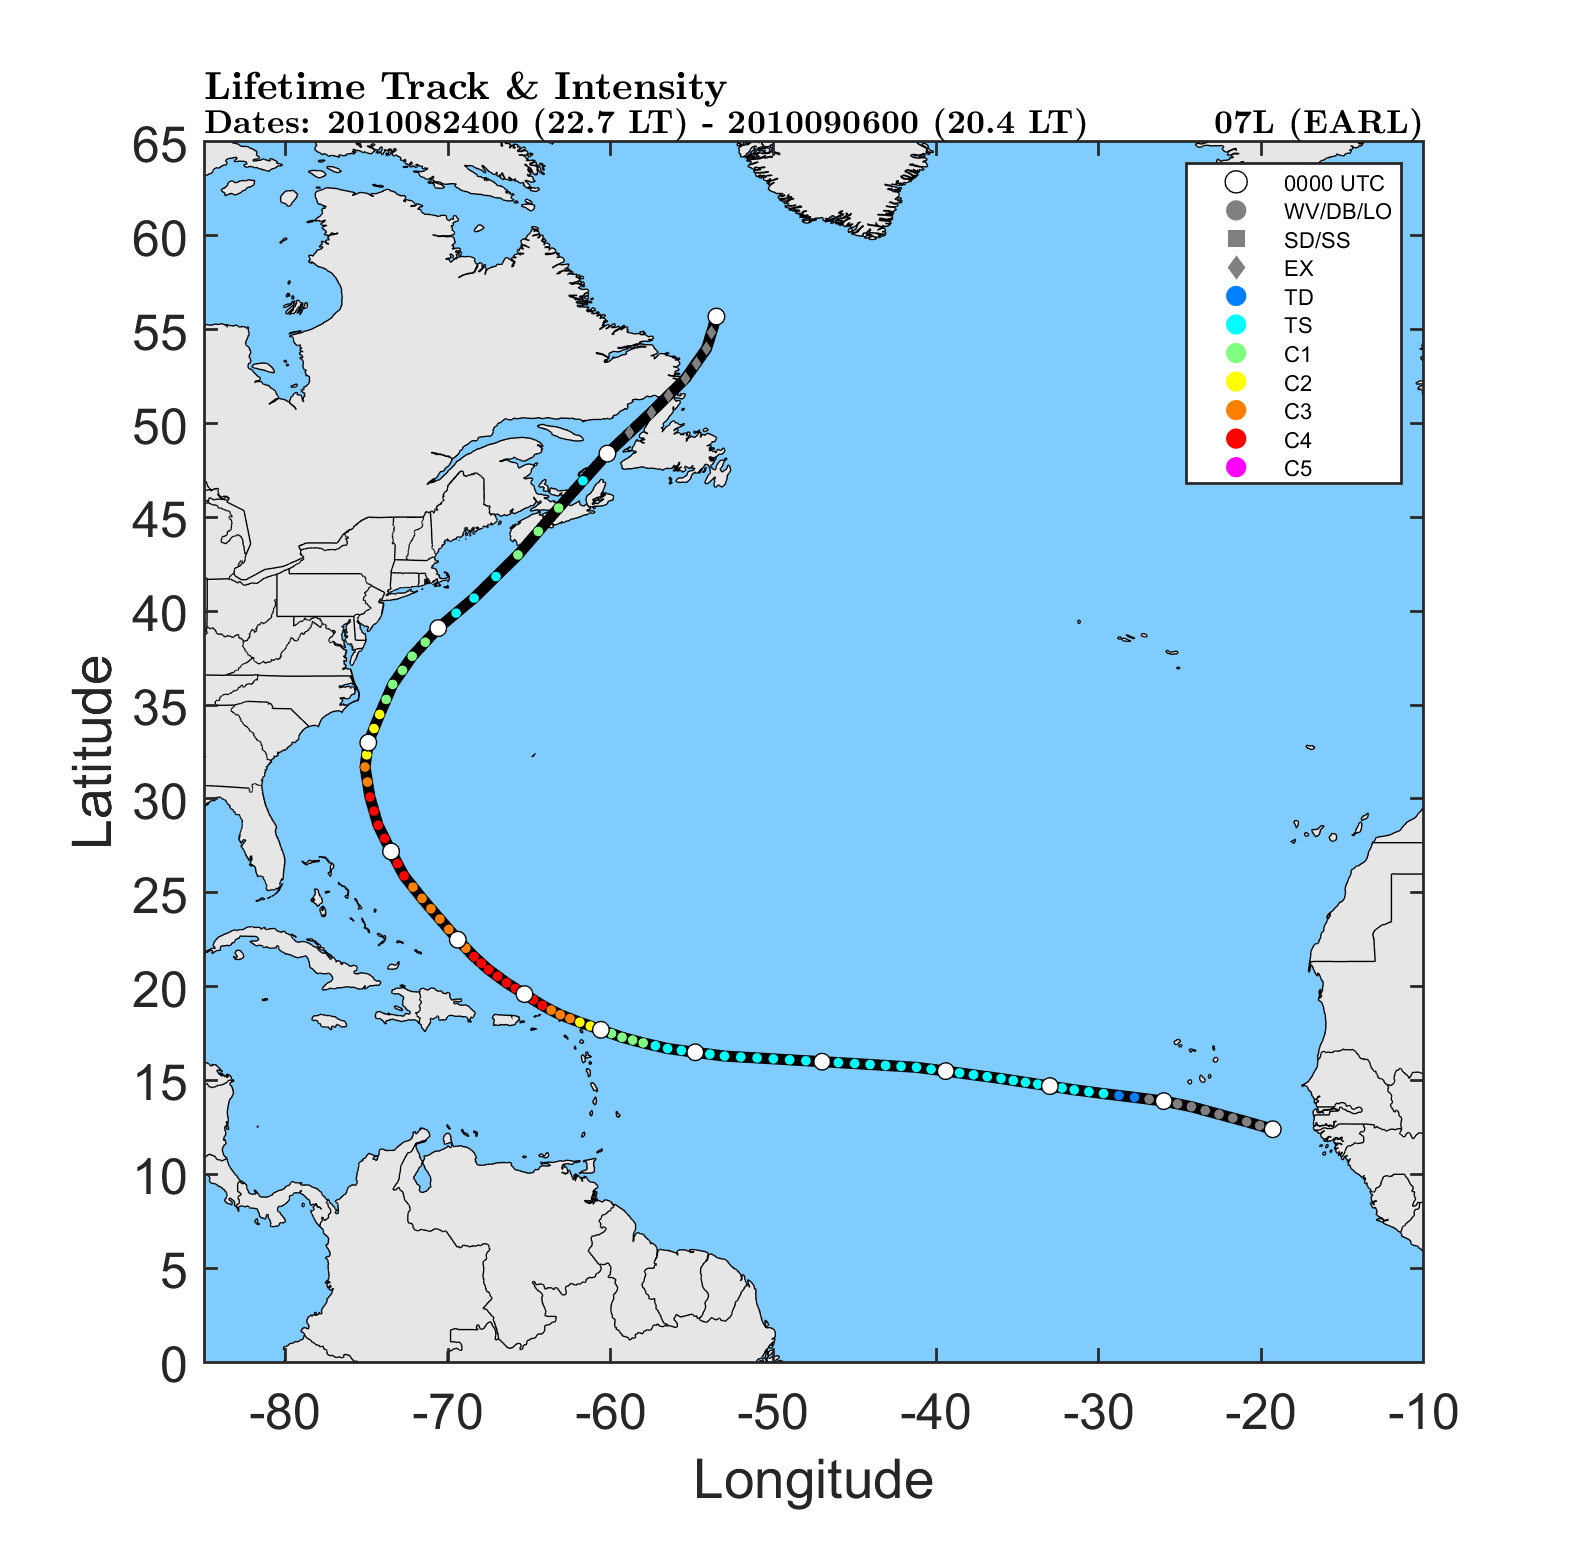
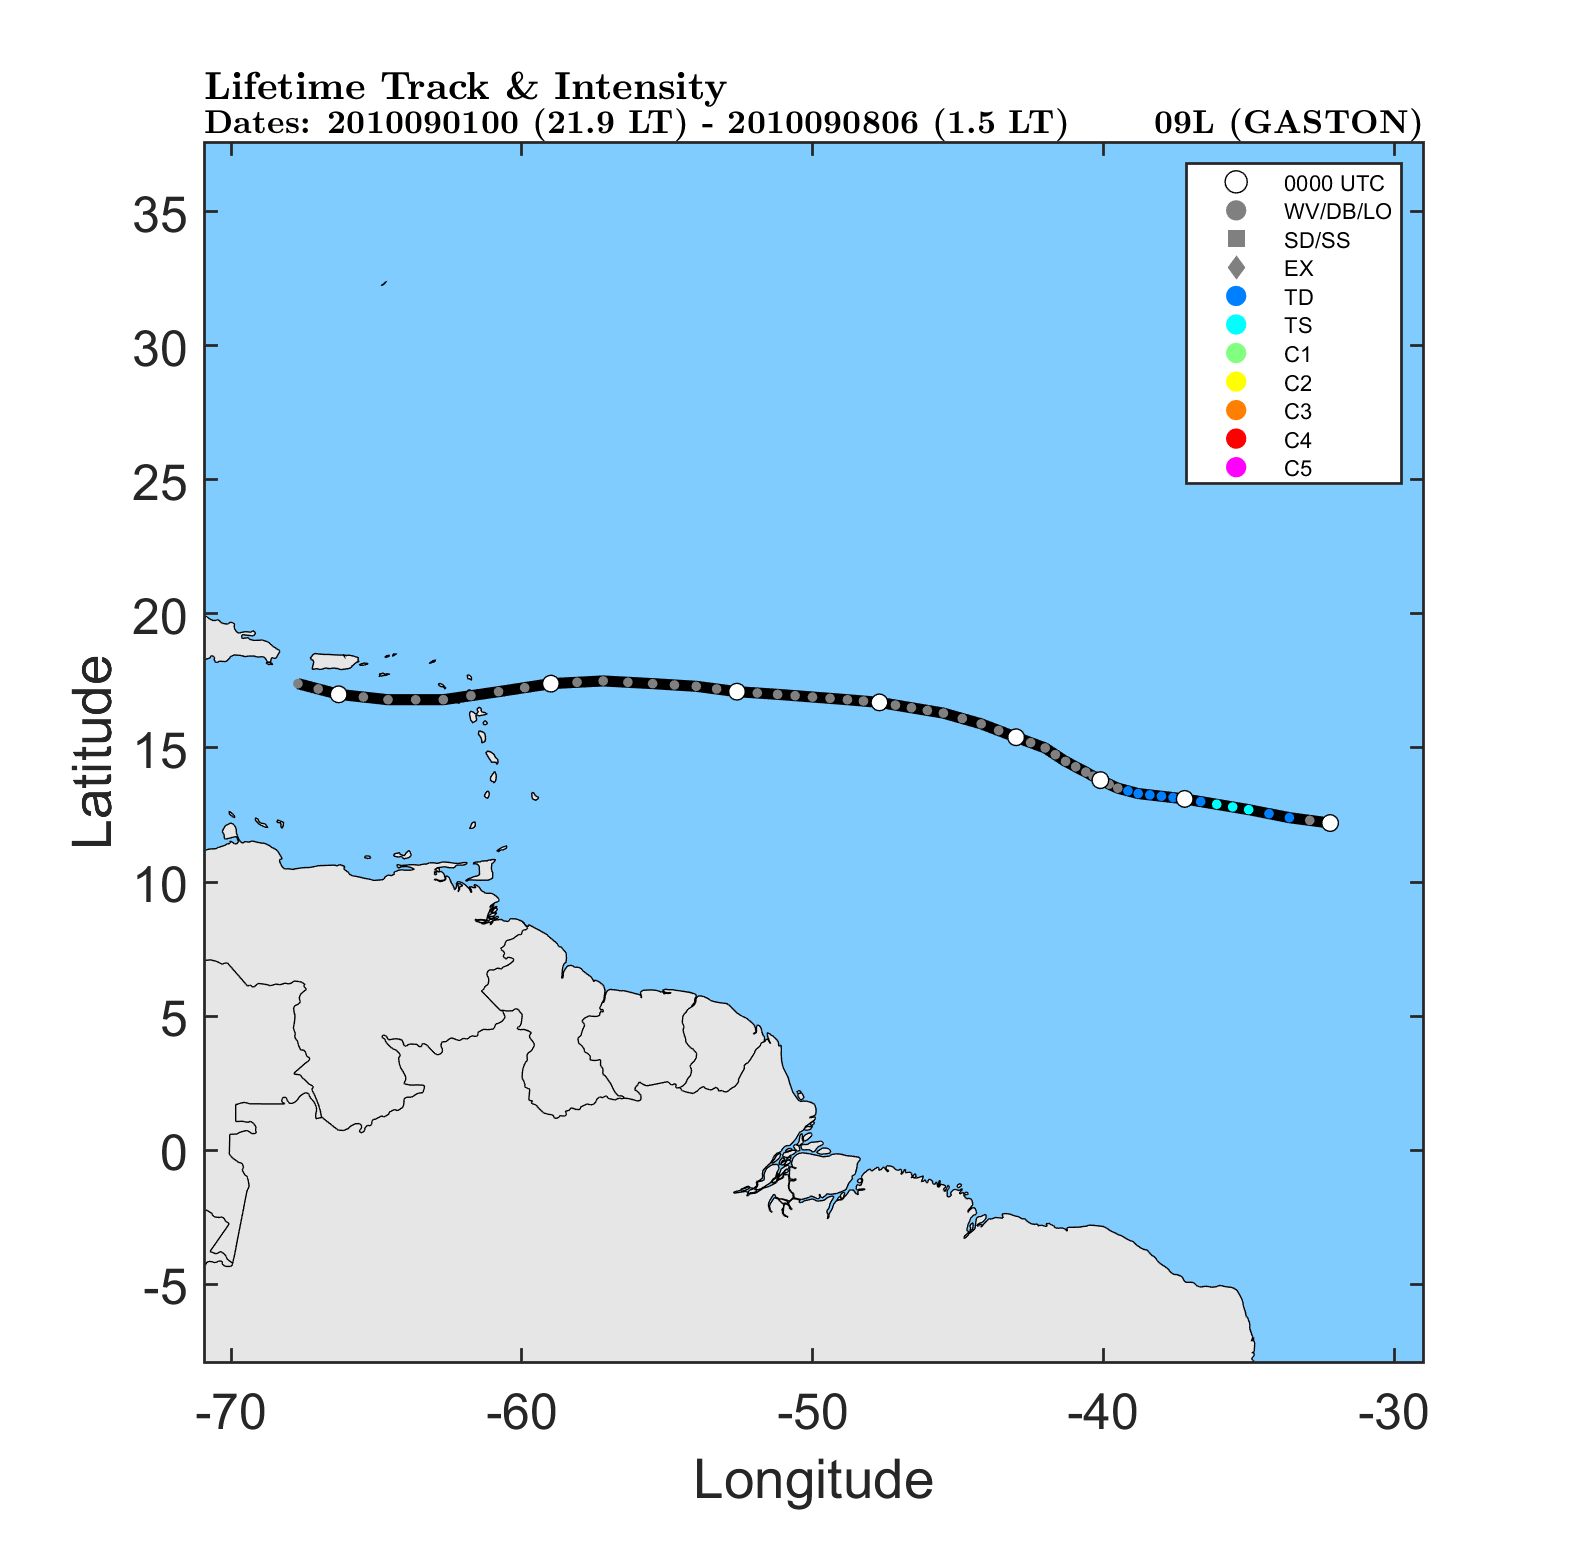
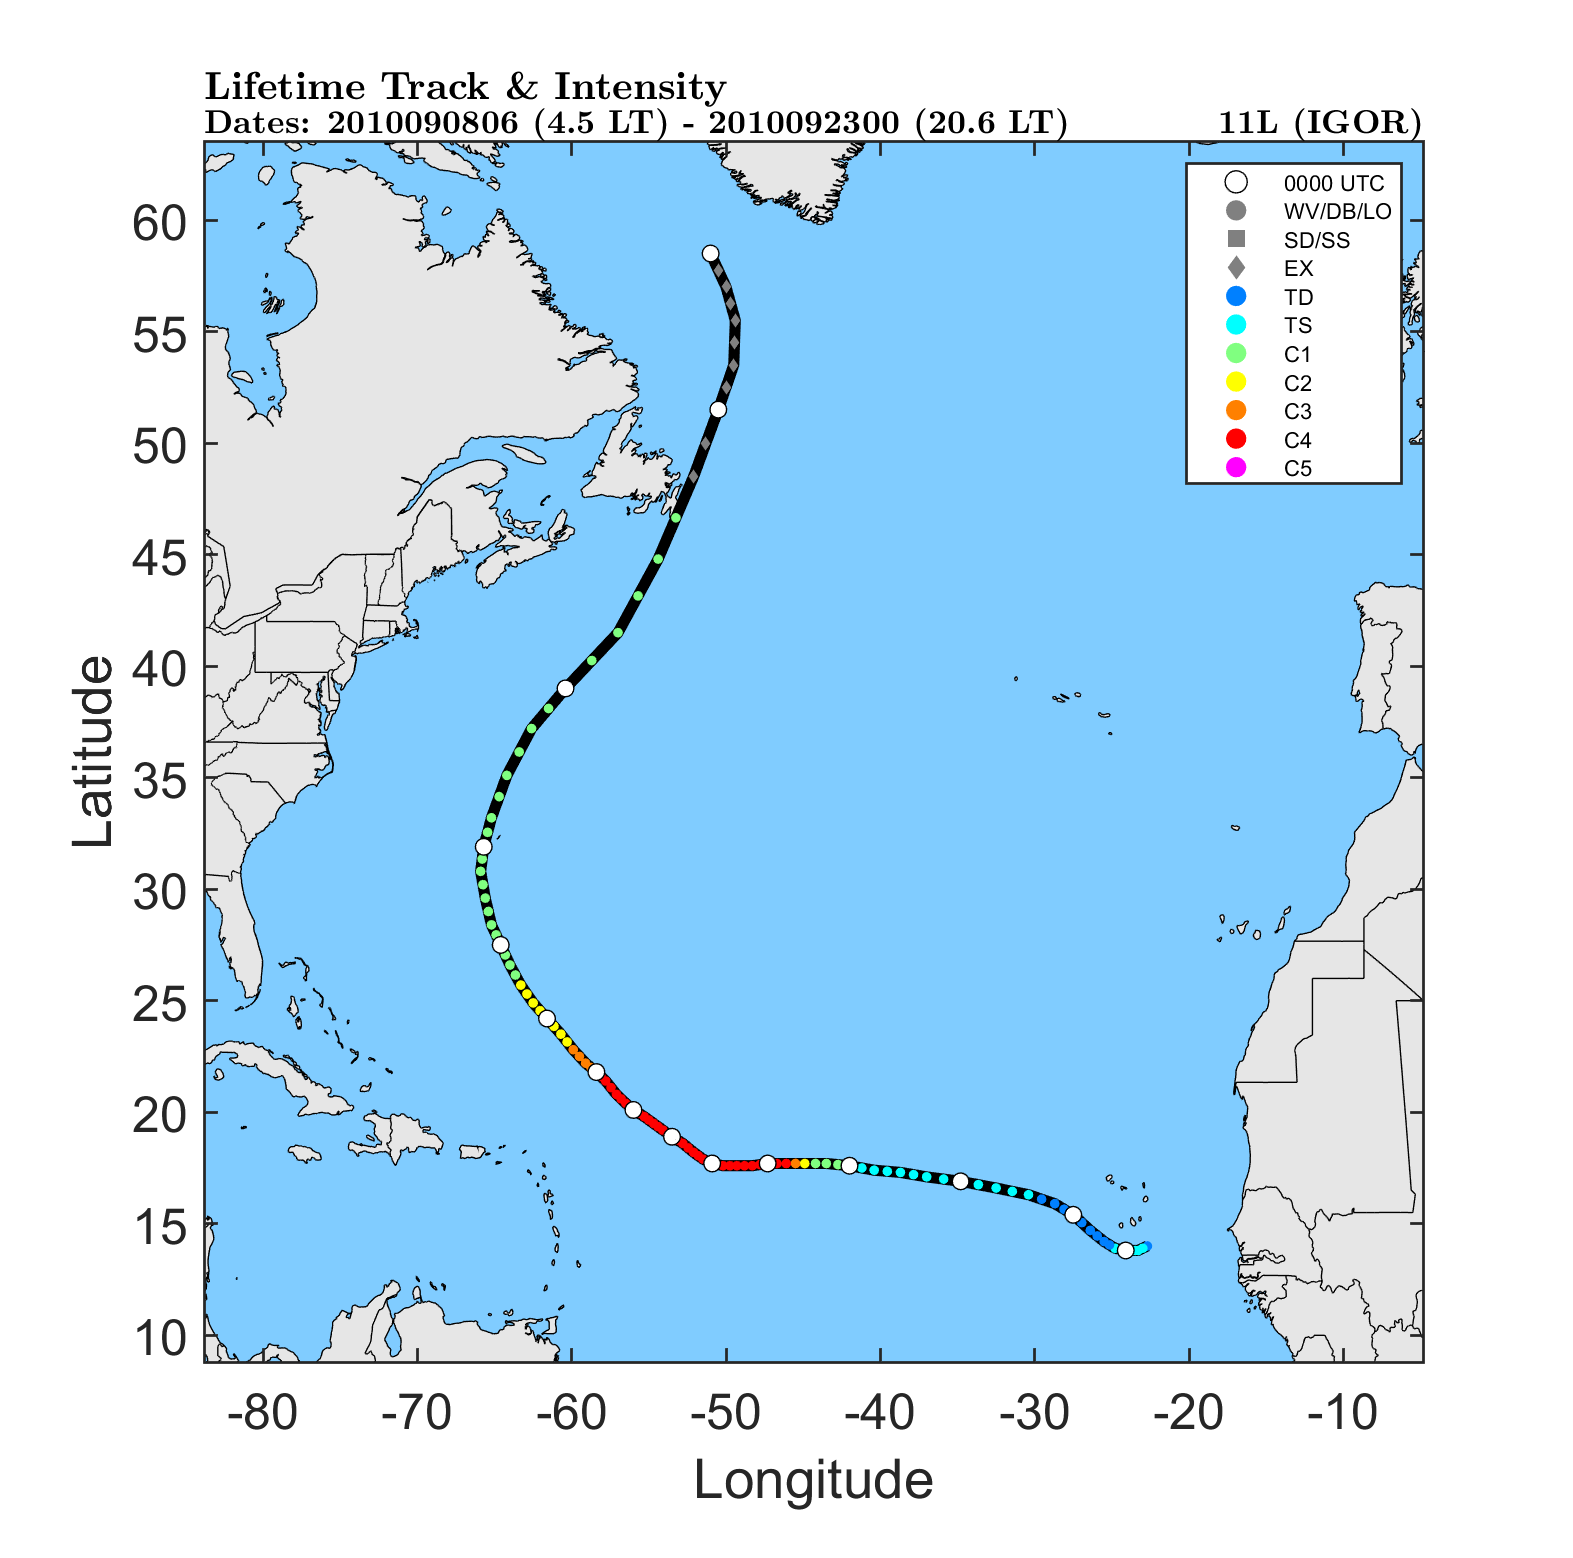
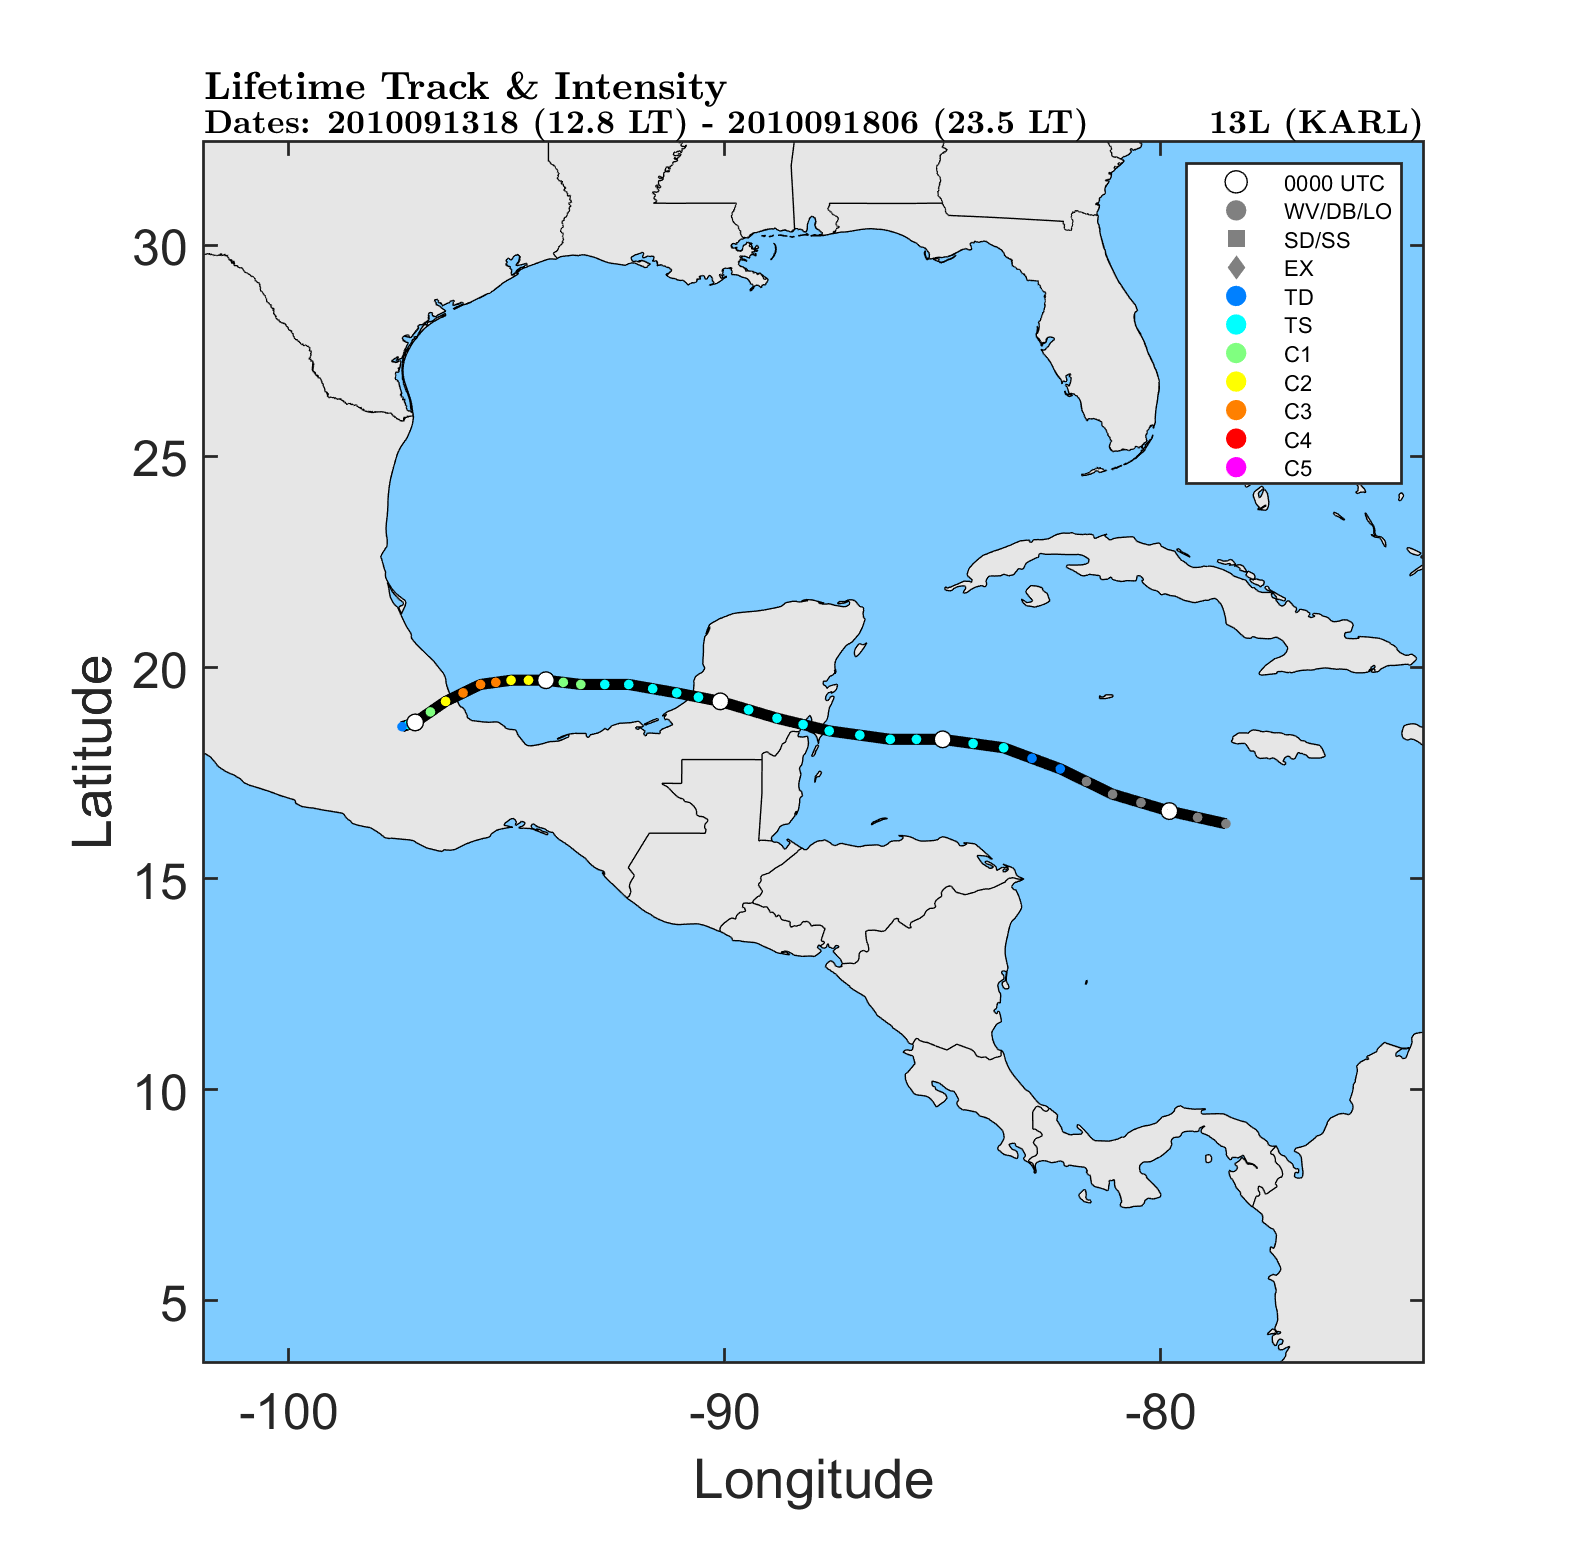
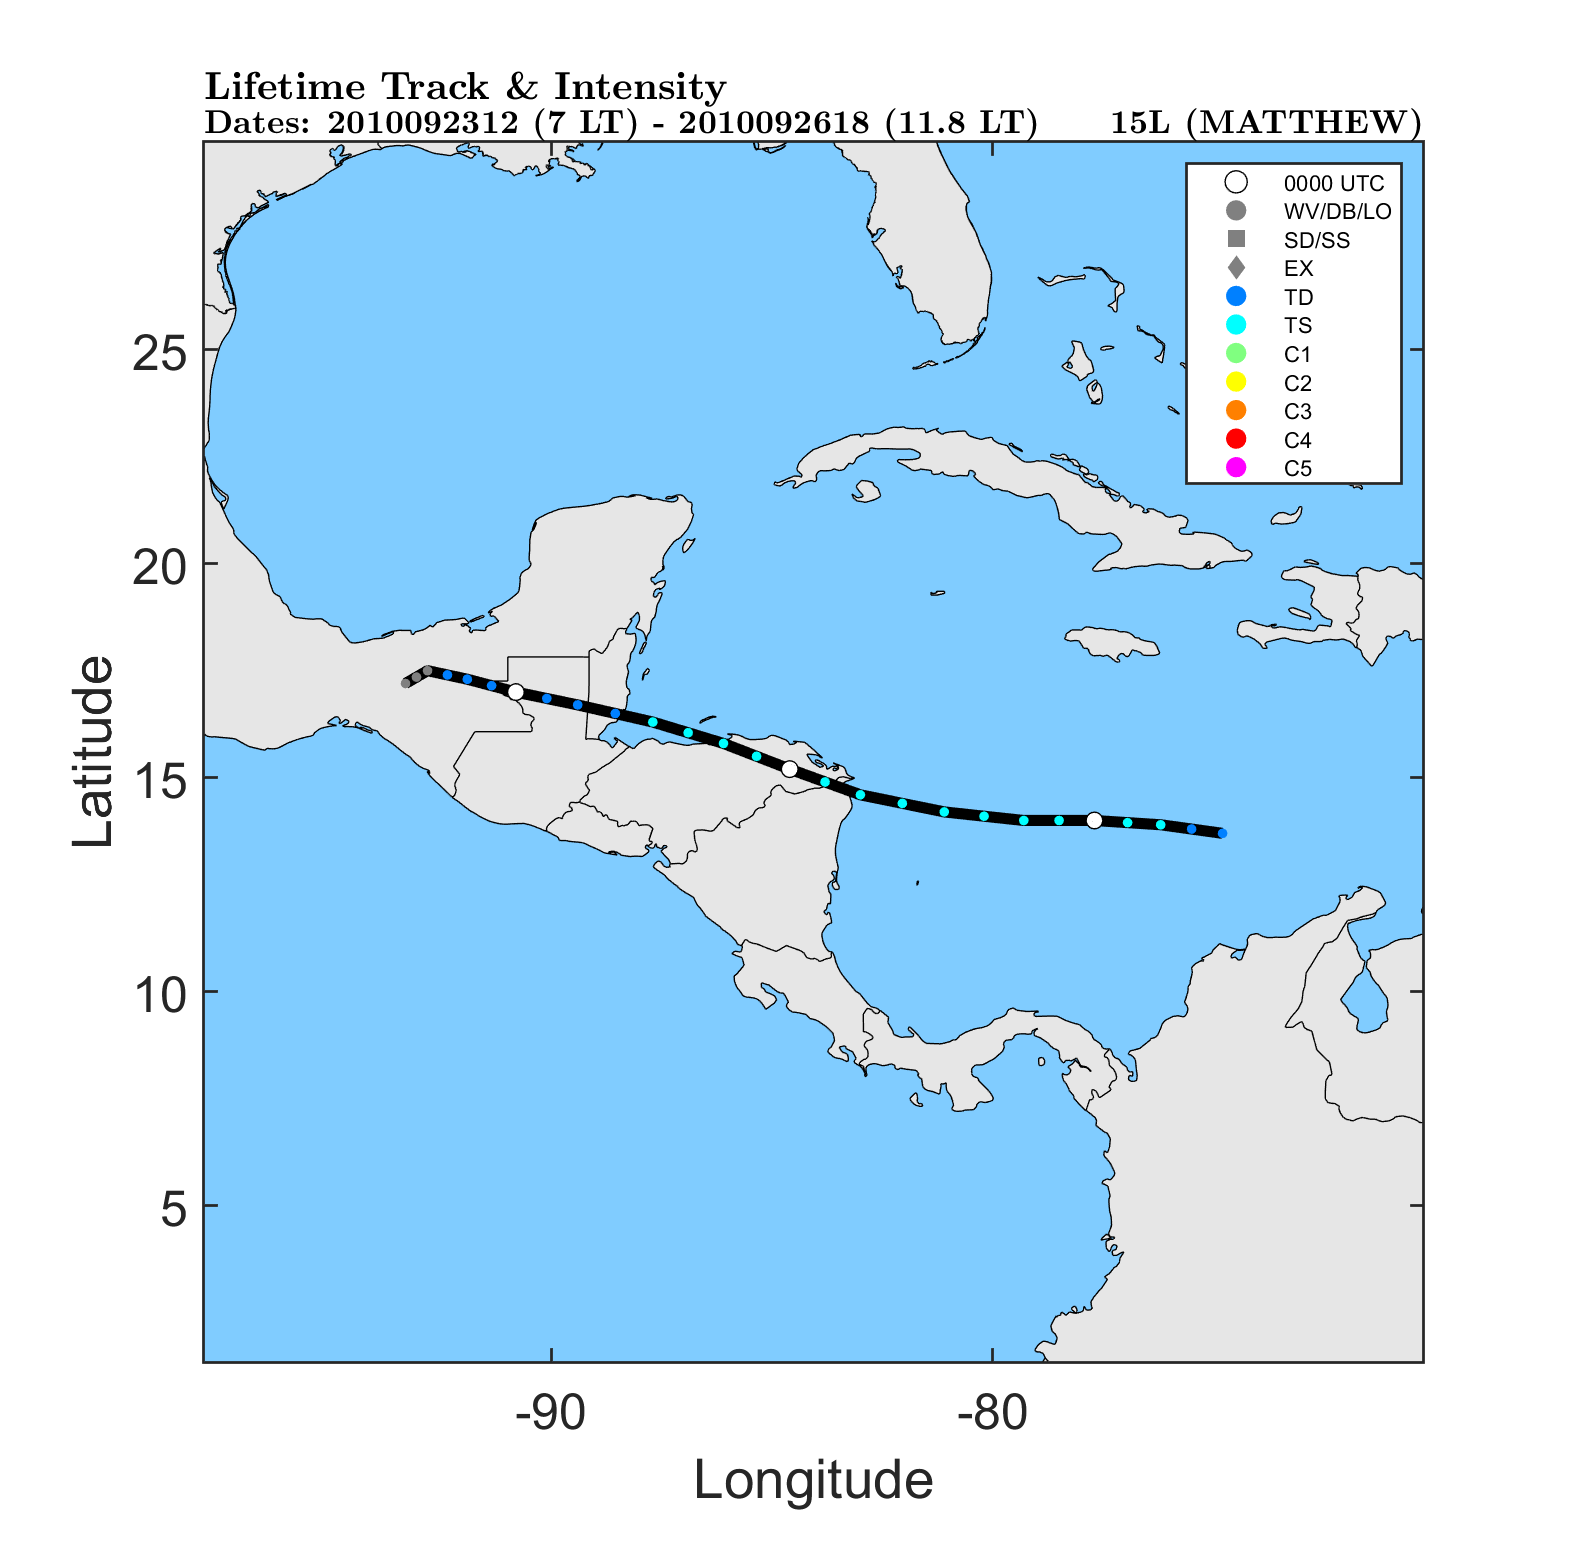
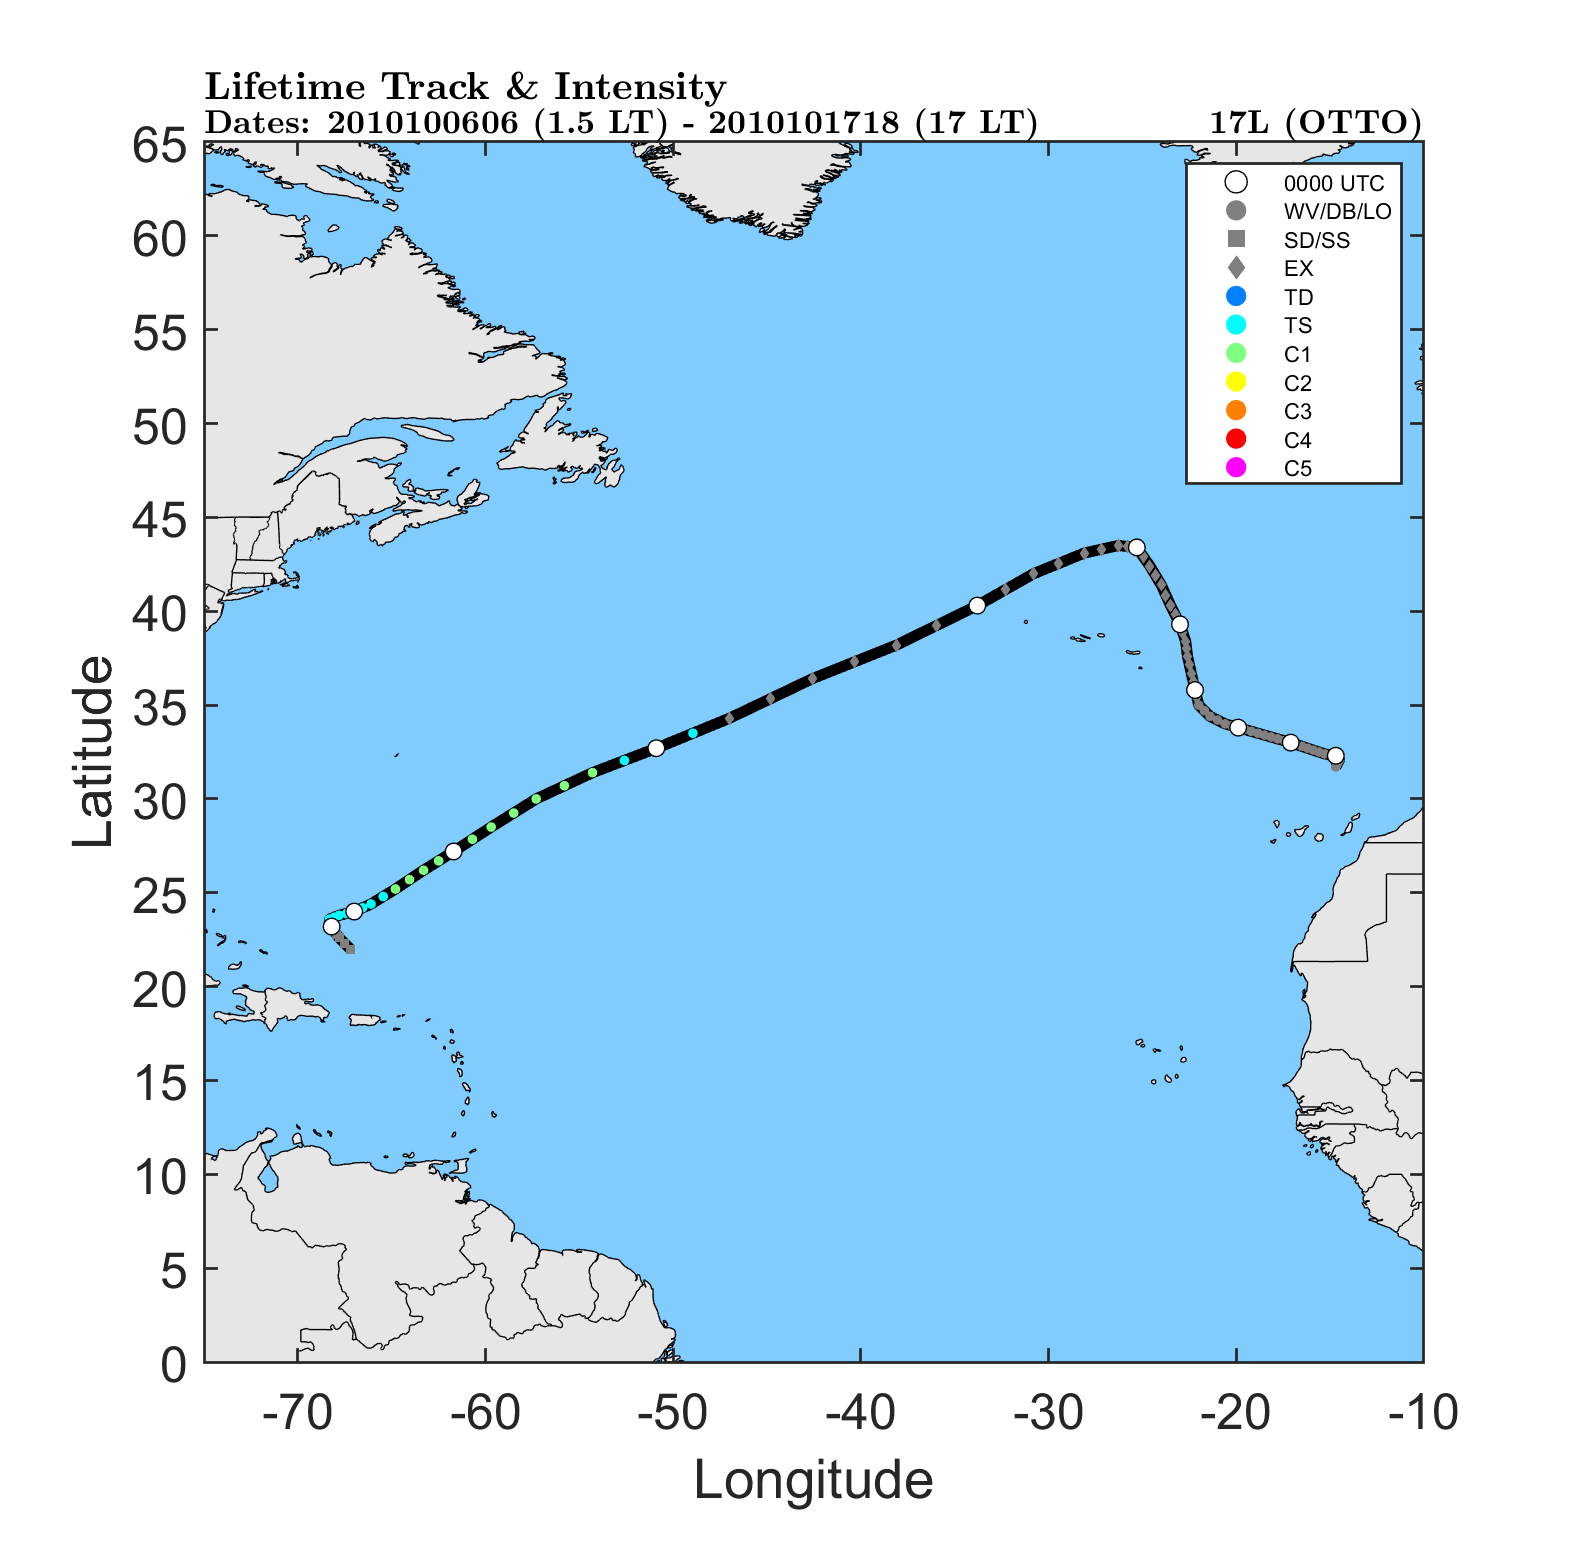
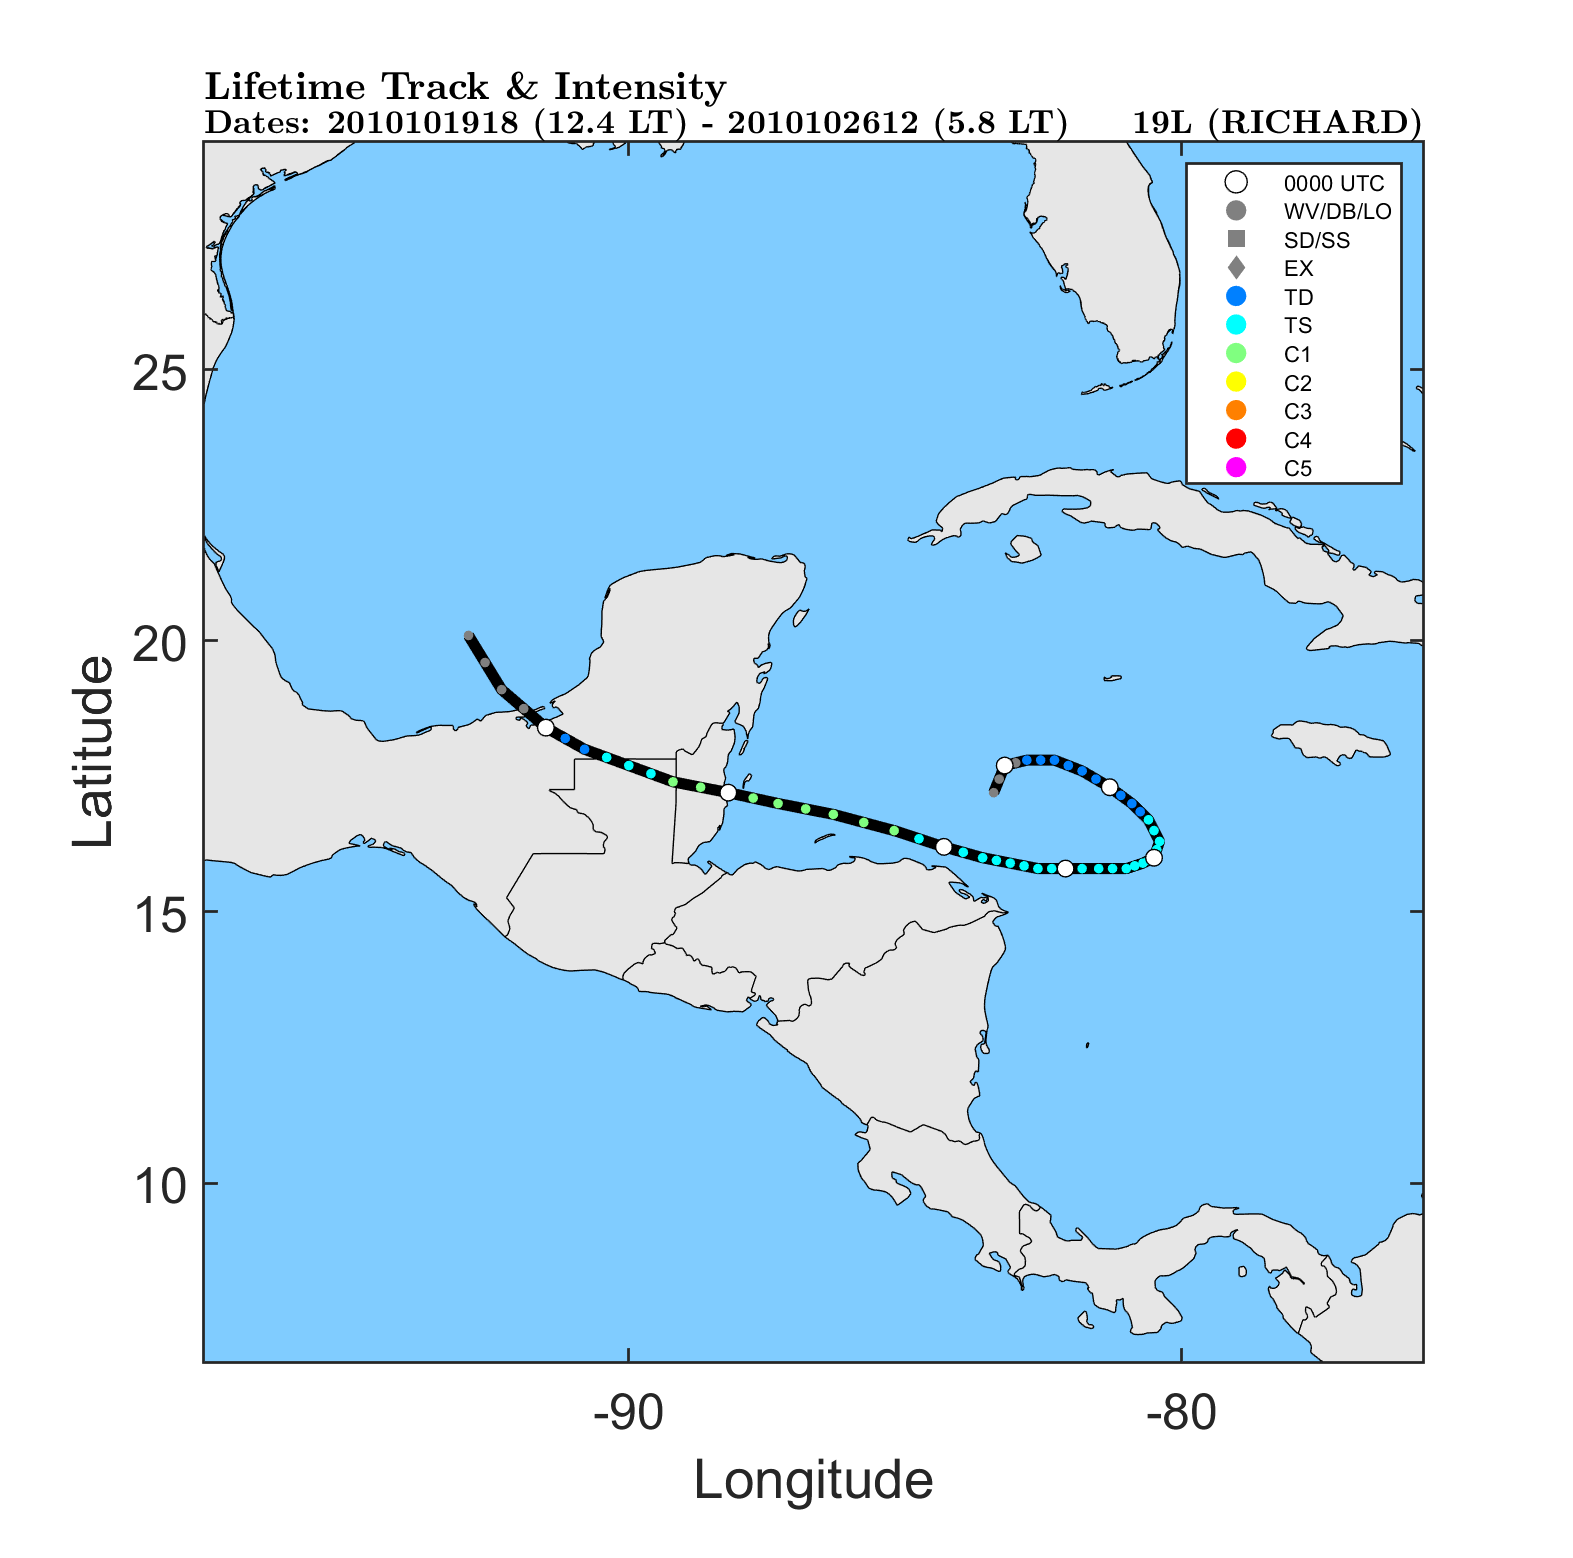
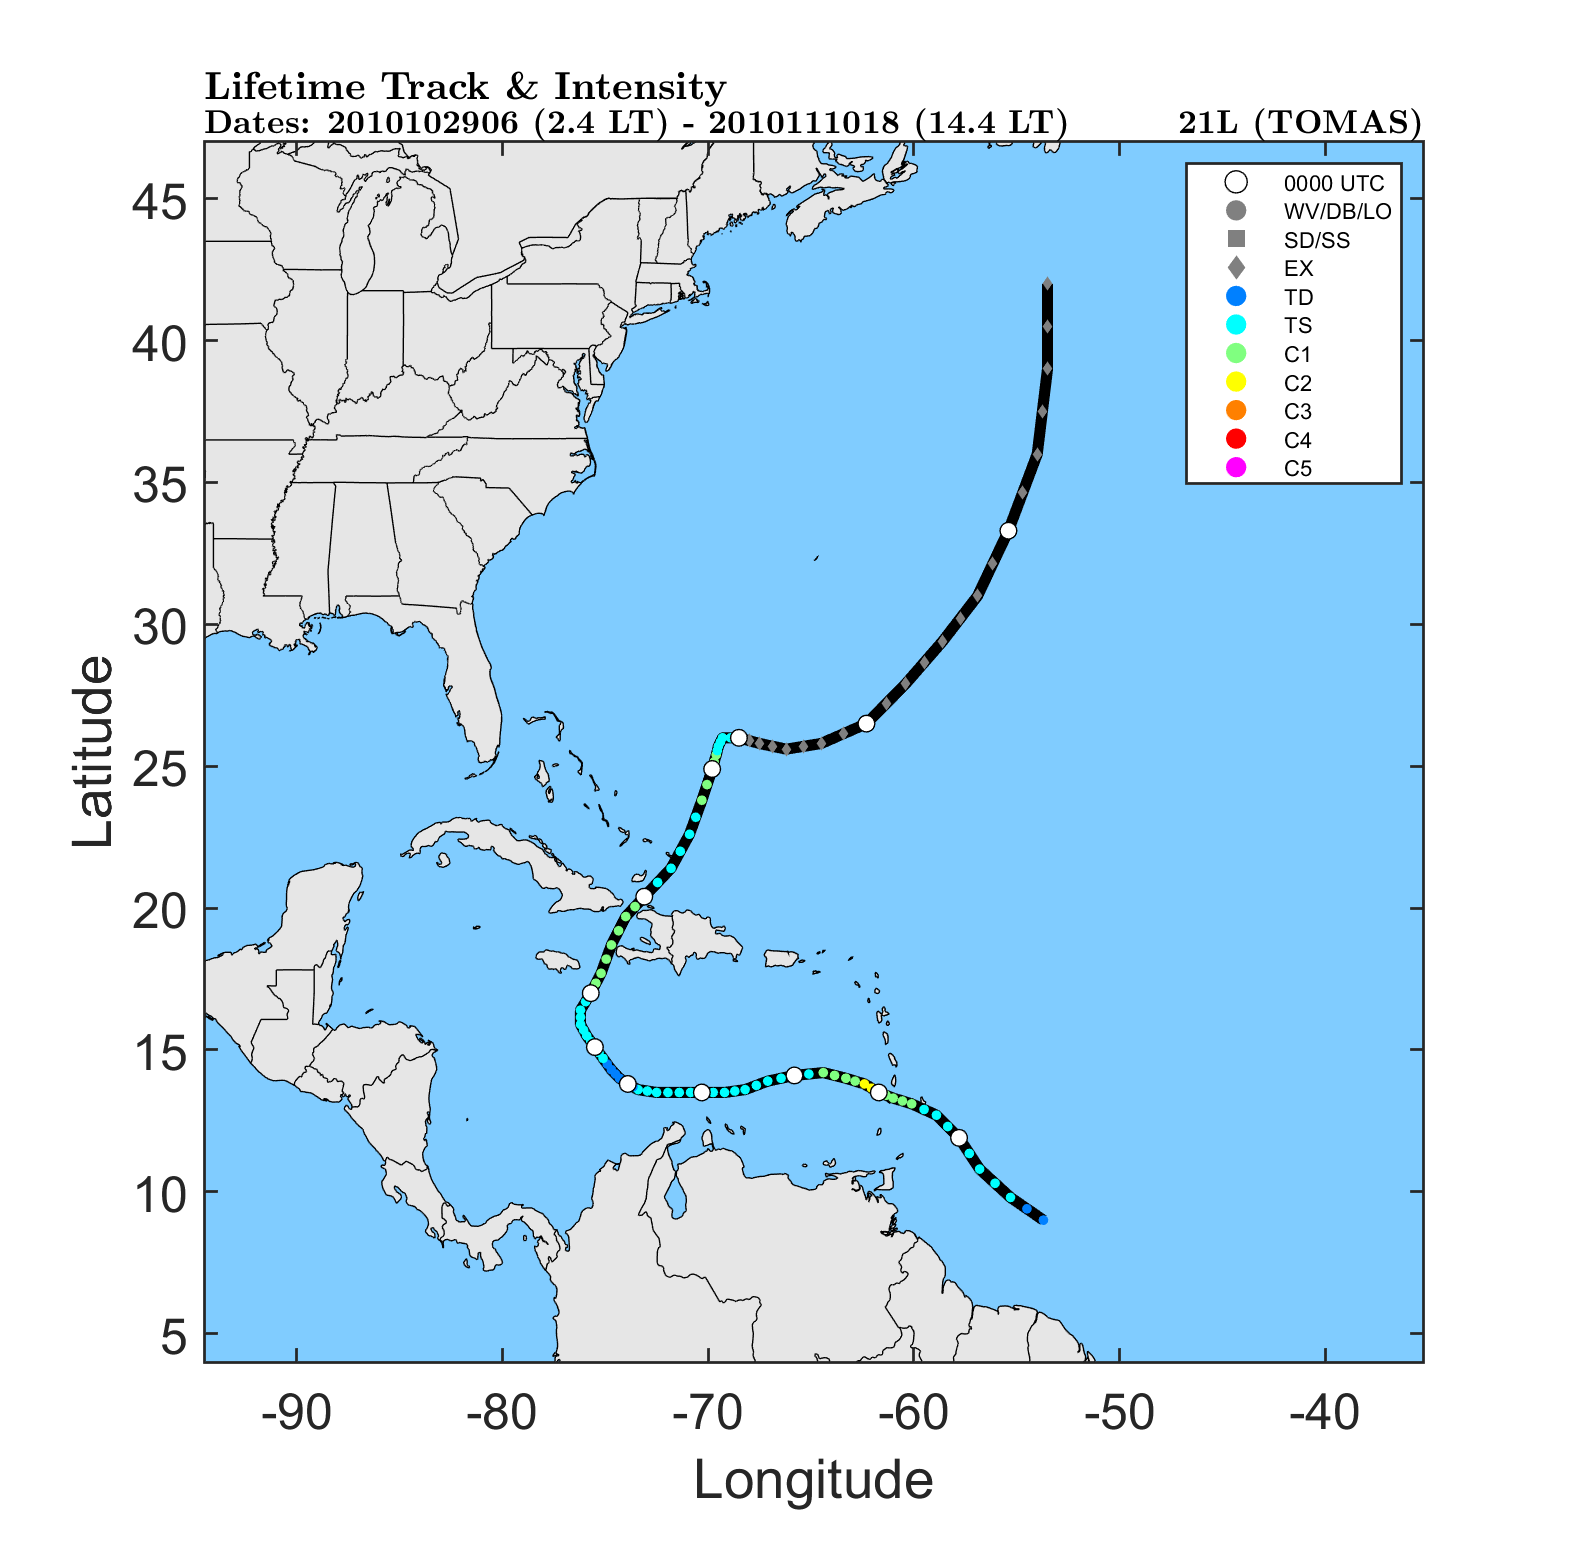
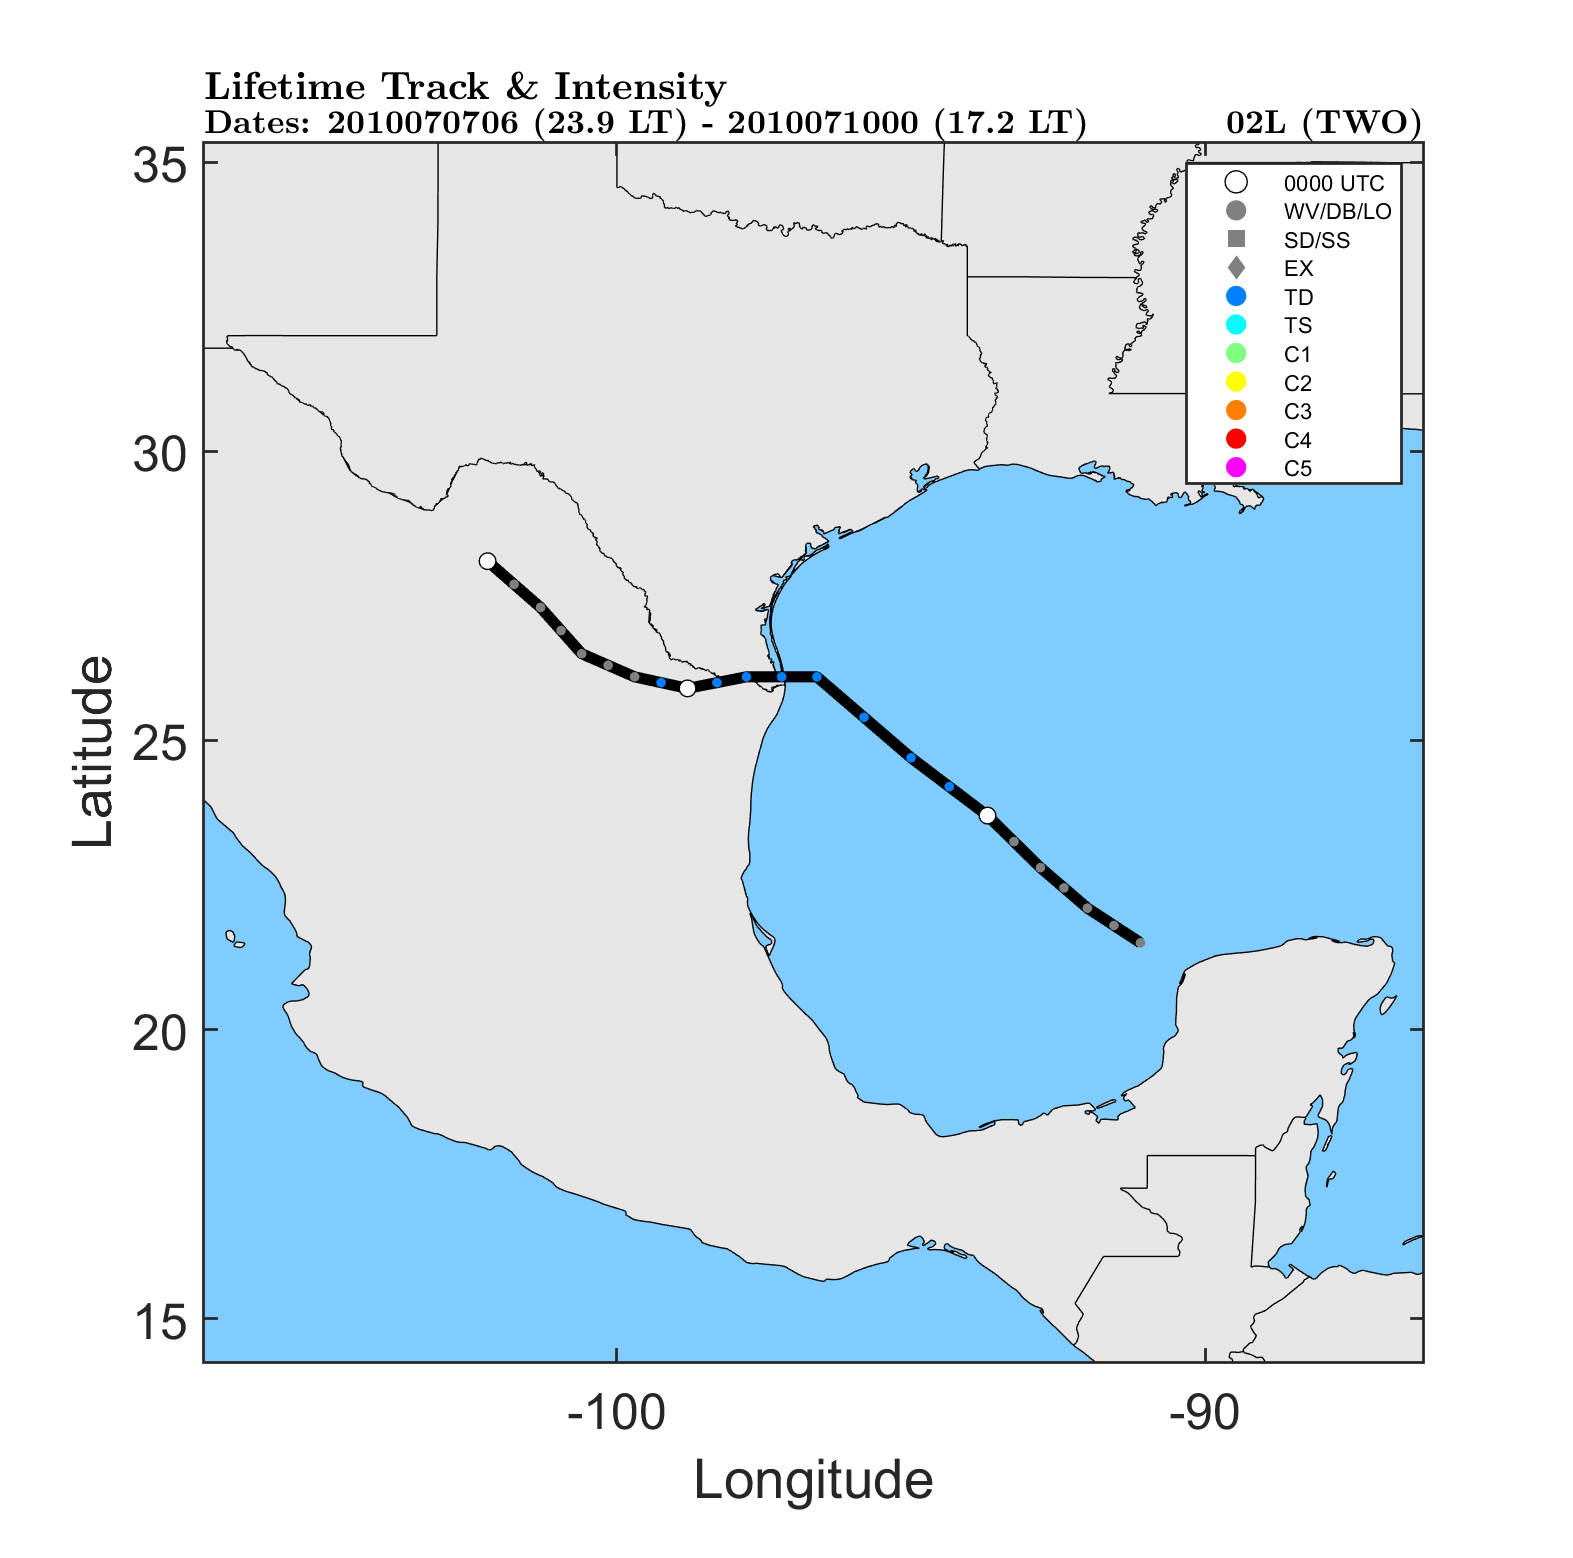
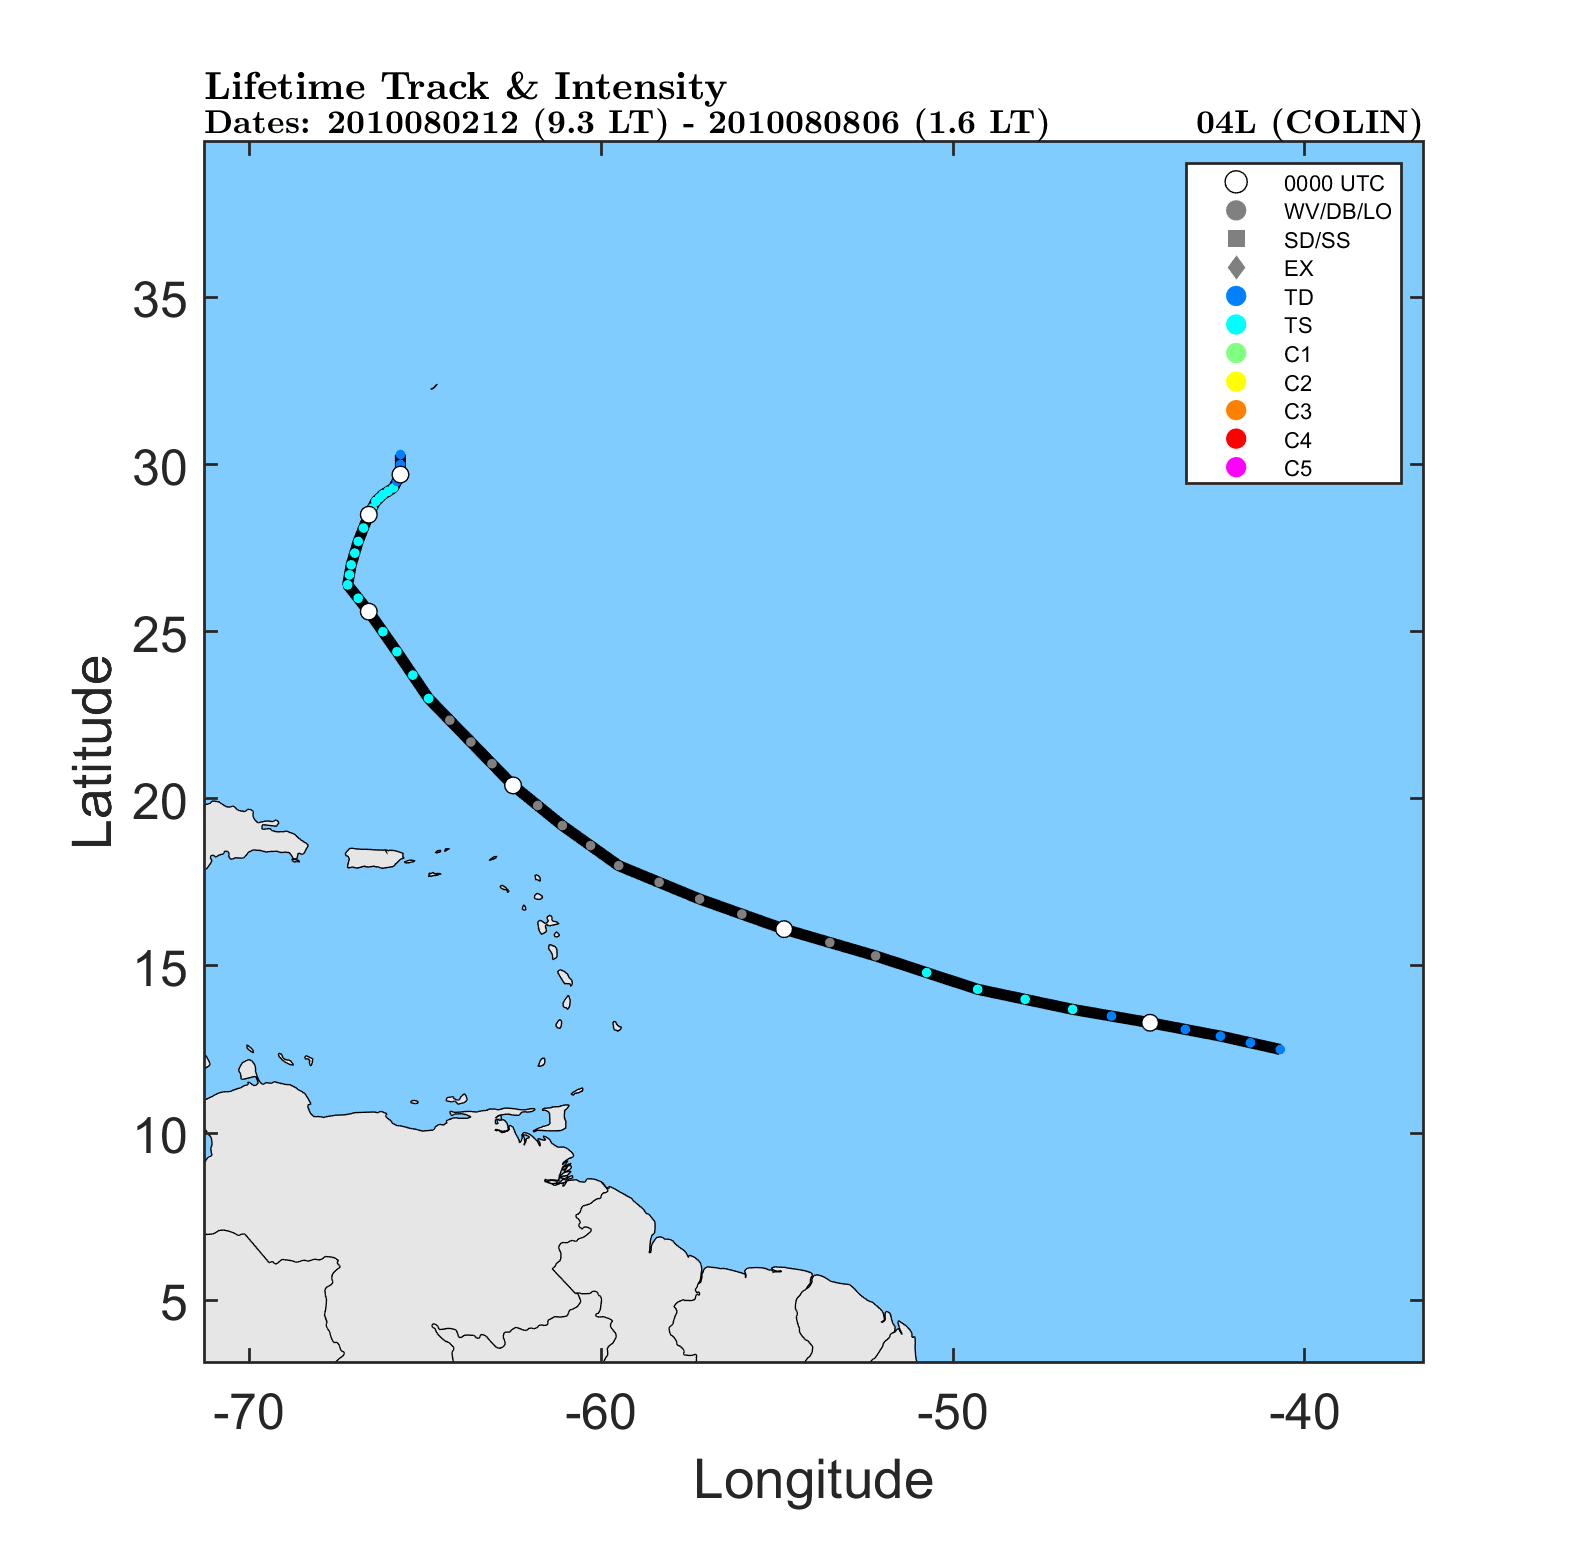
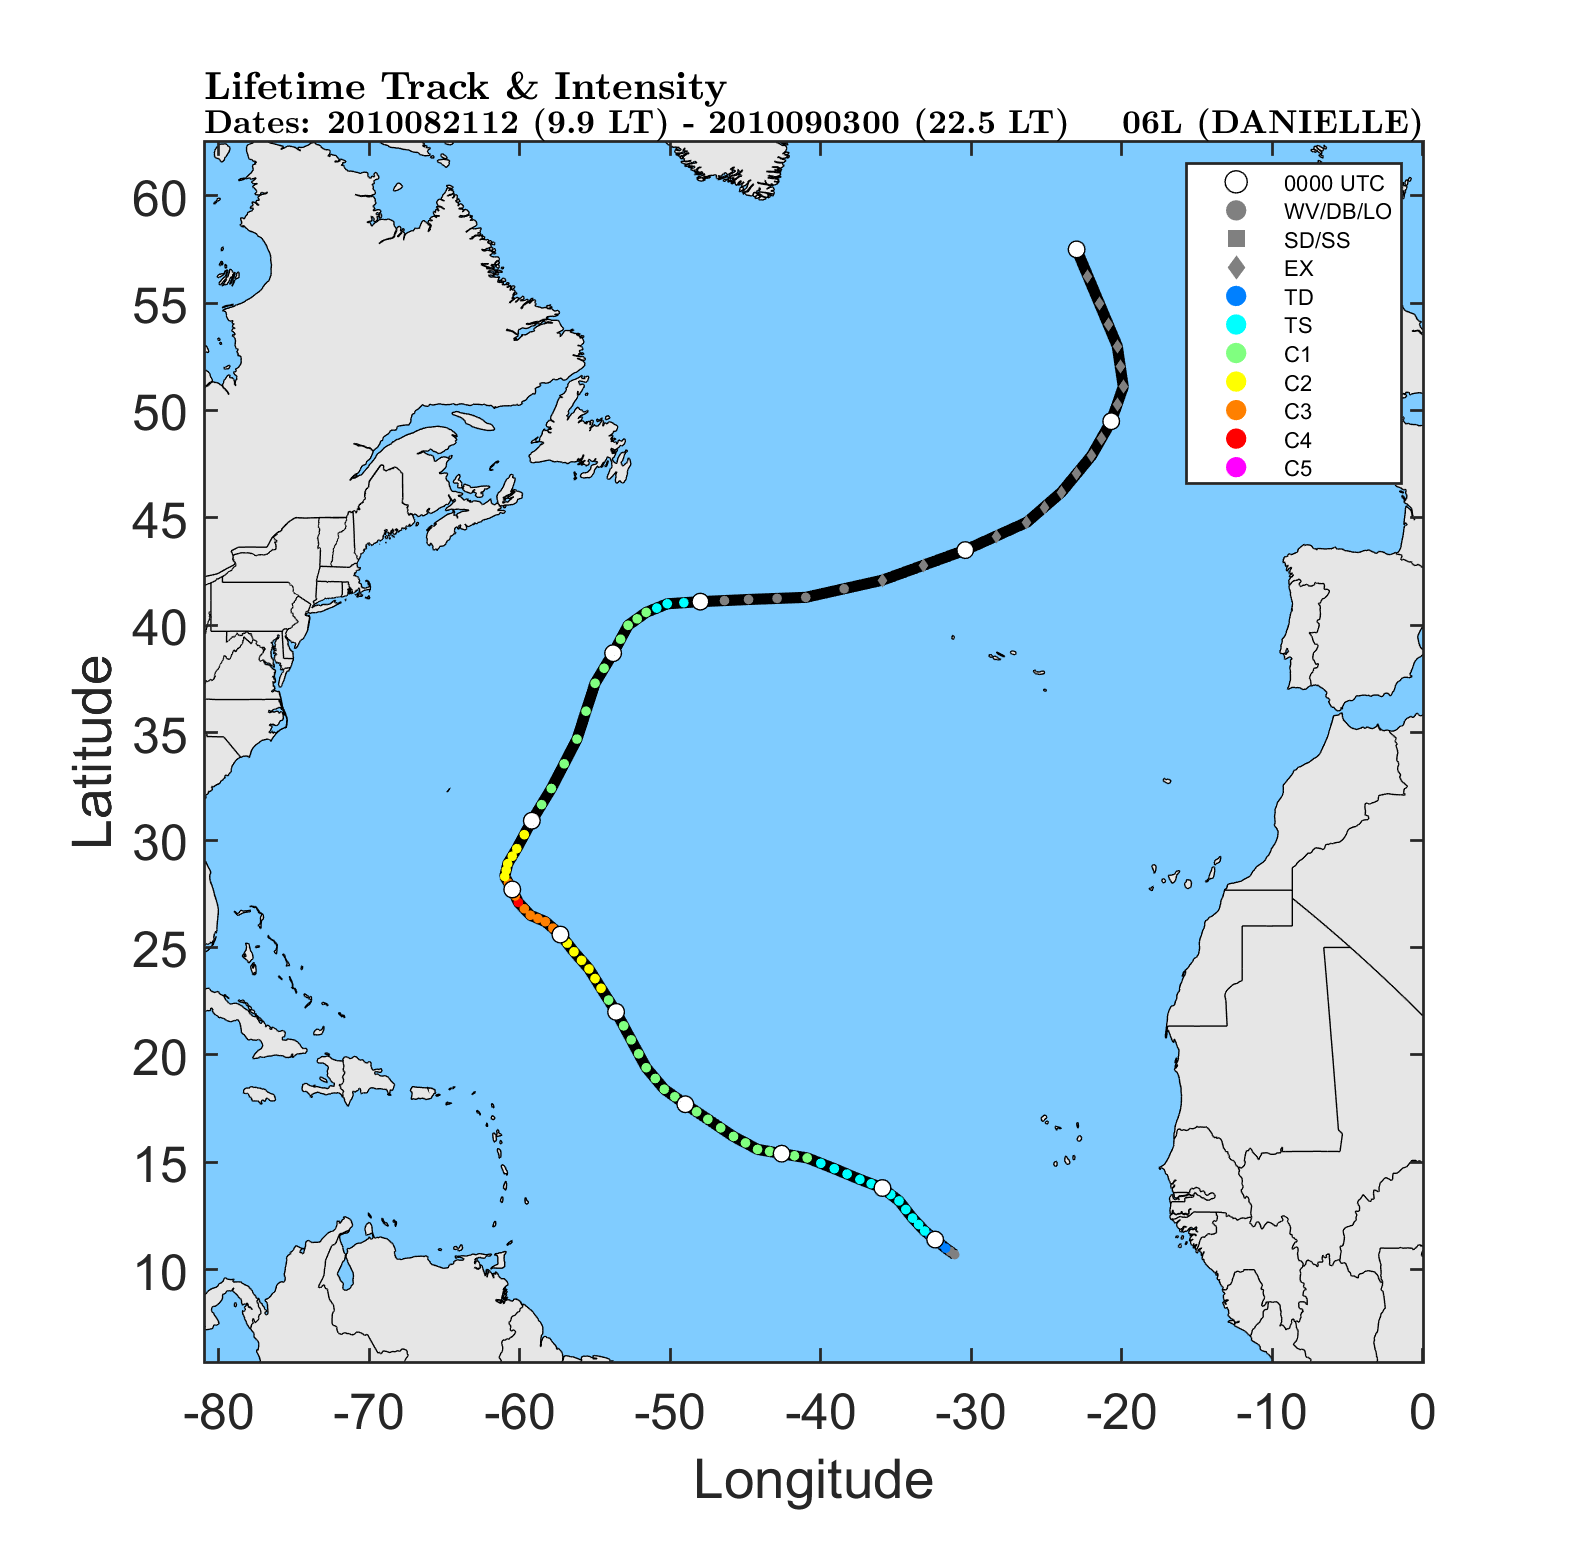
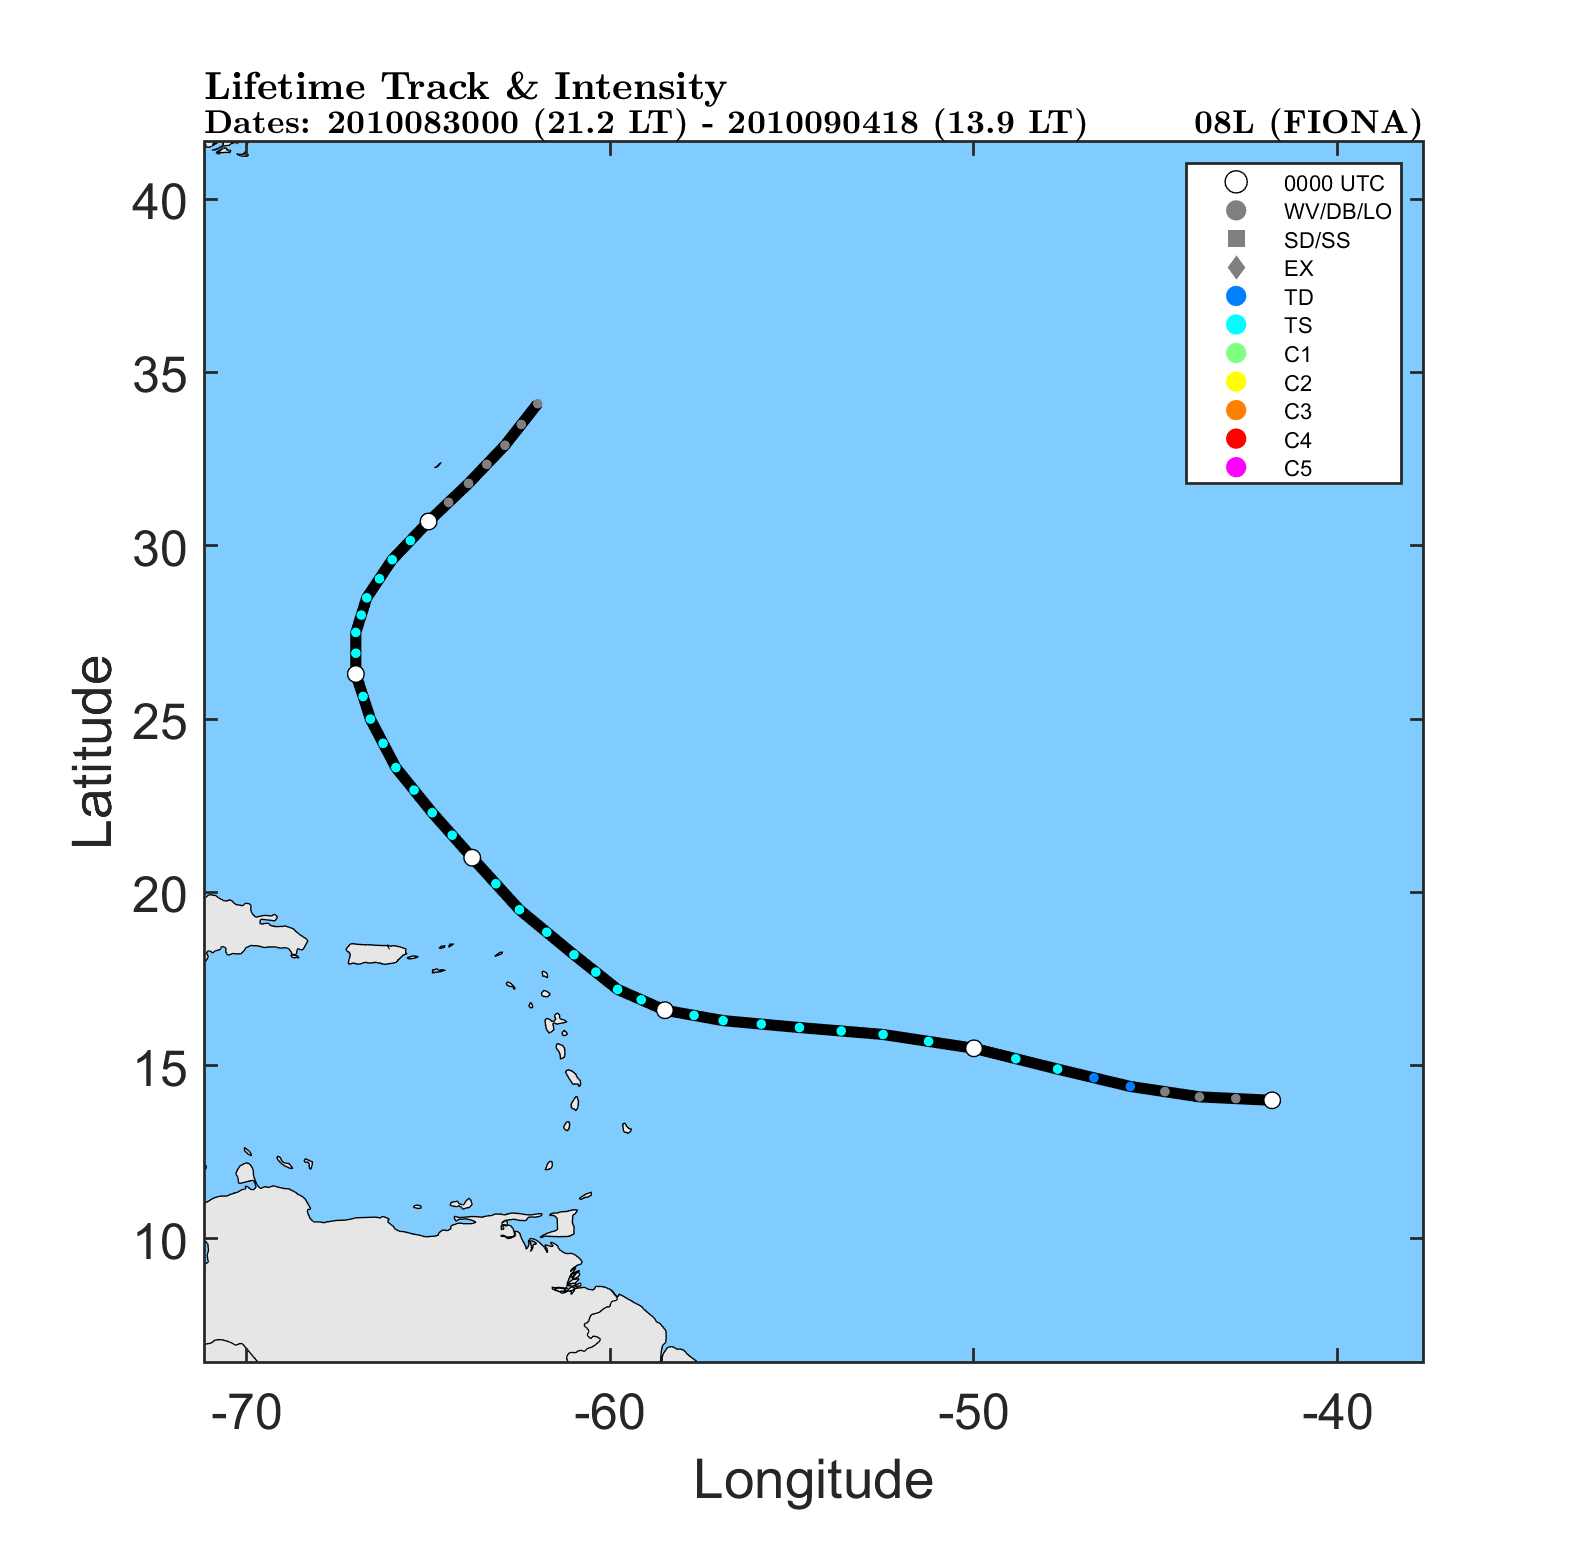
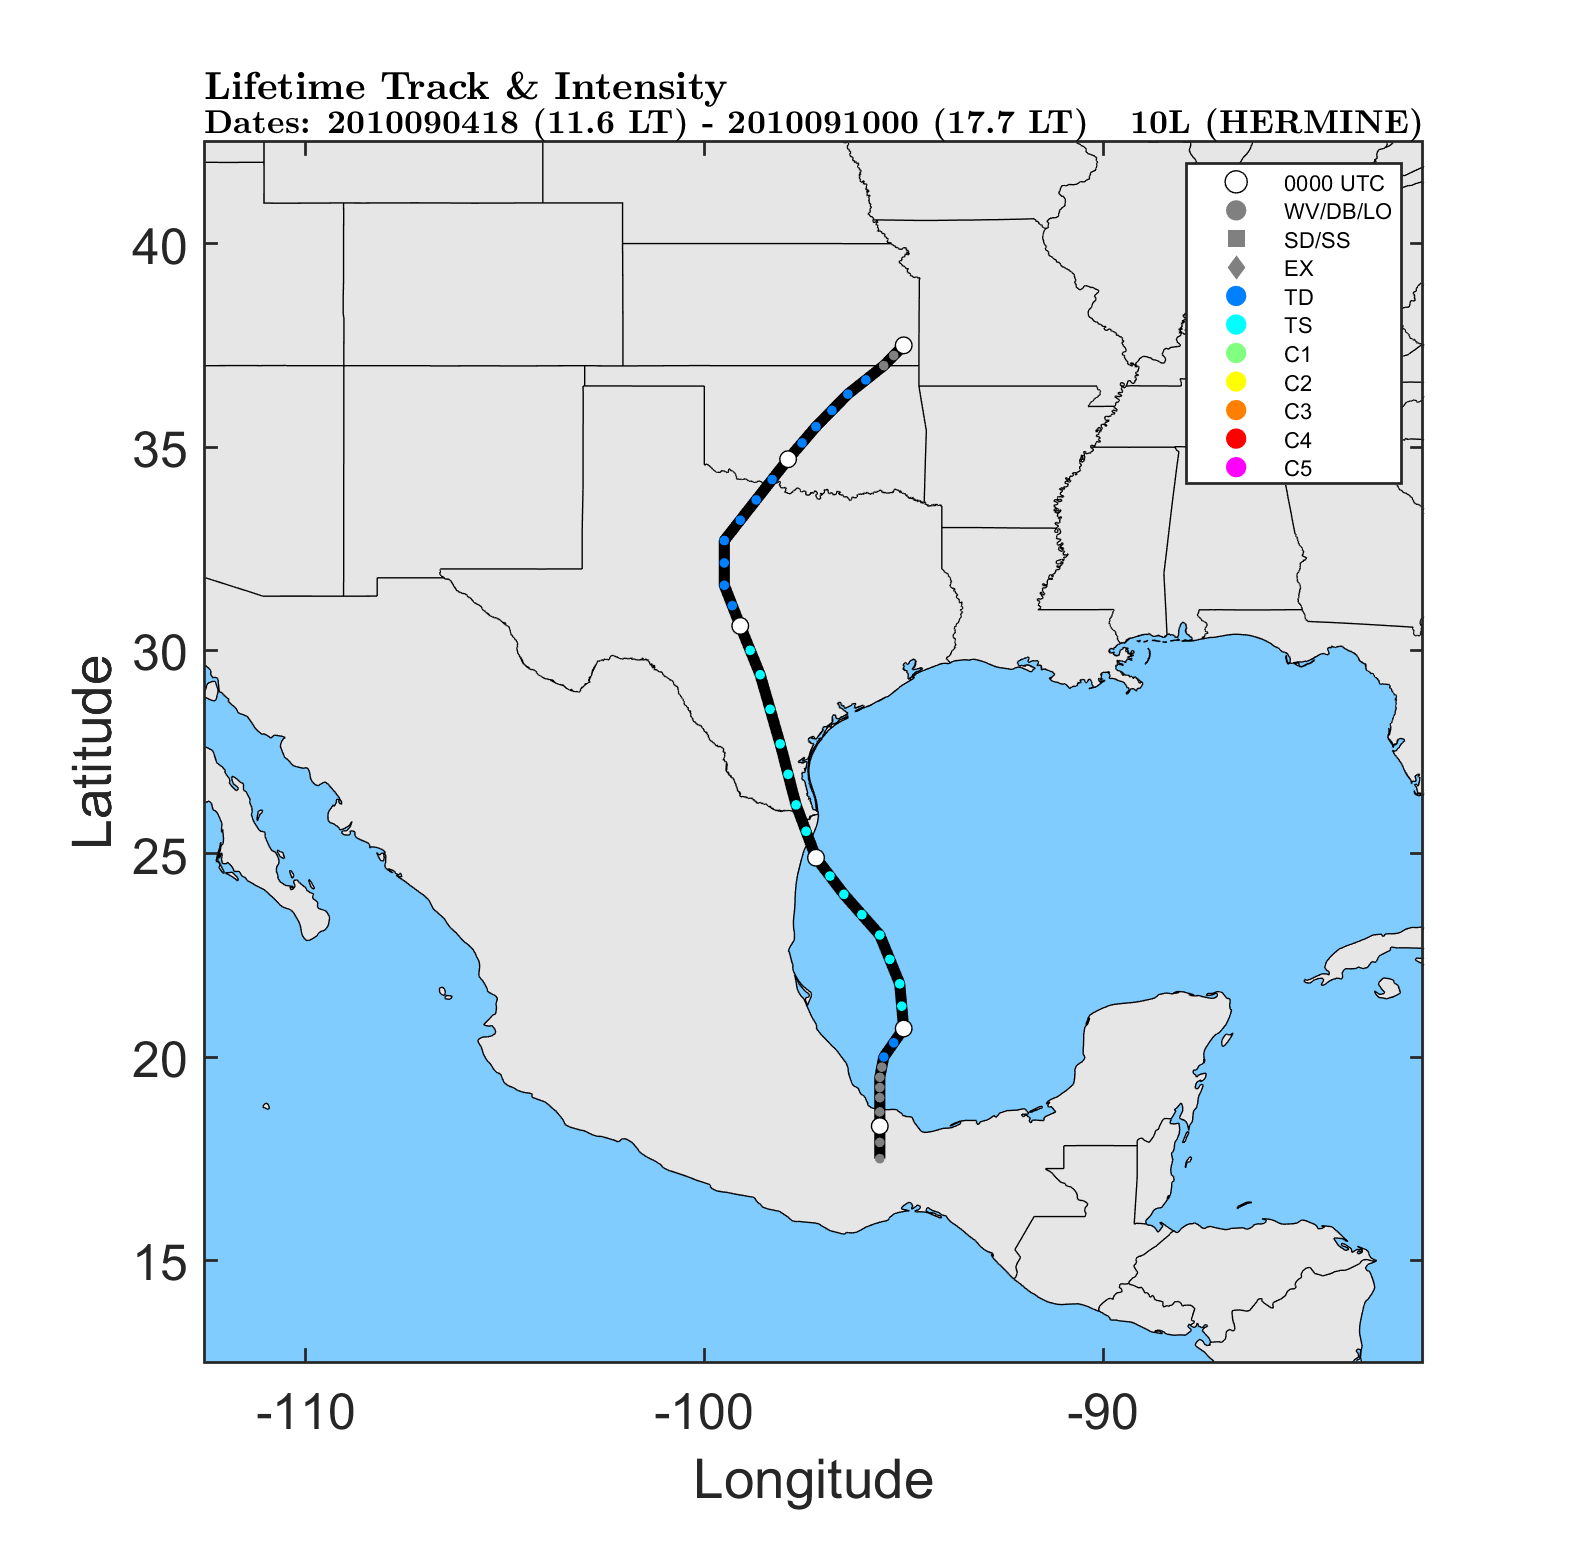
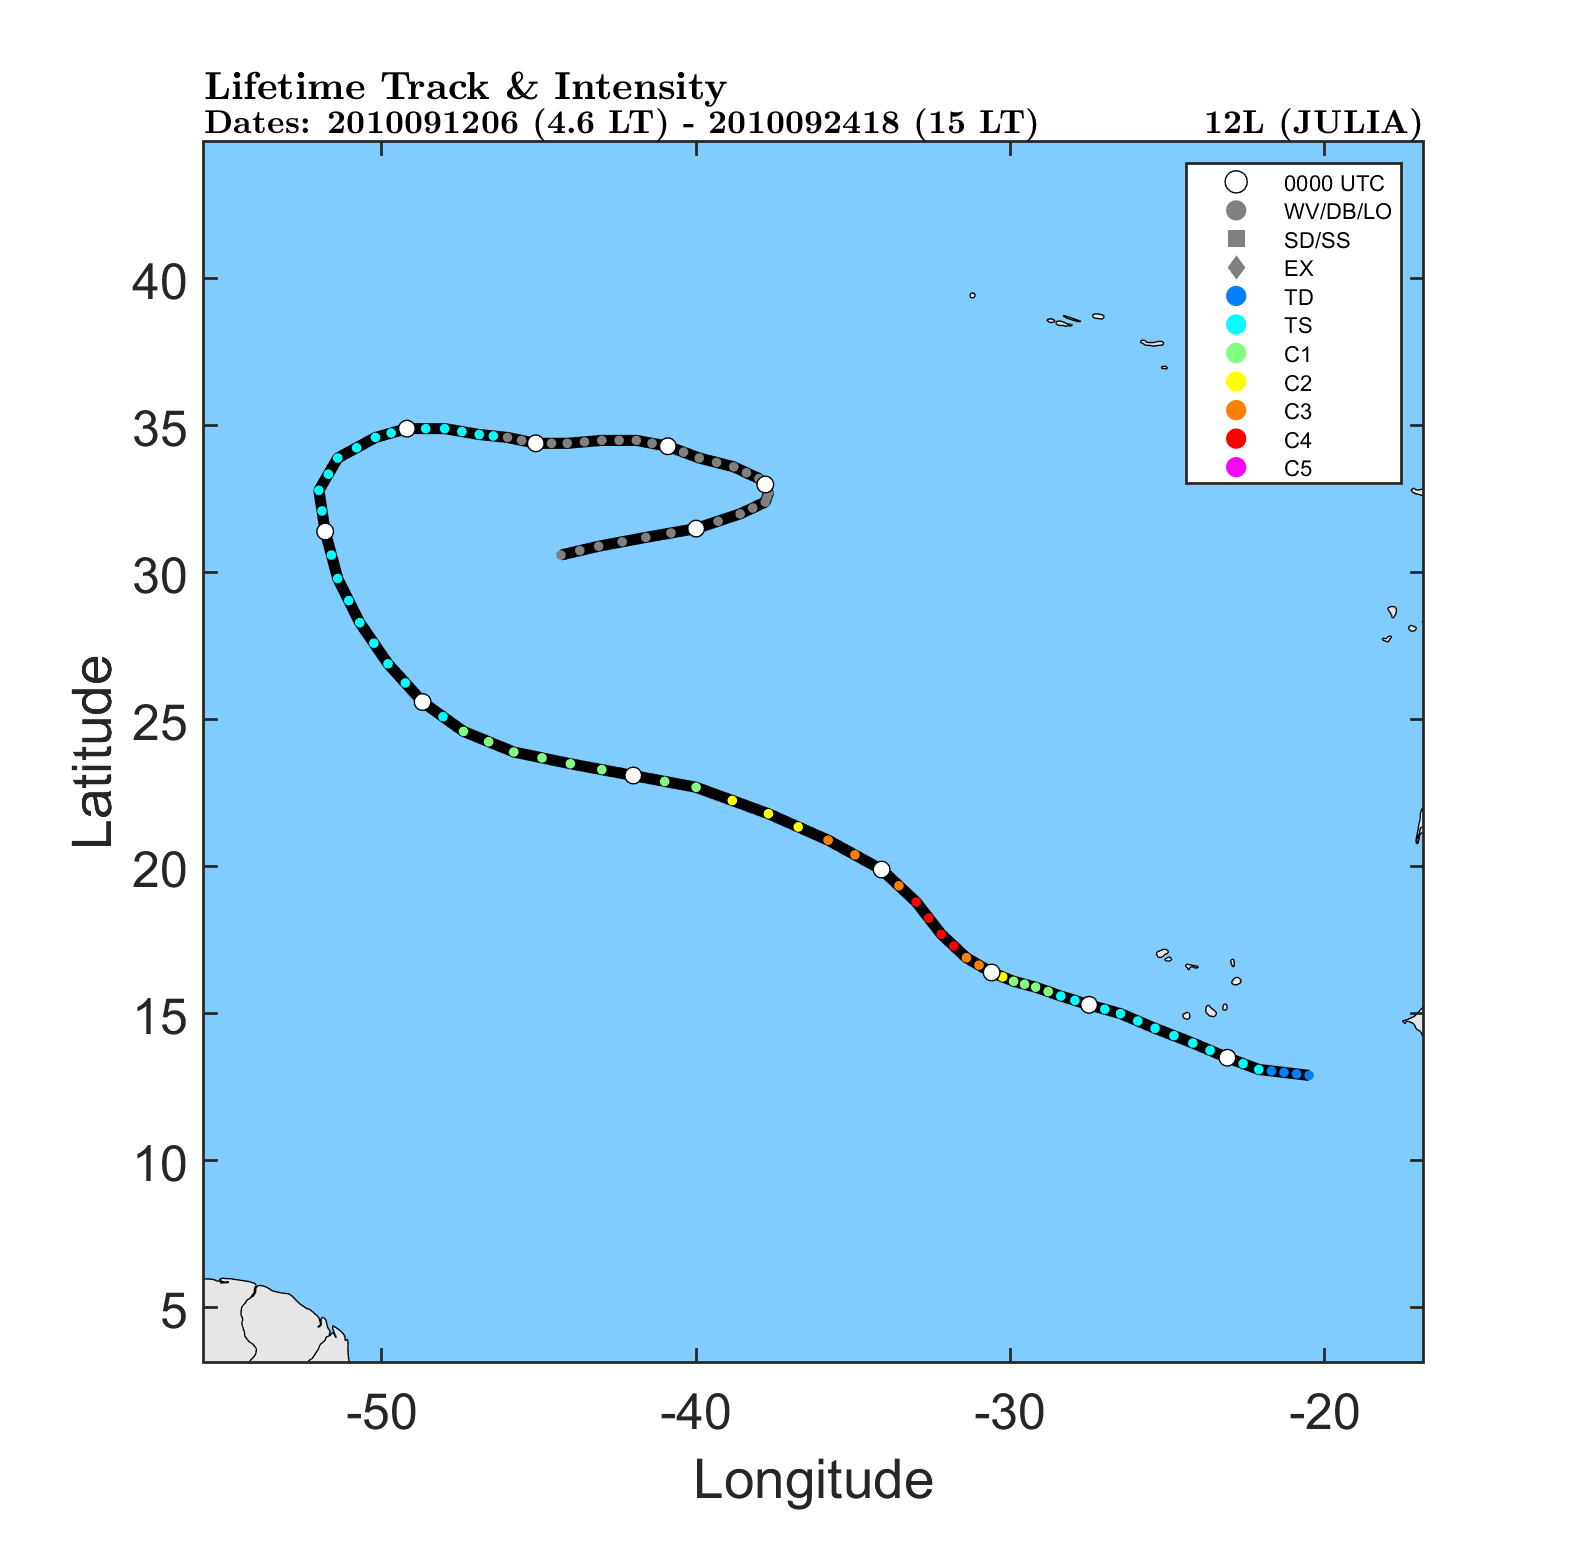
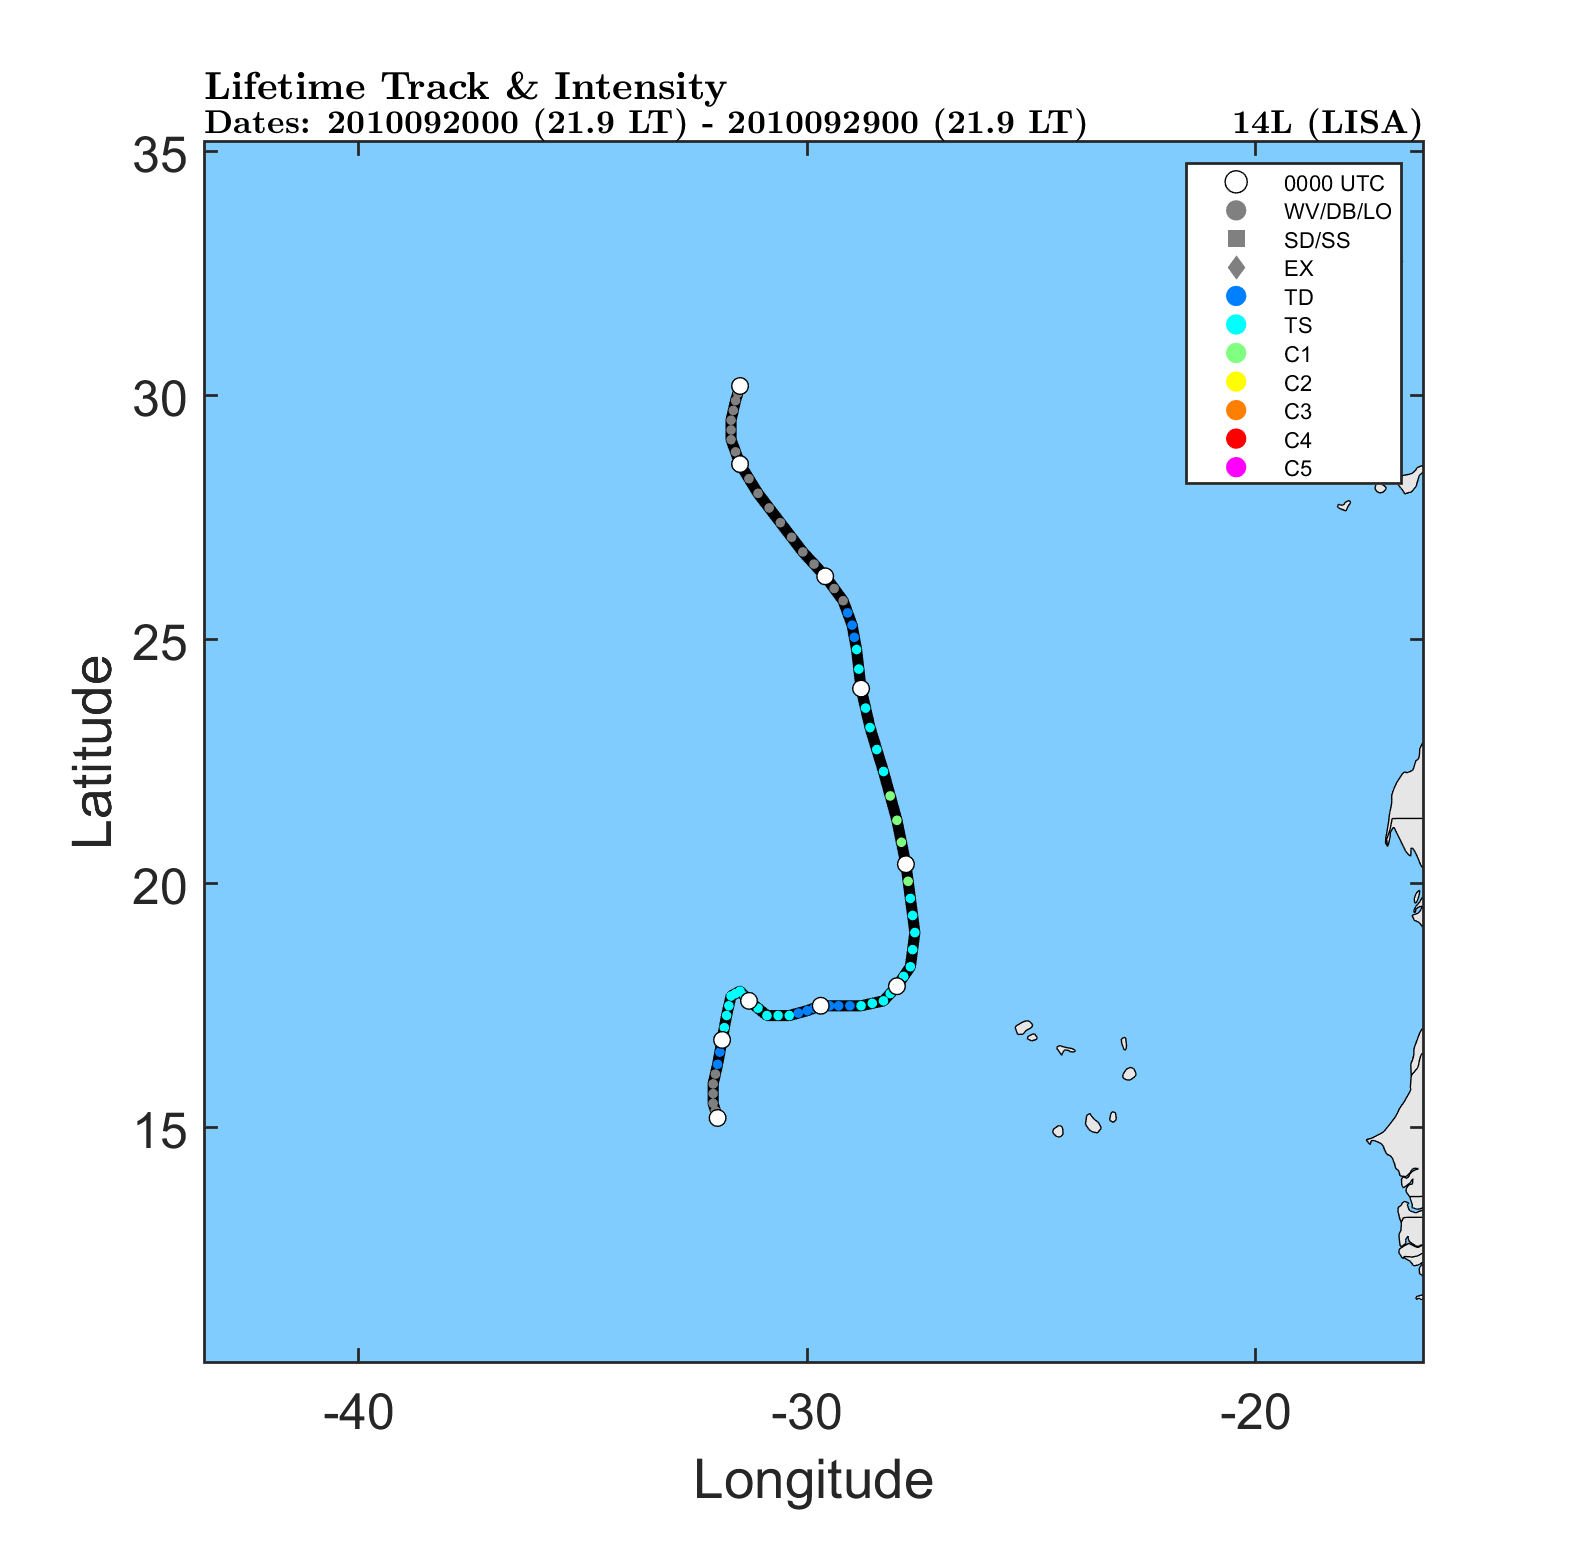
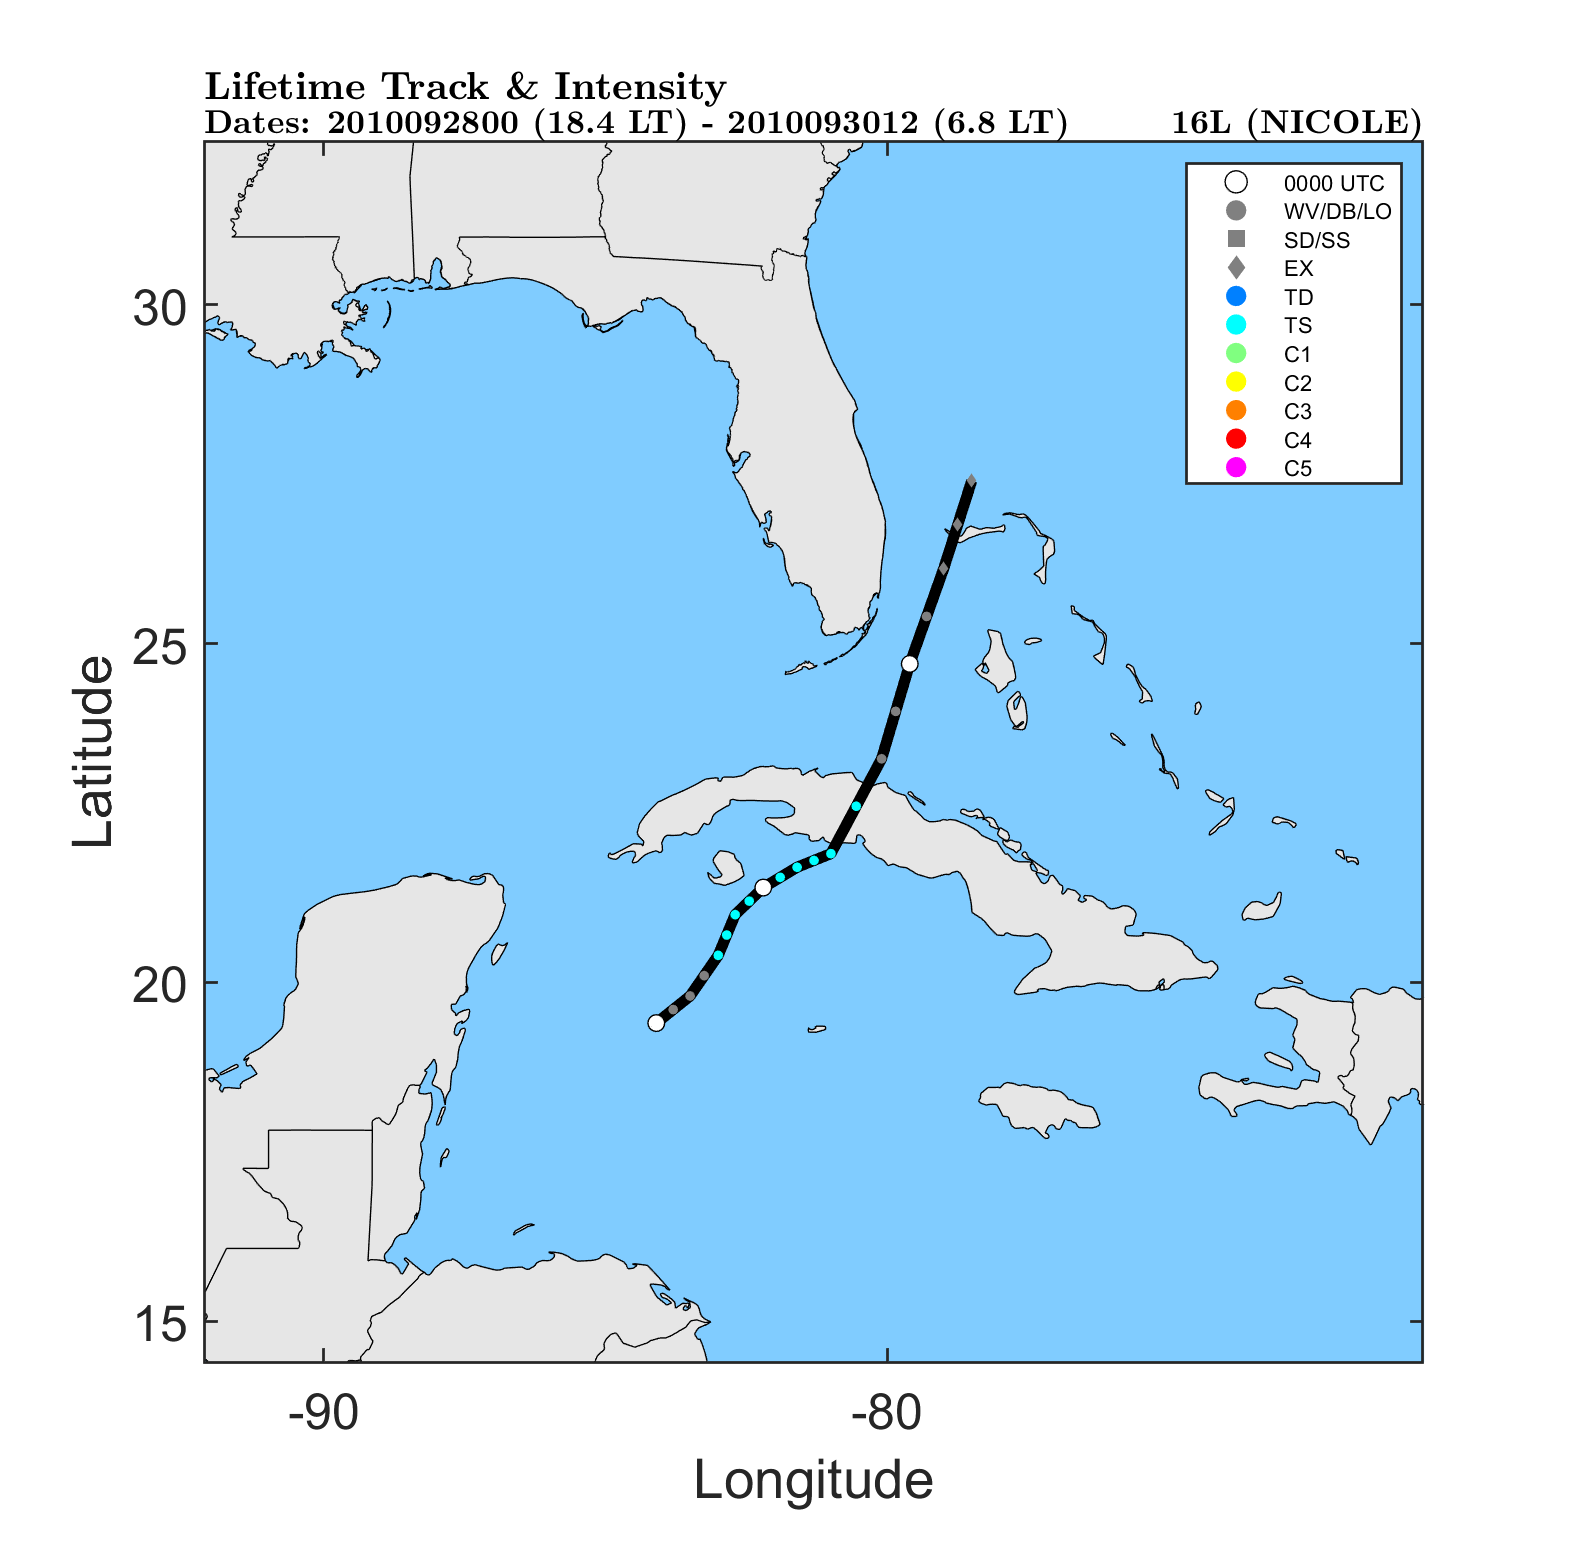
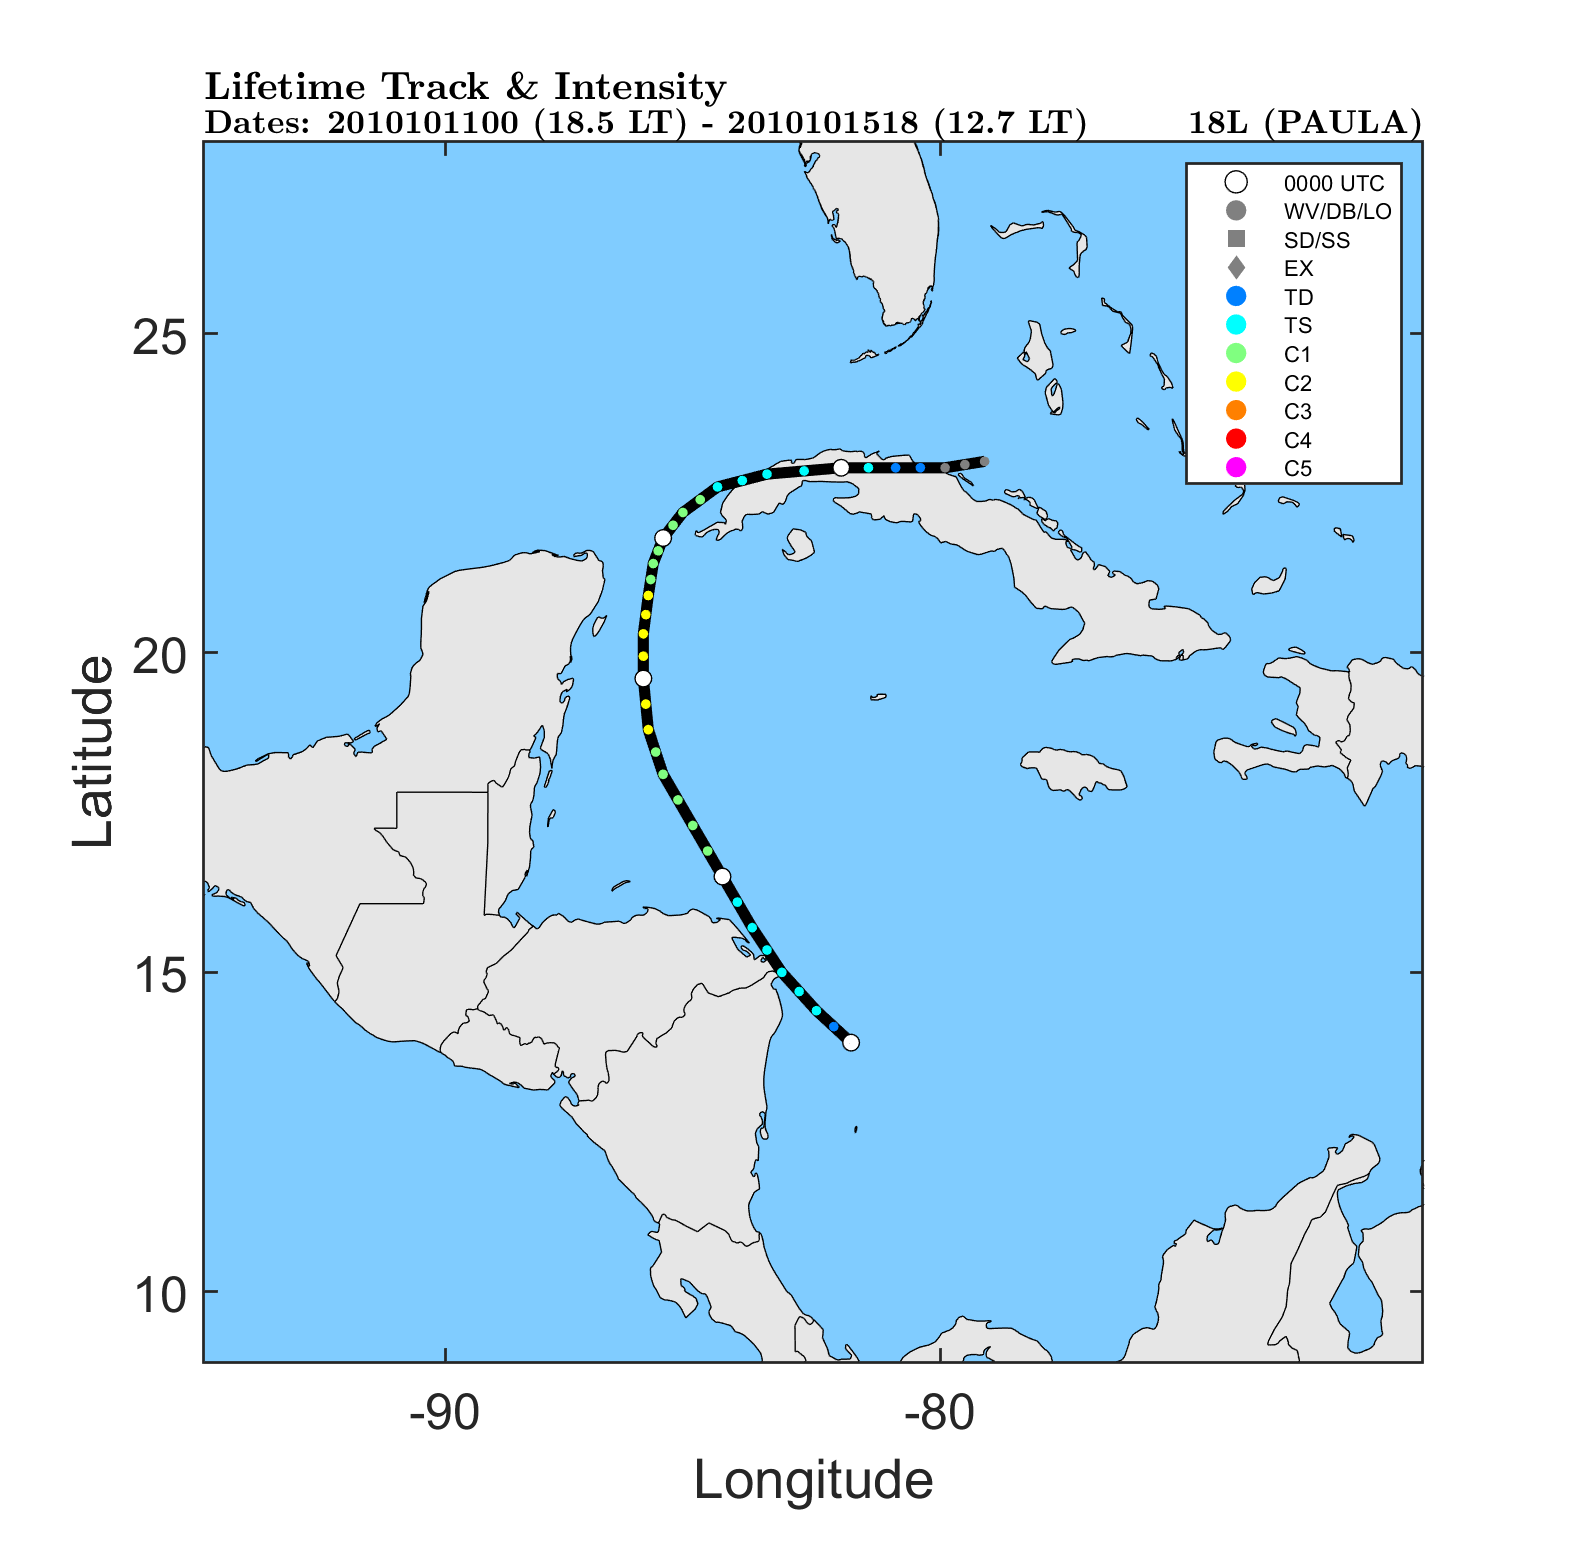
The below graphics depict the 3-h interpolated track of a given storm. Intensity data were retrieved from HURDAT2.
- White circles indicate each 0000 UTC time.
- Dark gray circles represent times when the storm was designated as a wave (WV), a disturbance (DB), or a low (LO).
- Dark gray squares represent times when the storm was designated as a subtropical depression (SD) or subtropical storm (SS).
- Dark gray diamonds represent times when the storm was designated as an extratropical storm (EX).
- The colored circles represent intensity according to the Saffir–Simpson hurricane wind scale (Simpson 1974) categories: tropical depression (TD; dark blue), tropical storm (TS; cyan), category 1 hurricane (C1; green), category 2 hurricane (C2; yellow), category 3 hurricane (C3; orange), category 4 hurricane (C4; red), and category 5 hurricane (C5; magenta).