List
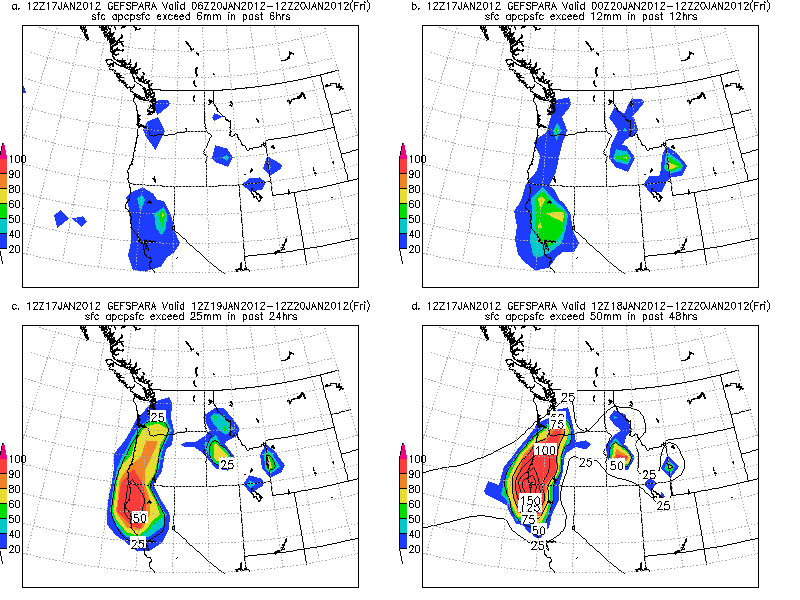
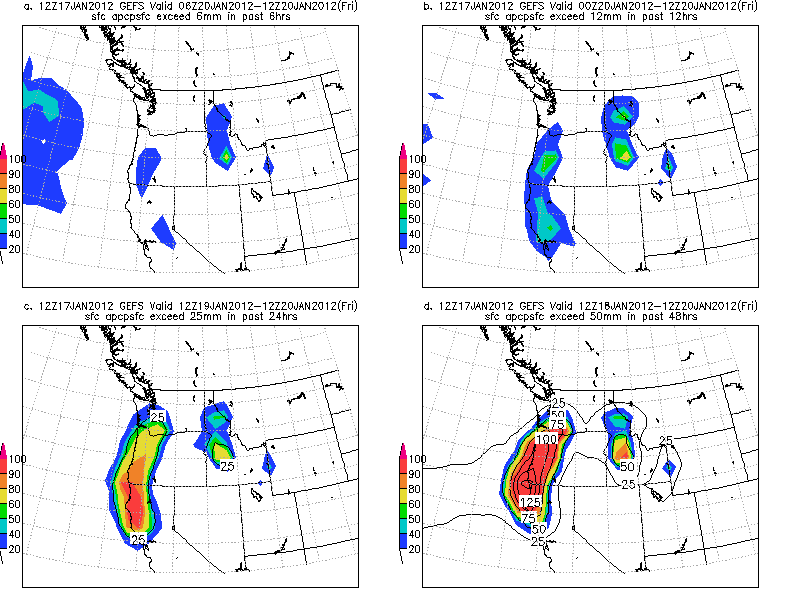
I will attach two QPF images which I hope are somewhat self
explanatory. One is the operational GEFS and the other is the higher
resolution parallel GEFS.
4 panels show QPF probs with the mean in 25mm intervals. The
thresholds vary with forecast length there are 6, 12 24 and 48 hour
accumulations. I picked the big 48 hour accumulation period. The big
24 hour accumulations appear to be on Wed-Thu. Another format to
show this.
The 48 hour 50 mm panel shows a big area of 50 mm but it also has a
huge closed 150mm contour and a tiny 175 mm contour.
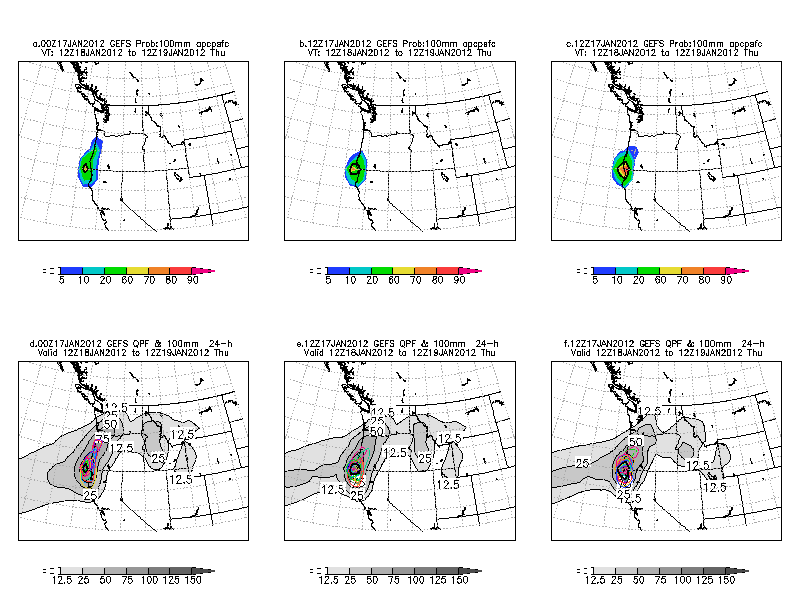
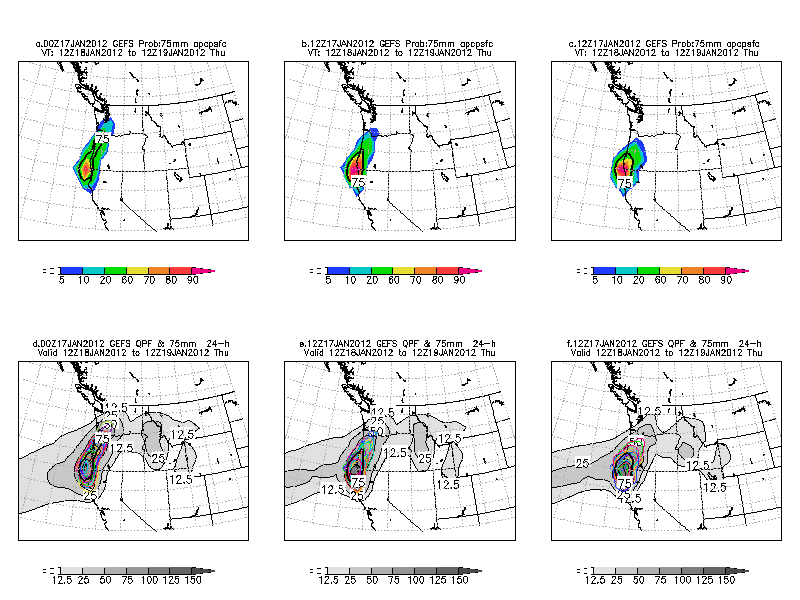
The 6 panels show the GEFS at 00 and 12 UTC for probabilities
(upper) and mean QPF(lower with spaghetti) the far right panels are
the NCEP GEFSPARA not the GEFS operational, only used 12Z cycle
today for the GEFSPARA.
Big amounts and the PARA has higher amounts and higher probs for any
category you pick.
Wish I knew what the model/ensemble climate was (M-climate) as these
numbers appear to be really big.
Rich
http://eyewall.met.psu.edu/rich/cases//20Jan2012/ (GEFS-75 vs GEFS55
images)
 -
-


Success comes by helping others be successful.
Life is a journey, not a destination.
Success comes by helping others be successful.
Life is a journey, not a destination.