Abstract
This study aims to the evaluate the extent to which atmospheric rivers (ARs) contribute to extreme precipitation events in the Northeast United States. Synoptic and mesoscale meteorological phenomena (e.g, landfalling tropical cyclones (TCs), atmospheric convection, extratropical cyclones, and lake-effect snow) associated with, and independent of, ARs were evaluated. Events were categorized by season, duration, average precipitation rate, and the presence or absence of an AR. Preliminary findings indicate that the shortest event durations and highest precipitation rates occur in the summer associated with atmospheric convection. In contrast, winter events tended to feature longer duration events with lighter precipitation rates associated with extratropical cyclones. Extreme precipitation events were most frequently associated with ARs in the winter and least frequently in the summer.
Introduction and Motivation
Heavy precipitation in the Northeast United States can be attributed to a wide variety of storm types. Howarth et al. (2019) evaluated the seasonal trends of Northeast extreme precipitation events and classified events as either “extratropical cyclone,” “convective,” “associated with tropical moisture,” “hurricane/tropical storm,”, or “unidentified.” However, their study did not explicitly address ARs. Slinskey et al. (2020) evaluated the precipitation and climatology of ARs in the Northeast U.S. National Climate Assessment Region and found that while ARs occur in all seasons across the Northeast, they are most frequent in the fall (see their Fig. 2). Howarth et al. (2019) and Slinskey et al. (2020) both emphasize that although ARs can result in heavy precipitation events in the Northeast, they are not the only meteorological phenomena responsible for them. This result largely differs from the West Coast where more than 75% of the top-decile 24 h extreme precipitation events in portions of northwestern California, Oregon, and Washington were associated with ARs (Rutz et al. (2014); their Fig. 11). This study therefore seeks to identify and classify extreme precipitation events in the Northeast United States by their duration, type of weather phenomena, precipitation rate, and AR association to build upon the previous literature.
Methodology
For the purposes of this study, the Northeast United States was defined as Pennsylvania and New Jersey northward. The time period was from 1 January 2002–31 December 2024. Gridded hourly precipitation data was obtained from the United States Geological Service (USGS) Stage-IV Zarr Server. Stage-IV precipitation was chosen for this study due to its high resolution (available on a 4 km by 4 km polar stereographic grid) and quality control from the thirteen National Weather Service River Forecast Centers. As a result of the multi-sensor observations (e.g., rainfall gauge reports, mesonet observations, and doppler radar estimates) and human oversight, Stage-IV represents the highest resolution and most accurate dataset to use for this study.
To establish a definition of extreme precipitation, the 90th percentile of daily (0000–2300 UTC) measurable precipitation (>0.254 mm) for every calendar month was calculated at every grid point. From the Clausius–Clapeyron relationship, warmer temperatures result in greater moisture.
Considering precipitation efficiency (Doswell et al. (1996)), the heaviest precipitation rates would likely occur in the summer when there is the most moisture. Furthermore, since TCs occur in the summer and fall, one would expect the highest 90th percentile to occur during these months. Since this study aims to investigate the influence of ARs in Northeast precipitation events, calculating the 90th percentile as a function of month, rather than annually, was necessary to ensure that all wintertime AR events were captured.
An extreme precipitation event was defined when the 24 h rolling precipitation sum for a given grid point exceeded the monthly 90th percentile of daily precipitation (Figure 1) Notebook-code. Inspired by Lamjiri et al. (2017), the start and end time of each event was defined by at least six consecutive hours of no precipitation. It is important to note that events where the 24 h rolling sum calculated from the start time of the event never exceeded the 90th percentile were discarded. This exclusion occurred when the rolling sum exceeded the 90th percentile from precipitation that occurred prior to the six consecutive hours of dry conditions.
For each precipitation event identified, a precipitation mass centroid in time was calculated to determine the hour most representative of when the heaviest precipitation occurred. This mass centroid approach was particularly useful for long duration events where the hourly precipitation was non-uniform. Figure 2 provides an example event that occurred at the grid point closest to John F. Kennedy Airport in New York City from 0000–1700 UTC 16 April 2018.
Finally, to determine if an AR was present at the time of the centroid of the extreme precipitation event, the Global Atmospheric Rivers Database Version 4 (Guan & Waliser (2024)) was utilized. Guan and Waliser identify an AR using a monthly IVT magnitude threshold and several geometric considerations (e.g., the coherence of IVT and the length to aspect ratio). Since the AR dataset is six-hourly, the event centroids were rounded to the nearest six-hour mark, with times at the midpoint (e.g., 0300 UTC and 0900 UTC) rounded down to the previous interval (e.g., 0000 and 0600 UTC). This dataset was used to determine if an AR was present for a given event and to investigate the spatial extent and proximity of the AR relative to a grid point of interest.
Results
The total number of extreme rainfall events across the domain was largely influenced by the topography of the Northeast United States (Figure 3). The greatest number of events occurred in the highest elevations of the Northeast, such as the Greens, Catskills, Adirondacks, Berkshires, and Appalachians, where 350–425 events were common. As a result of orographic precipitation processes, these locations had the greatest number of days with measurable precipitation, and thus the highest number of cases. Areas prone to lake effect snow across western New York and the Tug Hill Plateau had an even greater number of cases, between 475–500 events, where numerous days of measurable precipitation occurred in the winter.
To further understand the meteorological phenomena associated with extreme precipitation in the Northeast, the events were stratified by month and duration (Figure 4). The lowest average event durations, between 10–20 hours, occurred during the summer months from May–August. This result suggests that summer extreme precipitation events are largely associated with atmospheric convection, which is shorter-lived than extratropical cyclones. April appears to be a transition month between different atmospheric phenomena. In April, the event duration across much of the domain was between 15–25 hours. By May, the average event duration was closer to 10–20 hours. This finding implies that extratropical cyclones are the most common contributor to extreme precipitation in April and that convection begins to become more of a factor by May. Similarly, September is also unique as the event duration begins to increase following the summer months. While convection is still expected to occur in September, TCs and extratropical cyclones associated with increased baroclinicity could result in longer duration events. Finally, during the winter months, the average event duration was longest. In particular, the lake effect snow regions have the longest average event duration in November, December, and January of greater than 30 hours.
Another way to visualize this data is to stratify the cases by duration, average precipitation rate, season, and AR association for an individual grid point, i.e., Albany, NY (Figure 5). For Albany, NY, there was a total of 358 events. While all seasons indicated a logarithmic relationship between average hourly precipitation rate and event duration, this relationship was most pronounced in summer. During the summer, atmospheric convection is the most dominant storm type. While often short-lived, convection frequently produces heavy precipitation rates. In contrast, the longest duration events occurred in winter when extratropical cyclones are most common. These results are consistent with Figure 4. Since the total event precipitation is a function of both the rate and duration of the precipitation, the event total precipitation is similar across the seasons.
However, the rate and duration of events vary depending on the dominant atmospheric phenomena, which themselves are seasonally dependent.
As for ARs, an event was said to be associated with an AR if an AR was detected at any grid point within 1.5º of the Albany grid point. Events were most and least associated with ARs in the winter and summer respectively (Figure 5 and Figure 6). While further work needs to be conducted, a preliminary hypothesis that may explain these results is that summer into early fall events are more driven by convection and TCs, reducing the likelihood of association with ARs. Finally, one can visualize the spatial extent of ARs as a function of season (Figure 7). For all rounded centroids at the Albany grid point, ARs were most common during the winter throughout the entire domain. The location of the ARs were also skewed to the east of Albany, which was not a surprise since the closer one gets to the water, the more frequent the ARs are.
Concluding Summary
This study provides a comprehensive overview of the characteristics of extreme precipitation events in the Northeast United States. The duration, precipitation rate, and atmospheric phenomena responsible for the event were investigated throughout this study. Shorter duration but higher precipitation intensity events were most frequent during the summer months and were likely associated with atmospheric convection. Longer duration and lighter precipitation rate events occurred during the winter when extratropical cyclones are most common. The primary goal of this study was to evaluate the influence that ARs have in Northeast extreme precipitation events. Preliminary work found that ARs were most frequent in the winter months and to the east of Albany, NY. Further investigation of AR associated events needs to be conducted, such as stratifying events by integrated vapor transport magnitude and comparison to the West Coast.
Figures
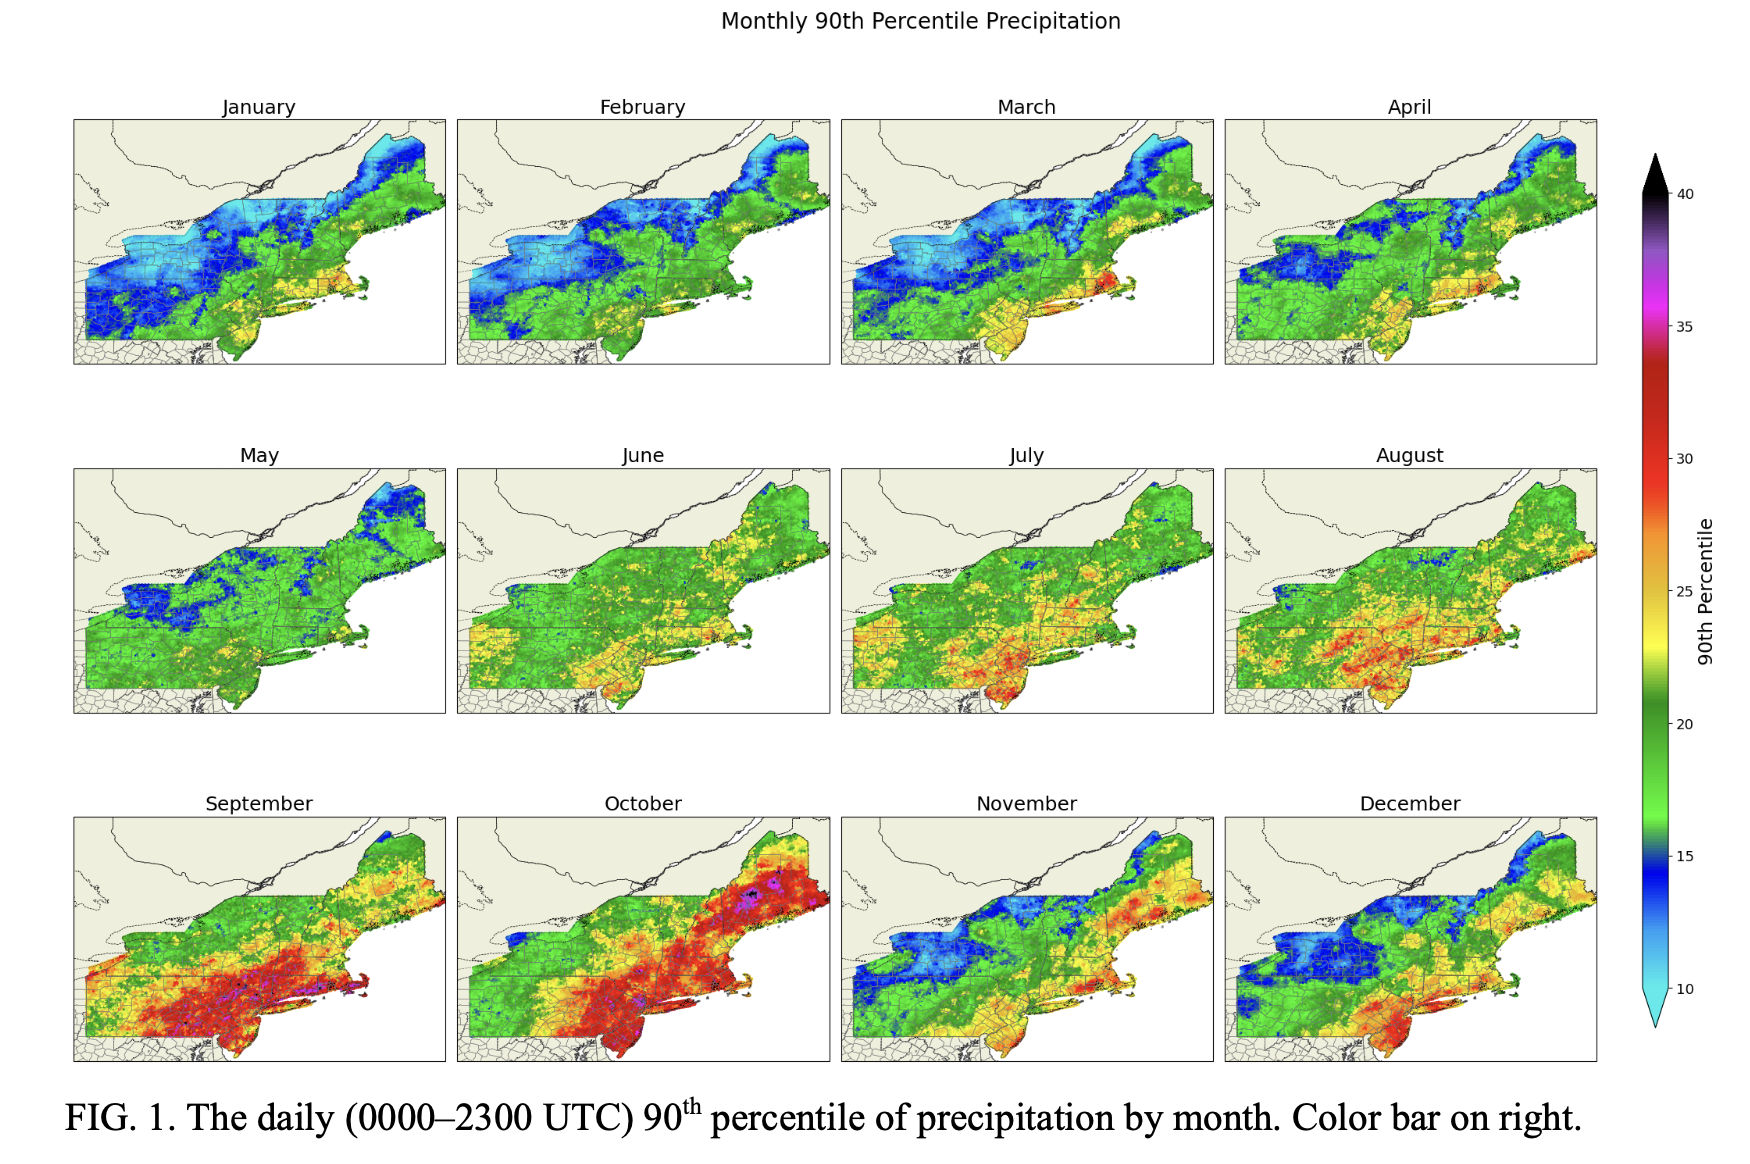
Figure 1:Figure 1
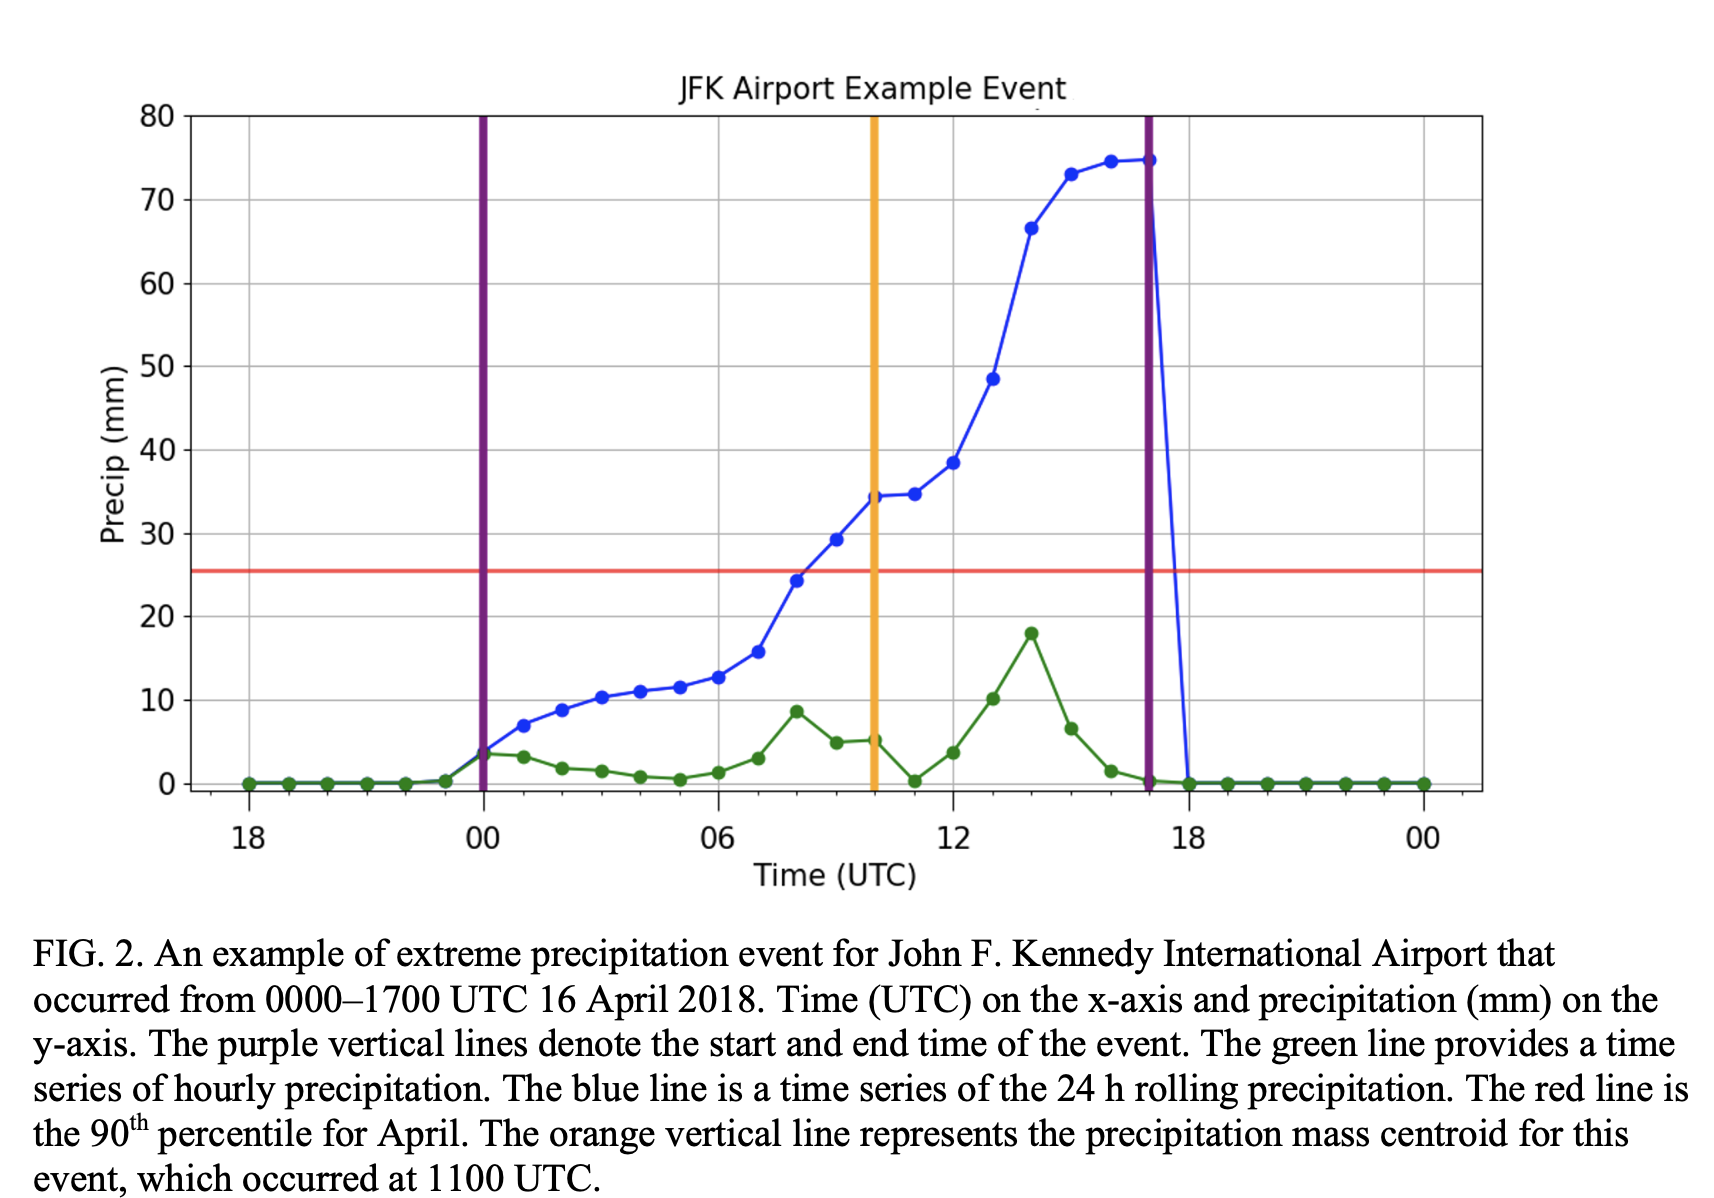
Figure 2:Figure 2
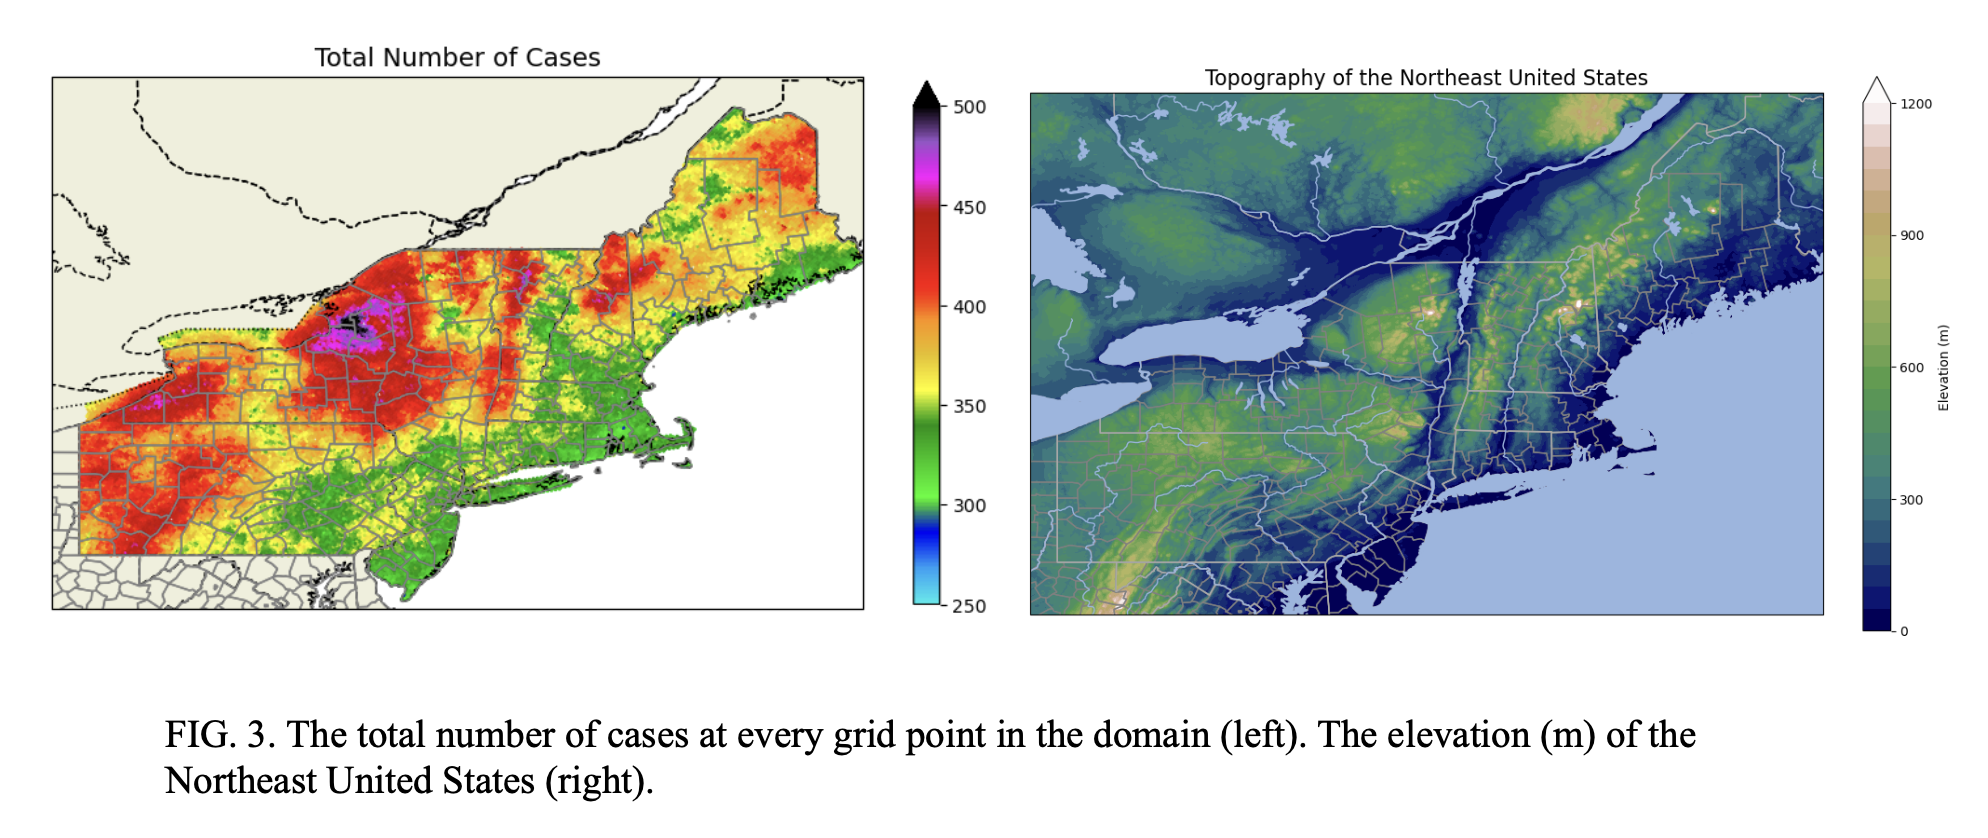
Figure 3:Figure 3
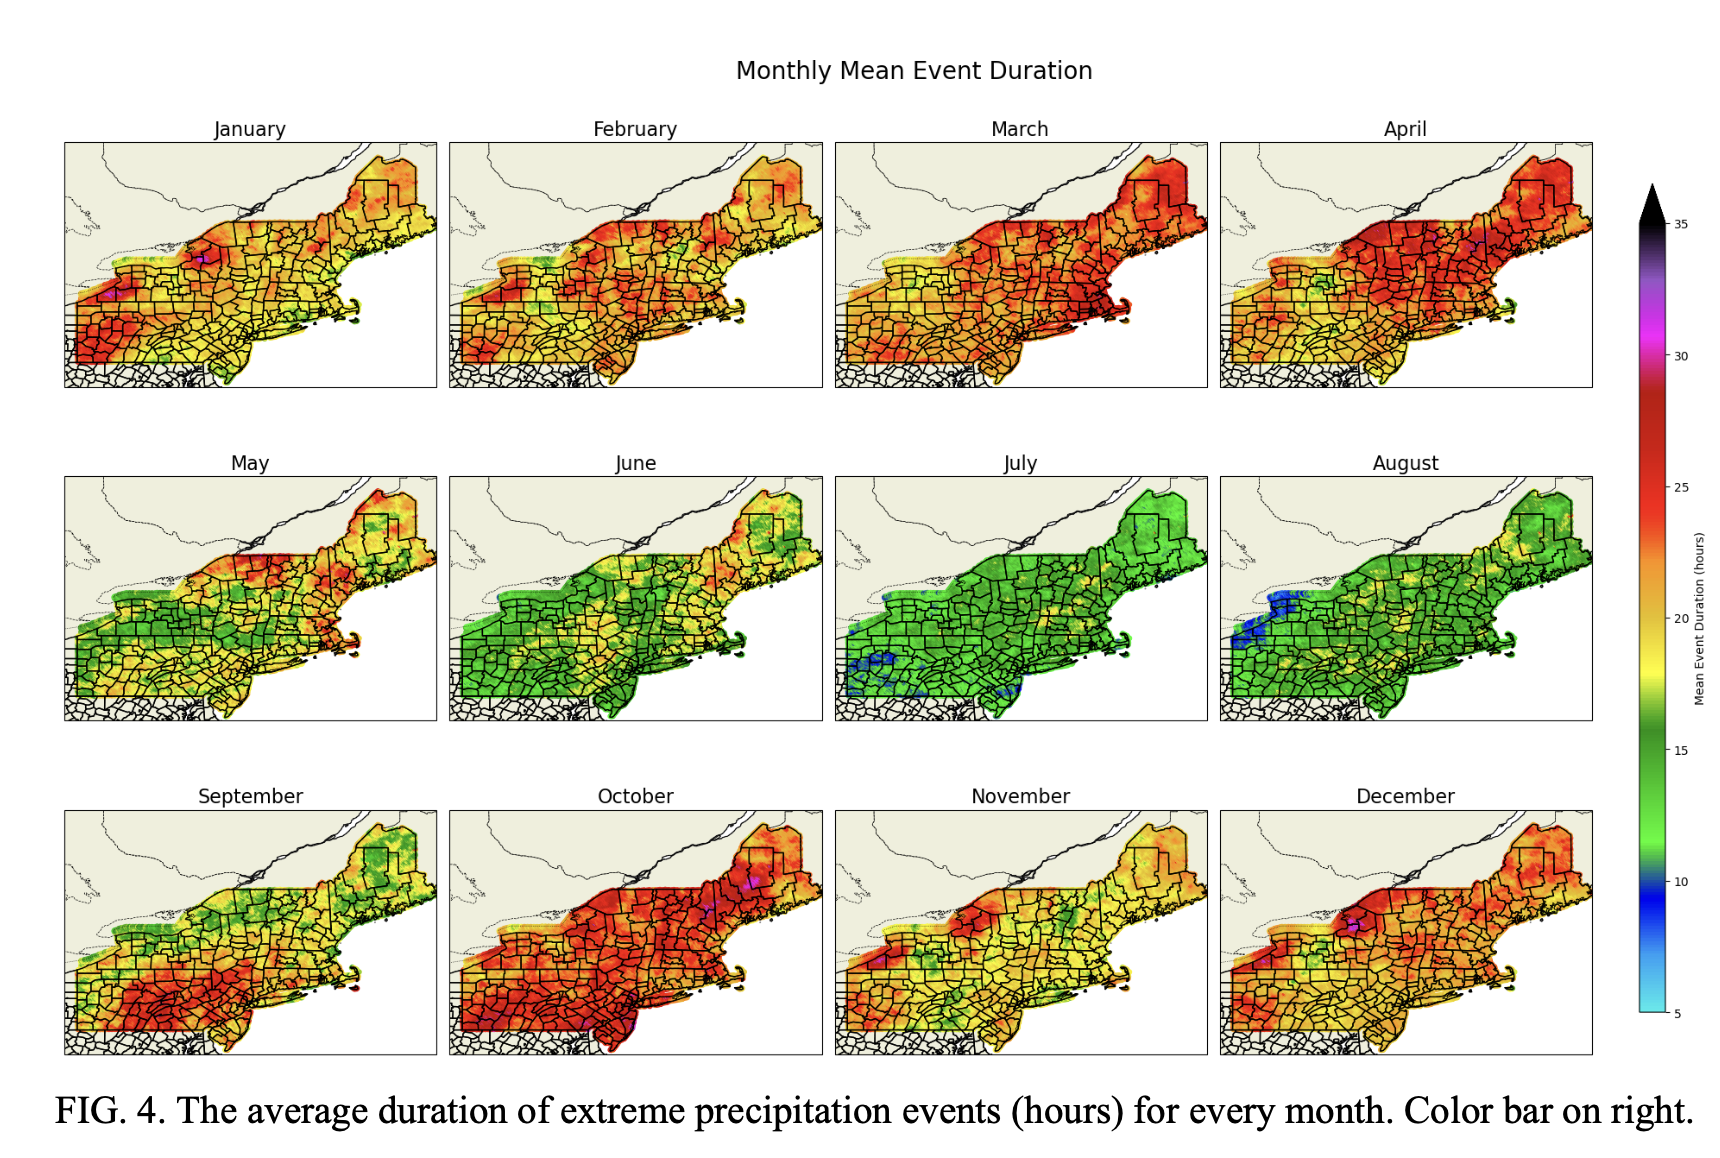
Figure 4:Figure 4
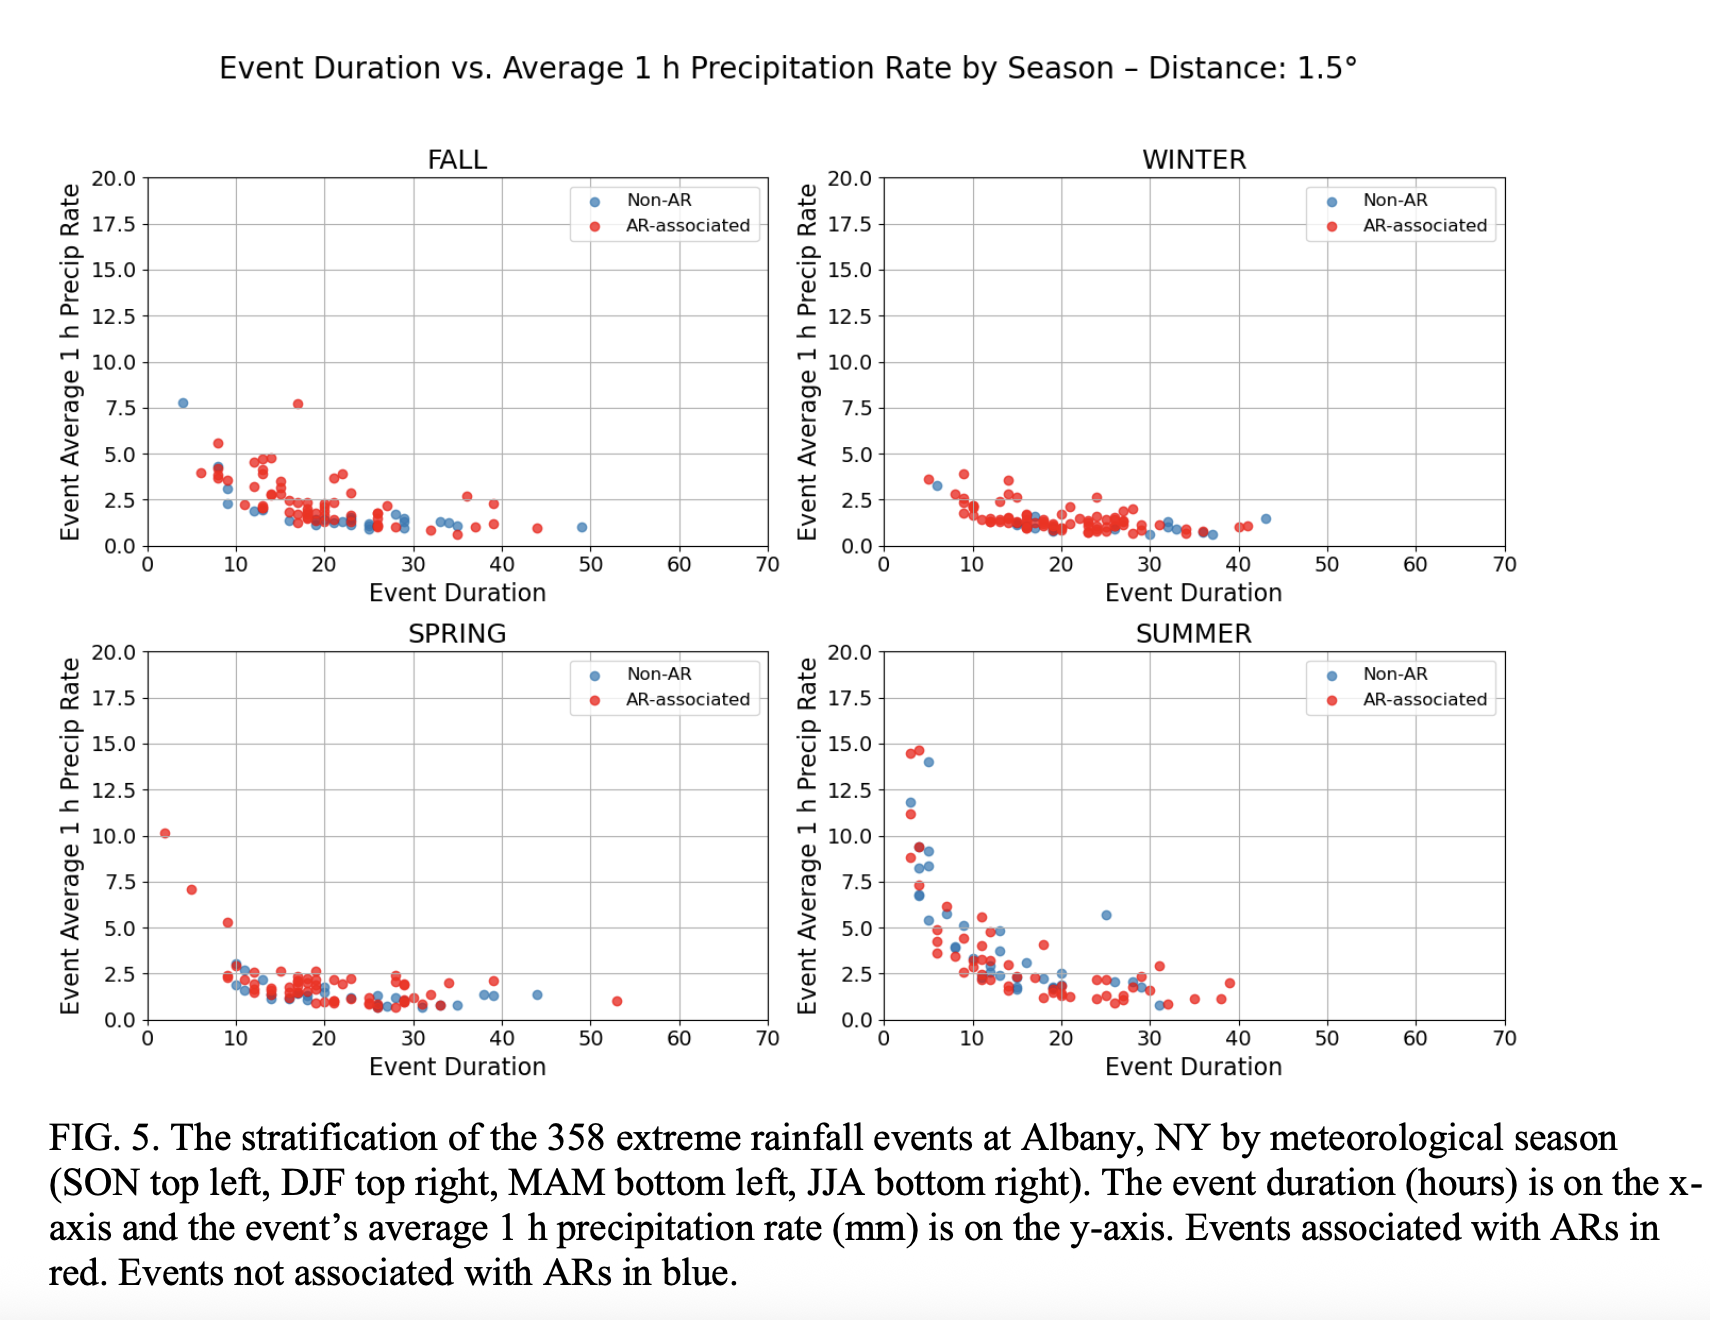
Figure 5:Figure 5
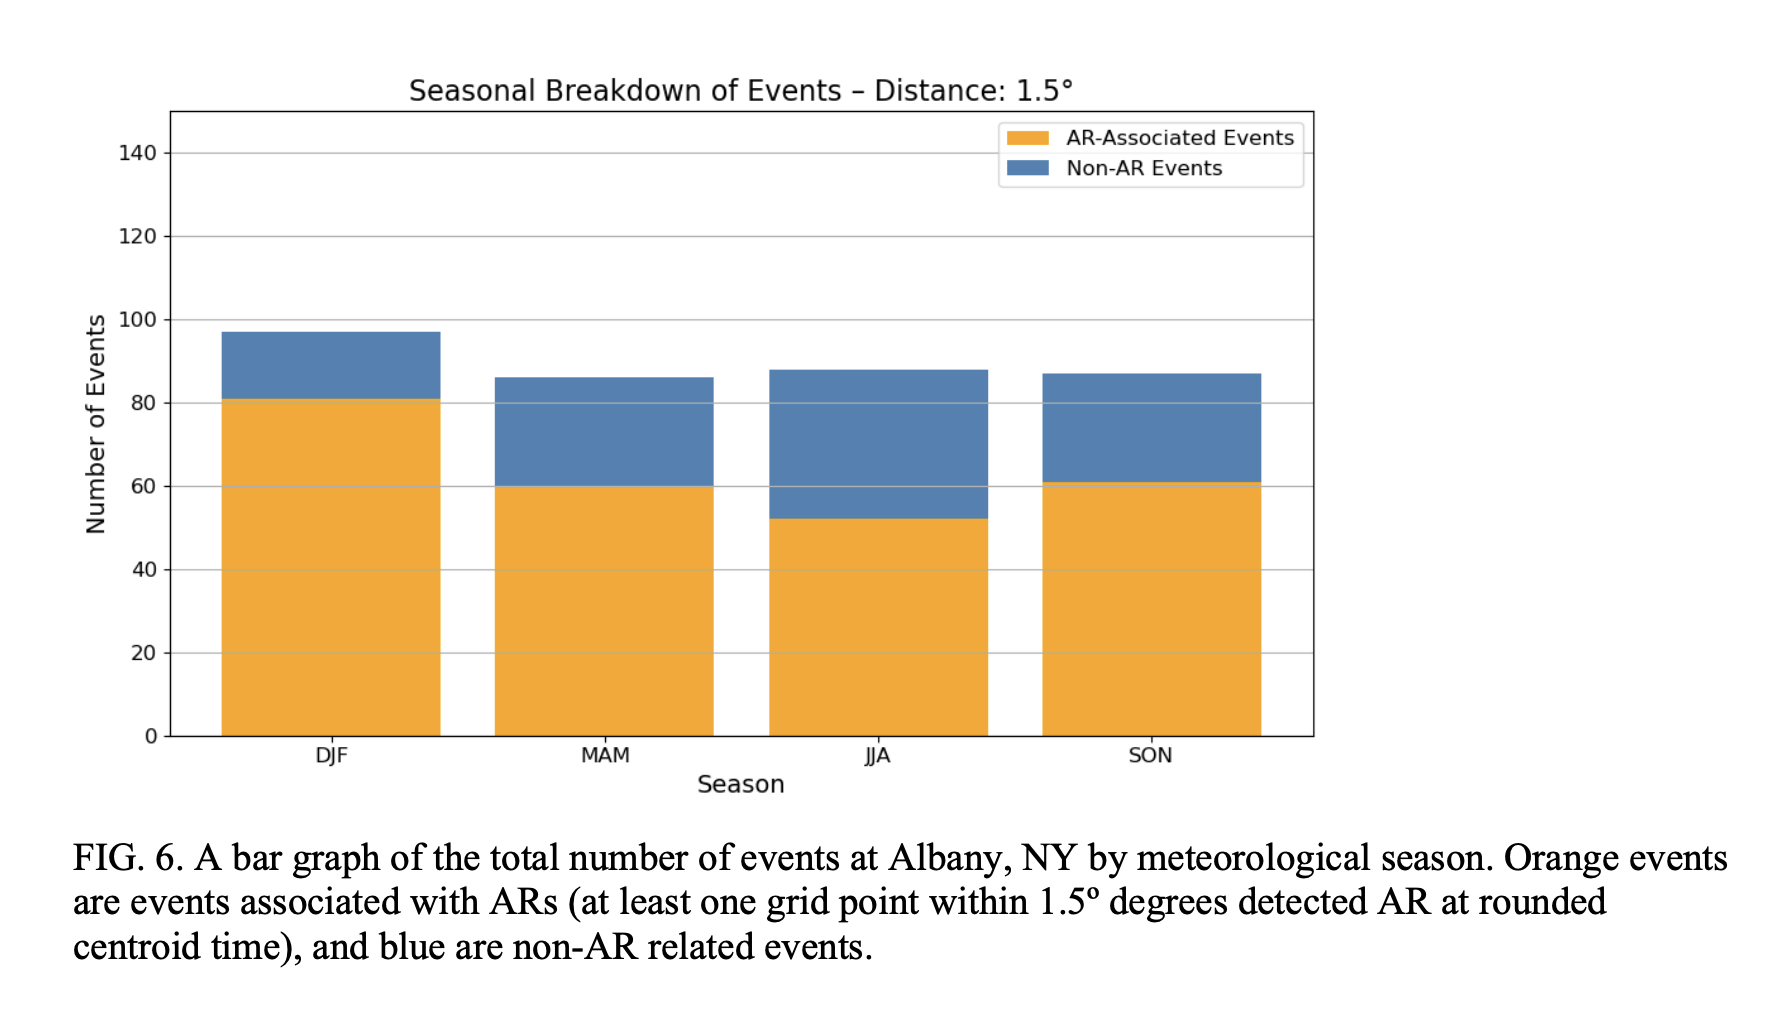
Figure 6:Figure 6
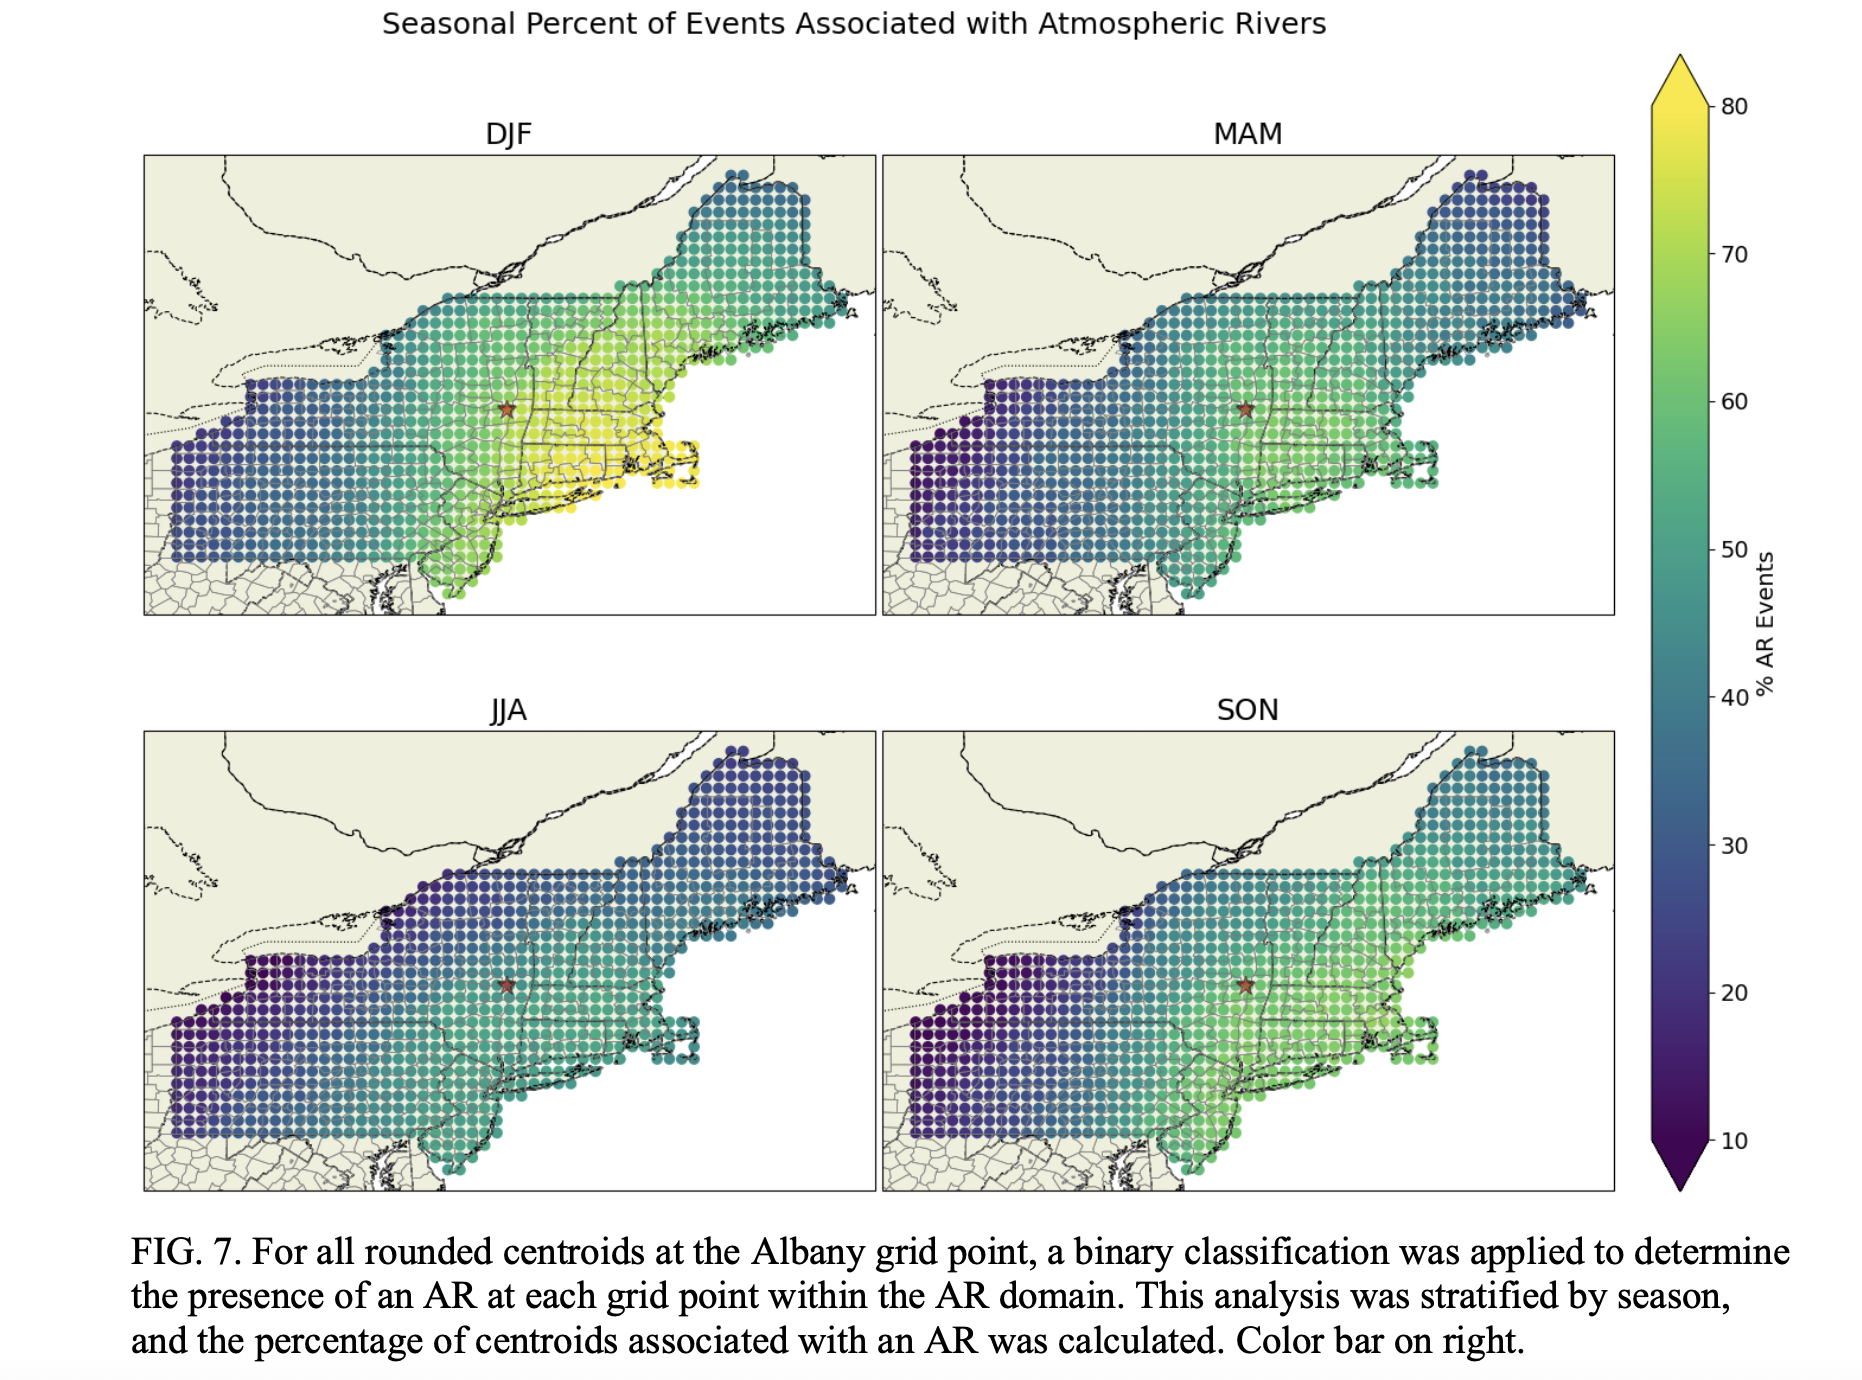
Figure 7:Figure 7
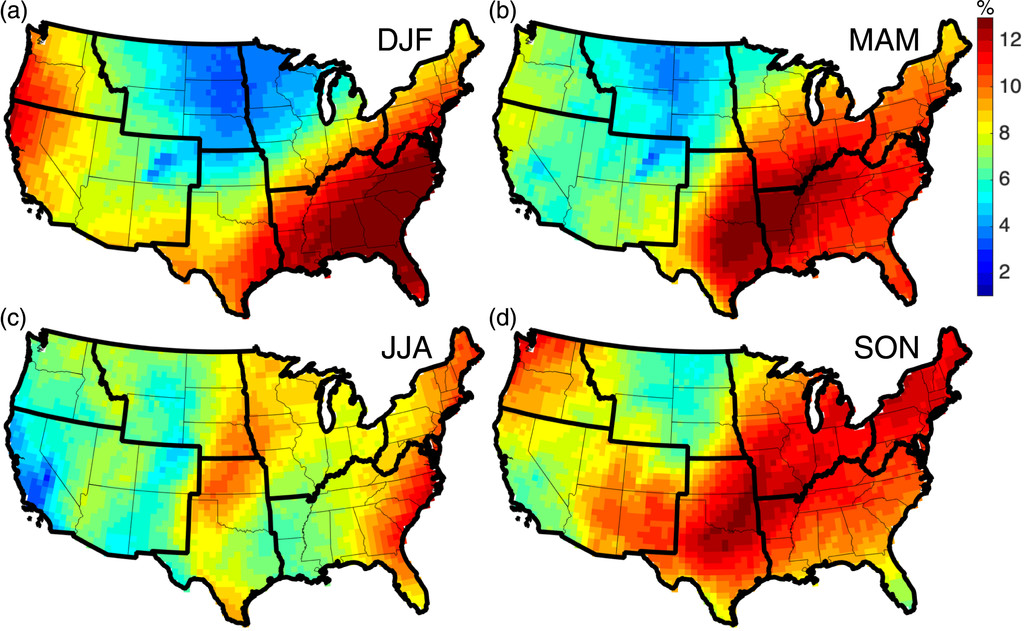
Figure 8:Slinsky et al. Fig 2
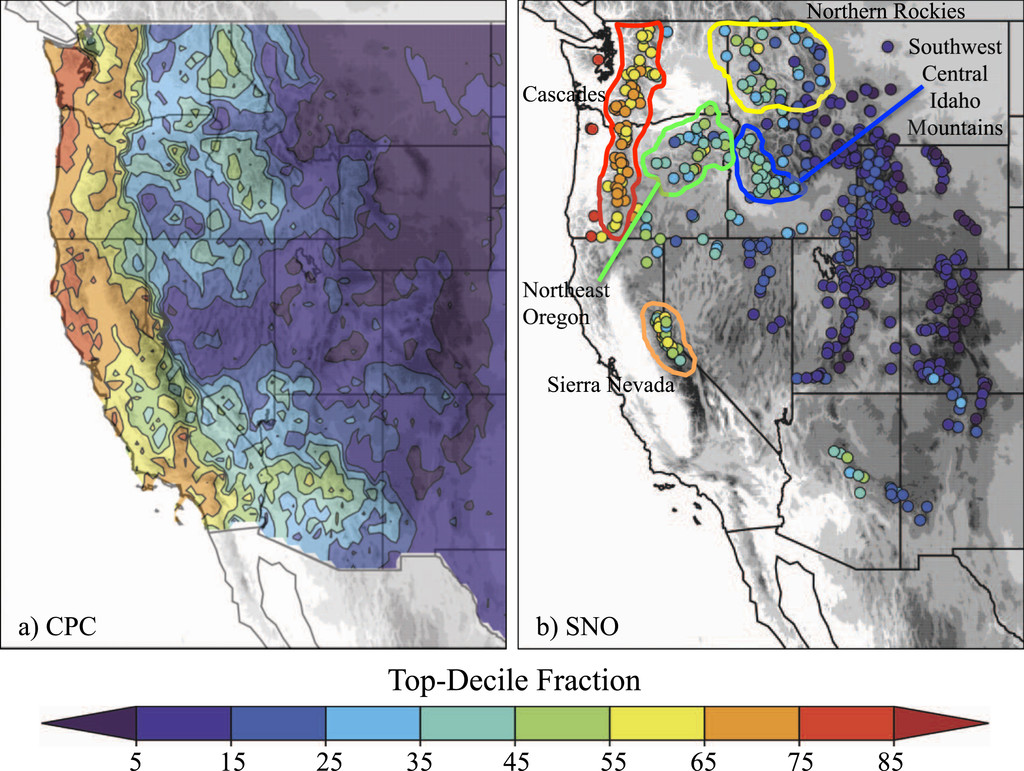
Figure 9:Rutz et al. Fig. 11
- Howarth, M. E., Thorncroft, C. D., & Bosart, L. F. (2019). Changes in Extreme Precipitation in the Northeast United States: 1979–2014. Journal of Hydrometeorology, 20(4), 673–689. 10.1175/JHM-D-18-0155.1
- Slinskey, E. A., Loikith, P. C., Waliser, D. E., Guan, B., & Martin, A. (2020). A Climatology of Atmospheric Rivers and Associated Precipitation for the Seven U.S. National Climate Assessment Regions. Journal of Hydrometeorology, 21(11), 2439–2456. 10.1175/JHM-D-20-0039.1
- Rutz, J. J., Steenburgh, W. J., & Ralph, F. M. (2014). Climatological Characteristics of Atmospheric Rivers and Their Inland Penetration over the Western United States. Monthly Weather Review, 142(2), 905–921. 10.1175/MWR-D-13-00168.1
- Doswell, C. A., Brooks, H. E., & Maddox, R. A. (1996). Flash flood forecasting: An ingredients-based methodology. Wea. Forecasting, 11, 560–581. https://doi.org/10.1175%2F1520-0434%281996%29011%3C0560%3AFFFAIB%3E2.0.CO%3B2
- Lamjiri, M. A., Dettinger, M. D., Ralph, F. M., & Guan, B. (2017). Hourly storm characteristics along the U.S. West Coast: Role of atmospheric rivers in extreme precipitation. Geophysical Research Letters, 44(13), 7020–7028. https://doi.org/10.1002/2017GL074193
- Guan, B., & Waliser, D. E. (2024). A regionally refined quarter-degree global atmospheric rivers database based on ERA5. Scientific Data, 11(1), 440. 10.1038/s41597-024-03258-4