Michael J. Dickinson*, Lance Bosart, Kristen Corbosiero, Susanna Hopsch, Kelly Lombardo, Matt Novak, Brandon Smith, and Alicia Wasula
Department of Earth and Atmospheric Sciences
The University at Albany/SUNY
1400 Washington Avenue
Albany, NY 12222
*Current Affiliation
Accurate Environmental Forecasting Inc.
165 Dean Knauss Drive
Narragansett, RI 02882
E-mail:mdickinson@accufore.com
Considerable attention has been given to the transition of tropical cyclones to extratropical cyclones in the recent literature. This process is referred to as extratropical transition (ET). A review of the literature reveals that ET occurs in the Atlantic, western Pacific, and Australian tropical cyclone basins. The only region to experience frequent tropical cyclones and not experience ET is the eastern Pacific. It has been argued that the synoptic- scale environment is not conducive to the ET process in this region. This work will show a bonafide example of an eastern Pacific ET event. The transitions of Hurricanes Lester and Andrew (1992) are examined using the 1.125 degree European Centre for Medium Range Weather Forecasting operational analyses.
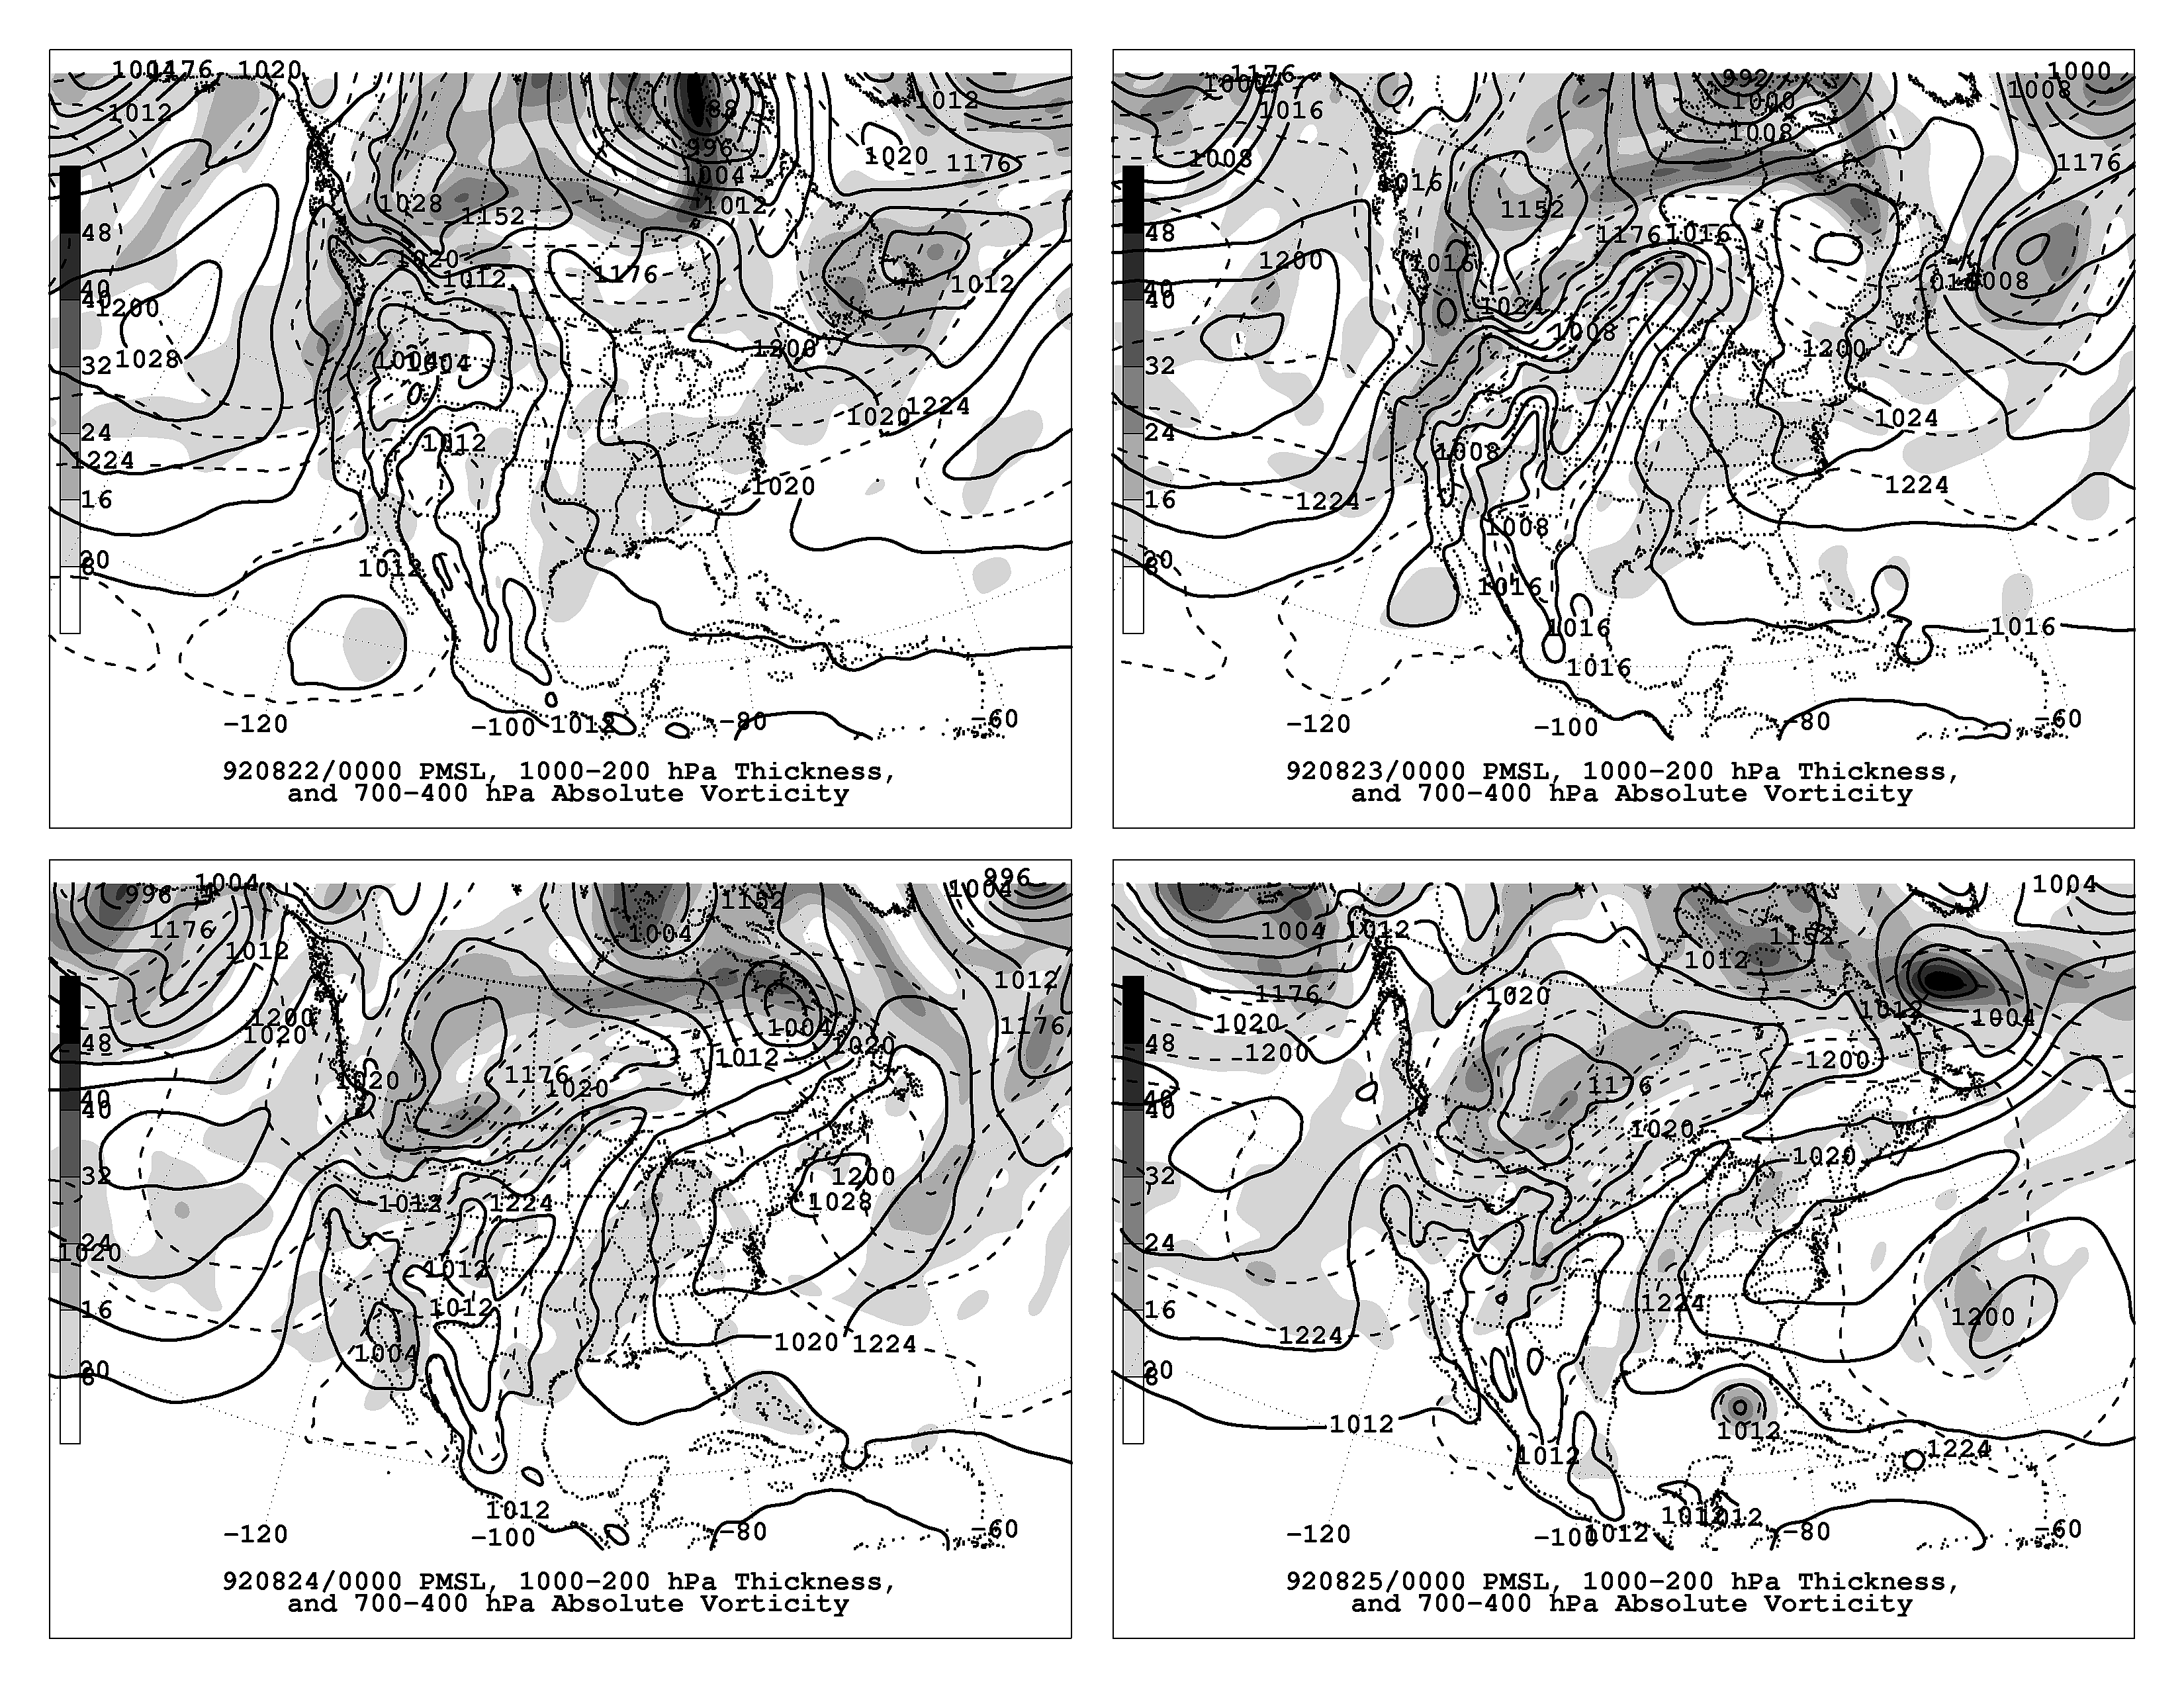
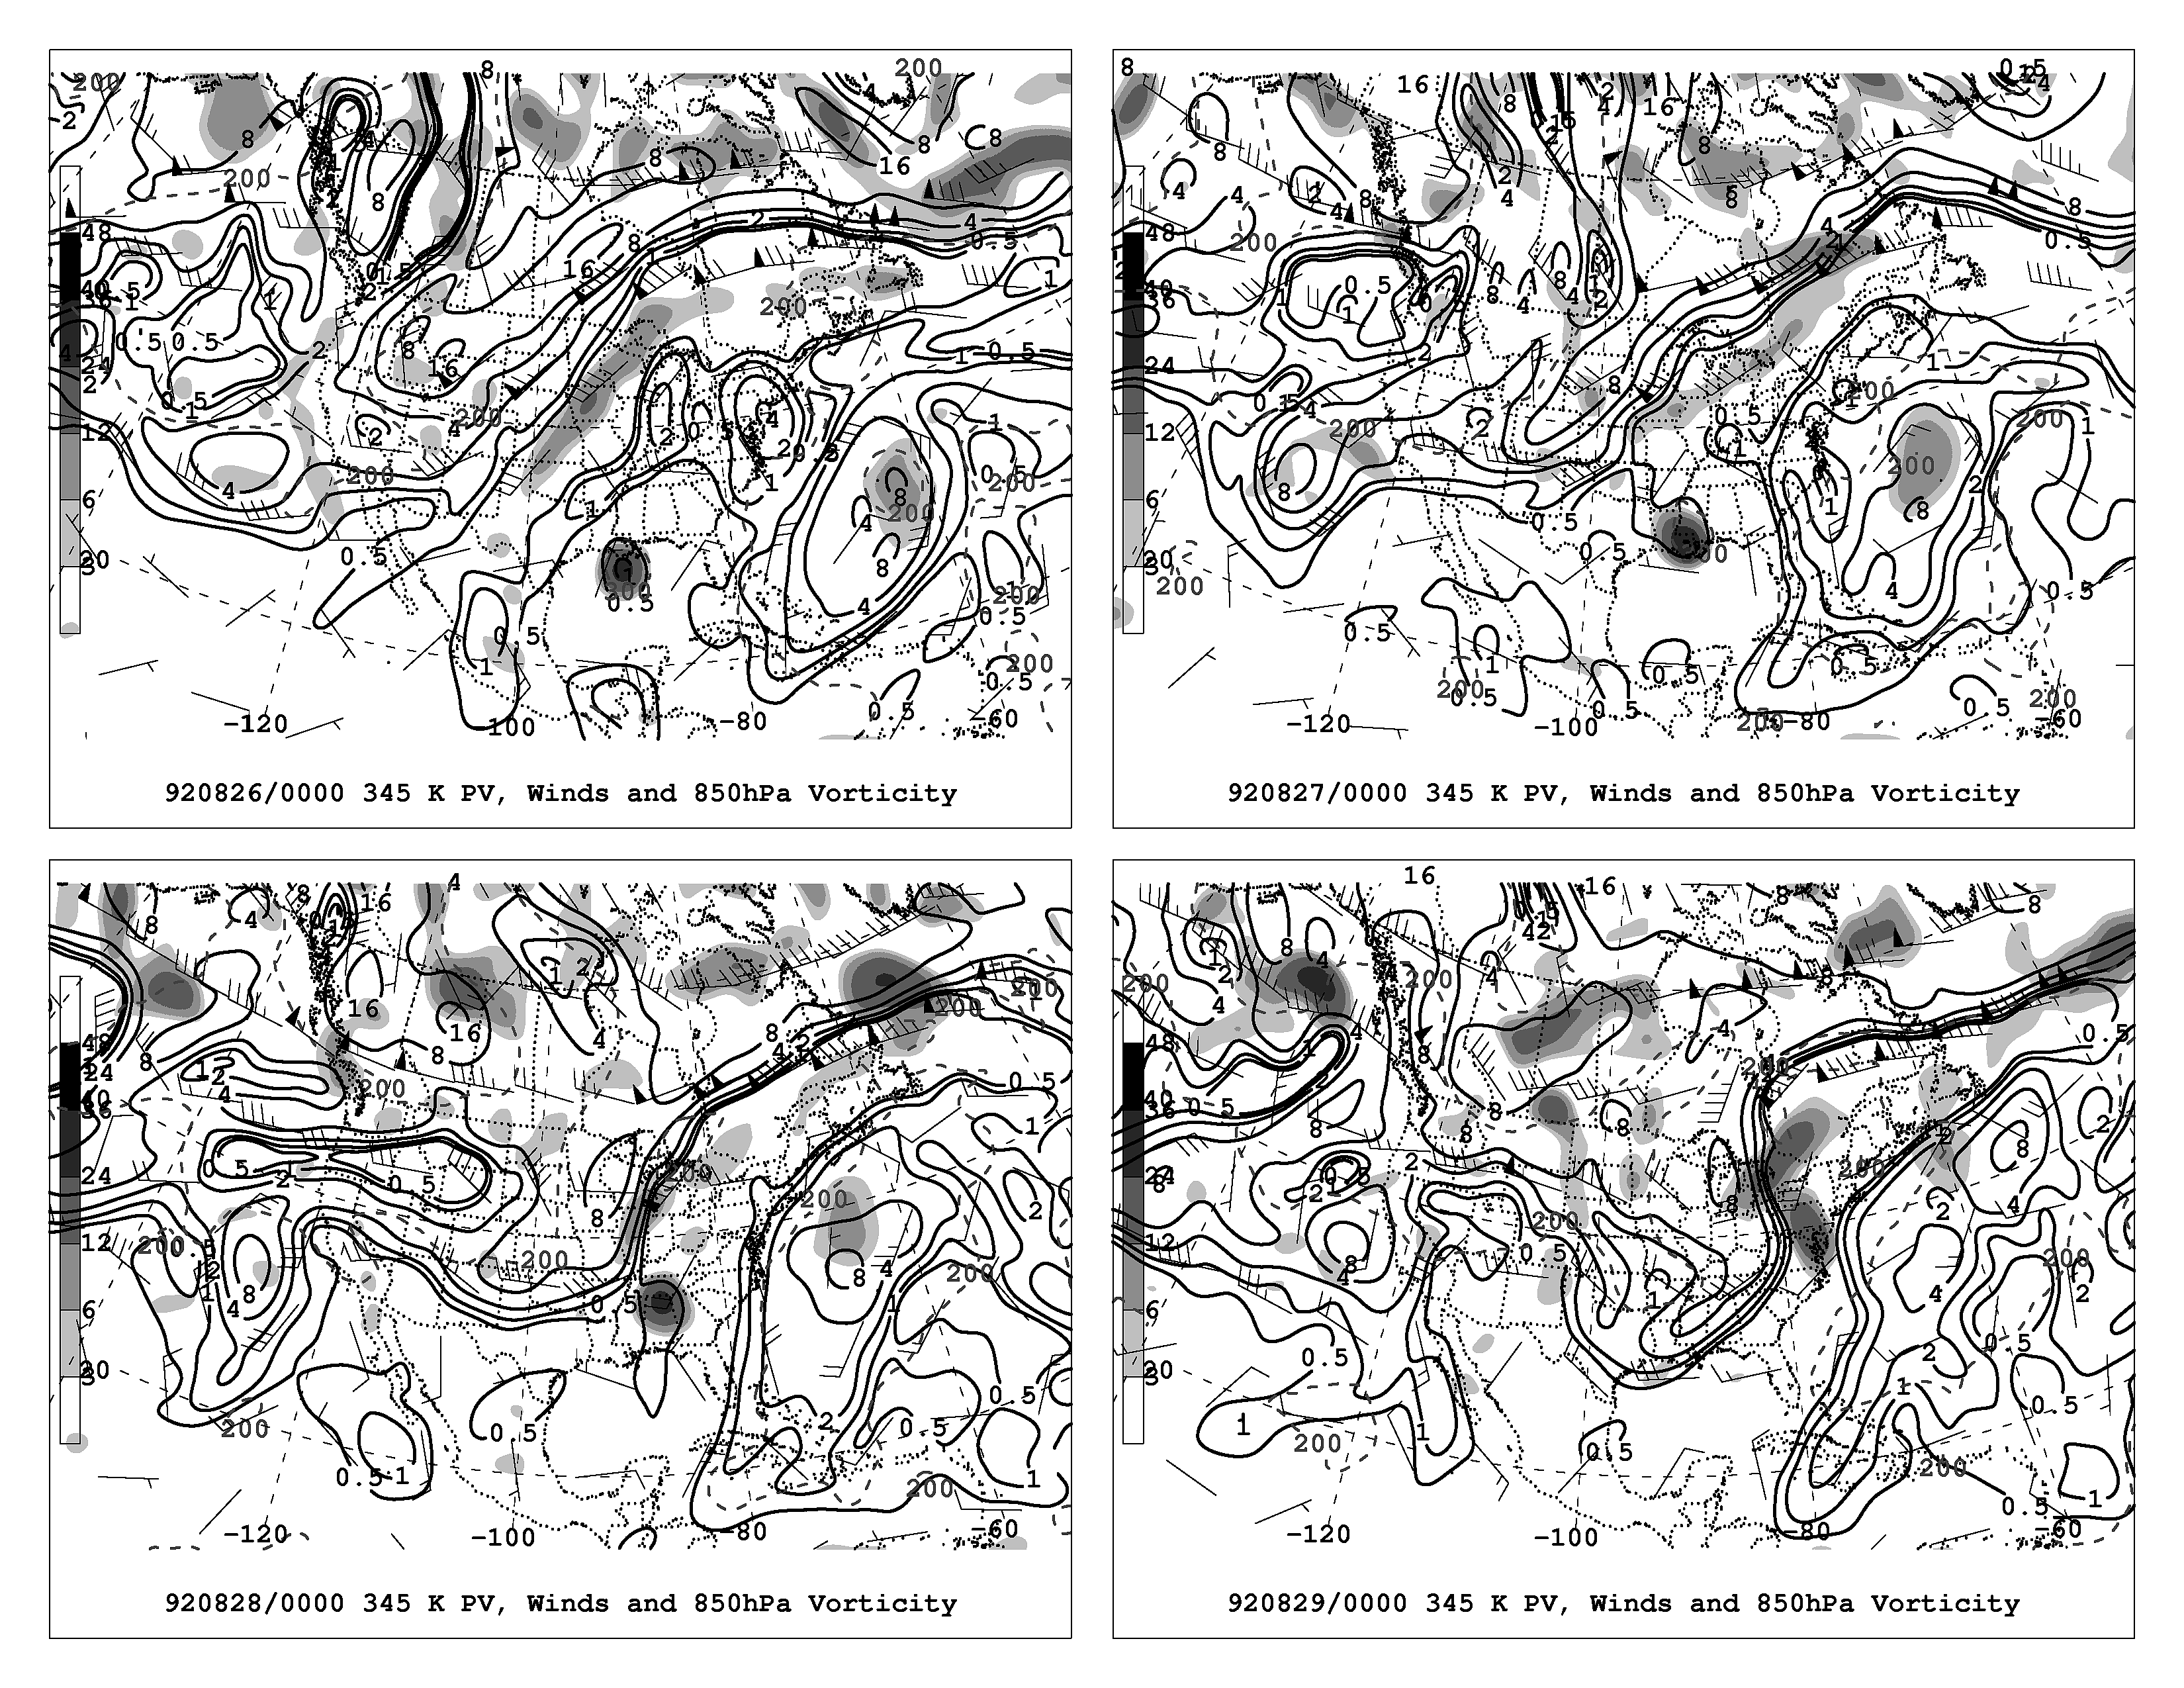
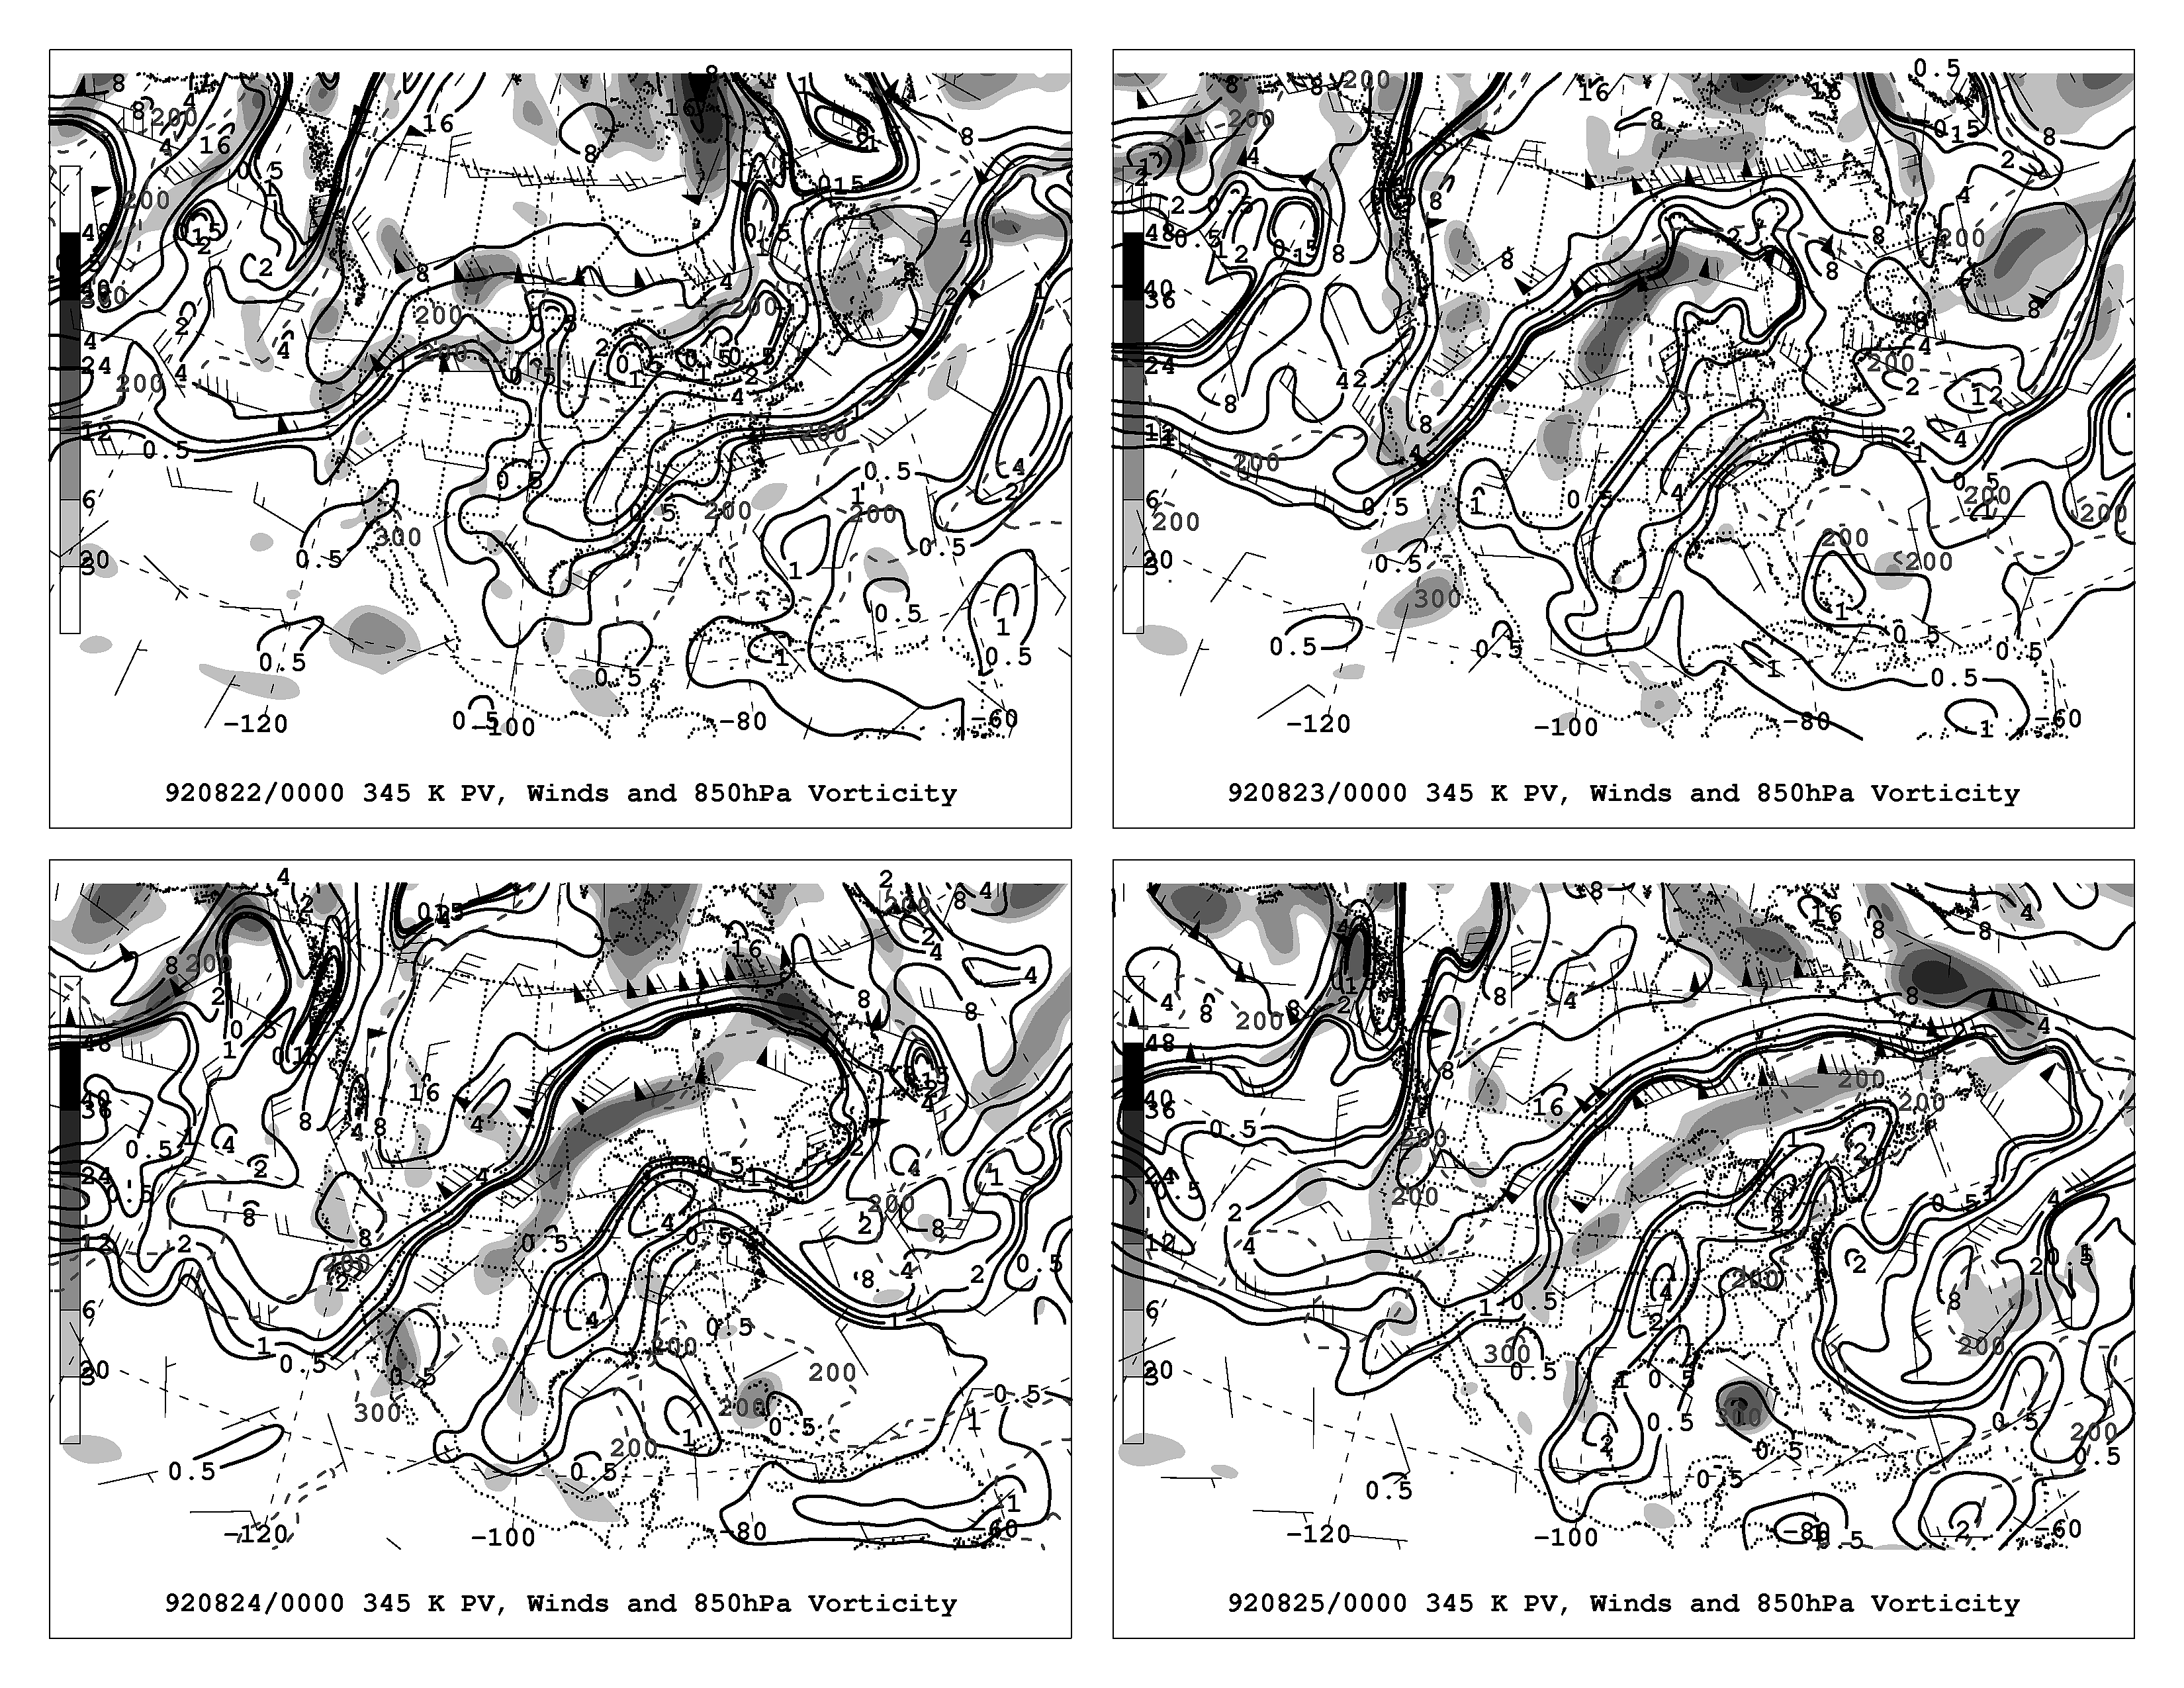
Figure 1 shows potential vorticity (solid contours, in potential vorticity units (PVU)), pressure (hPa, dashed contours) and winds on the 345 K surface. The shading represents cyclonic relative vorticity at 850 hPa. Hurricane Lester (1992) made landfall on the Baja Peninsula and northwestern Mexico near 0000 UTC 24 August ahead of a broad, synoptic-scale, positively tilted trough (Fig. 1 a-d). Transition occurred as Lester became embedded within the 1000-200 hPa thickness gradient (Fig. 2a-d), indicating that Lester no longer maintained an isolated warm core structure. The Lester circulation continued to move north-northeastward ahead of the approaching trough and helped build the downstream ridge. While the remnants of Lester did not reintensify, the ET process resulted in considerable precipitation (in excess of 60 mm) from Arizona/New Mexico, northeastward through Colorado and Nebraska.
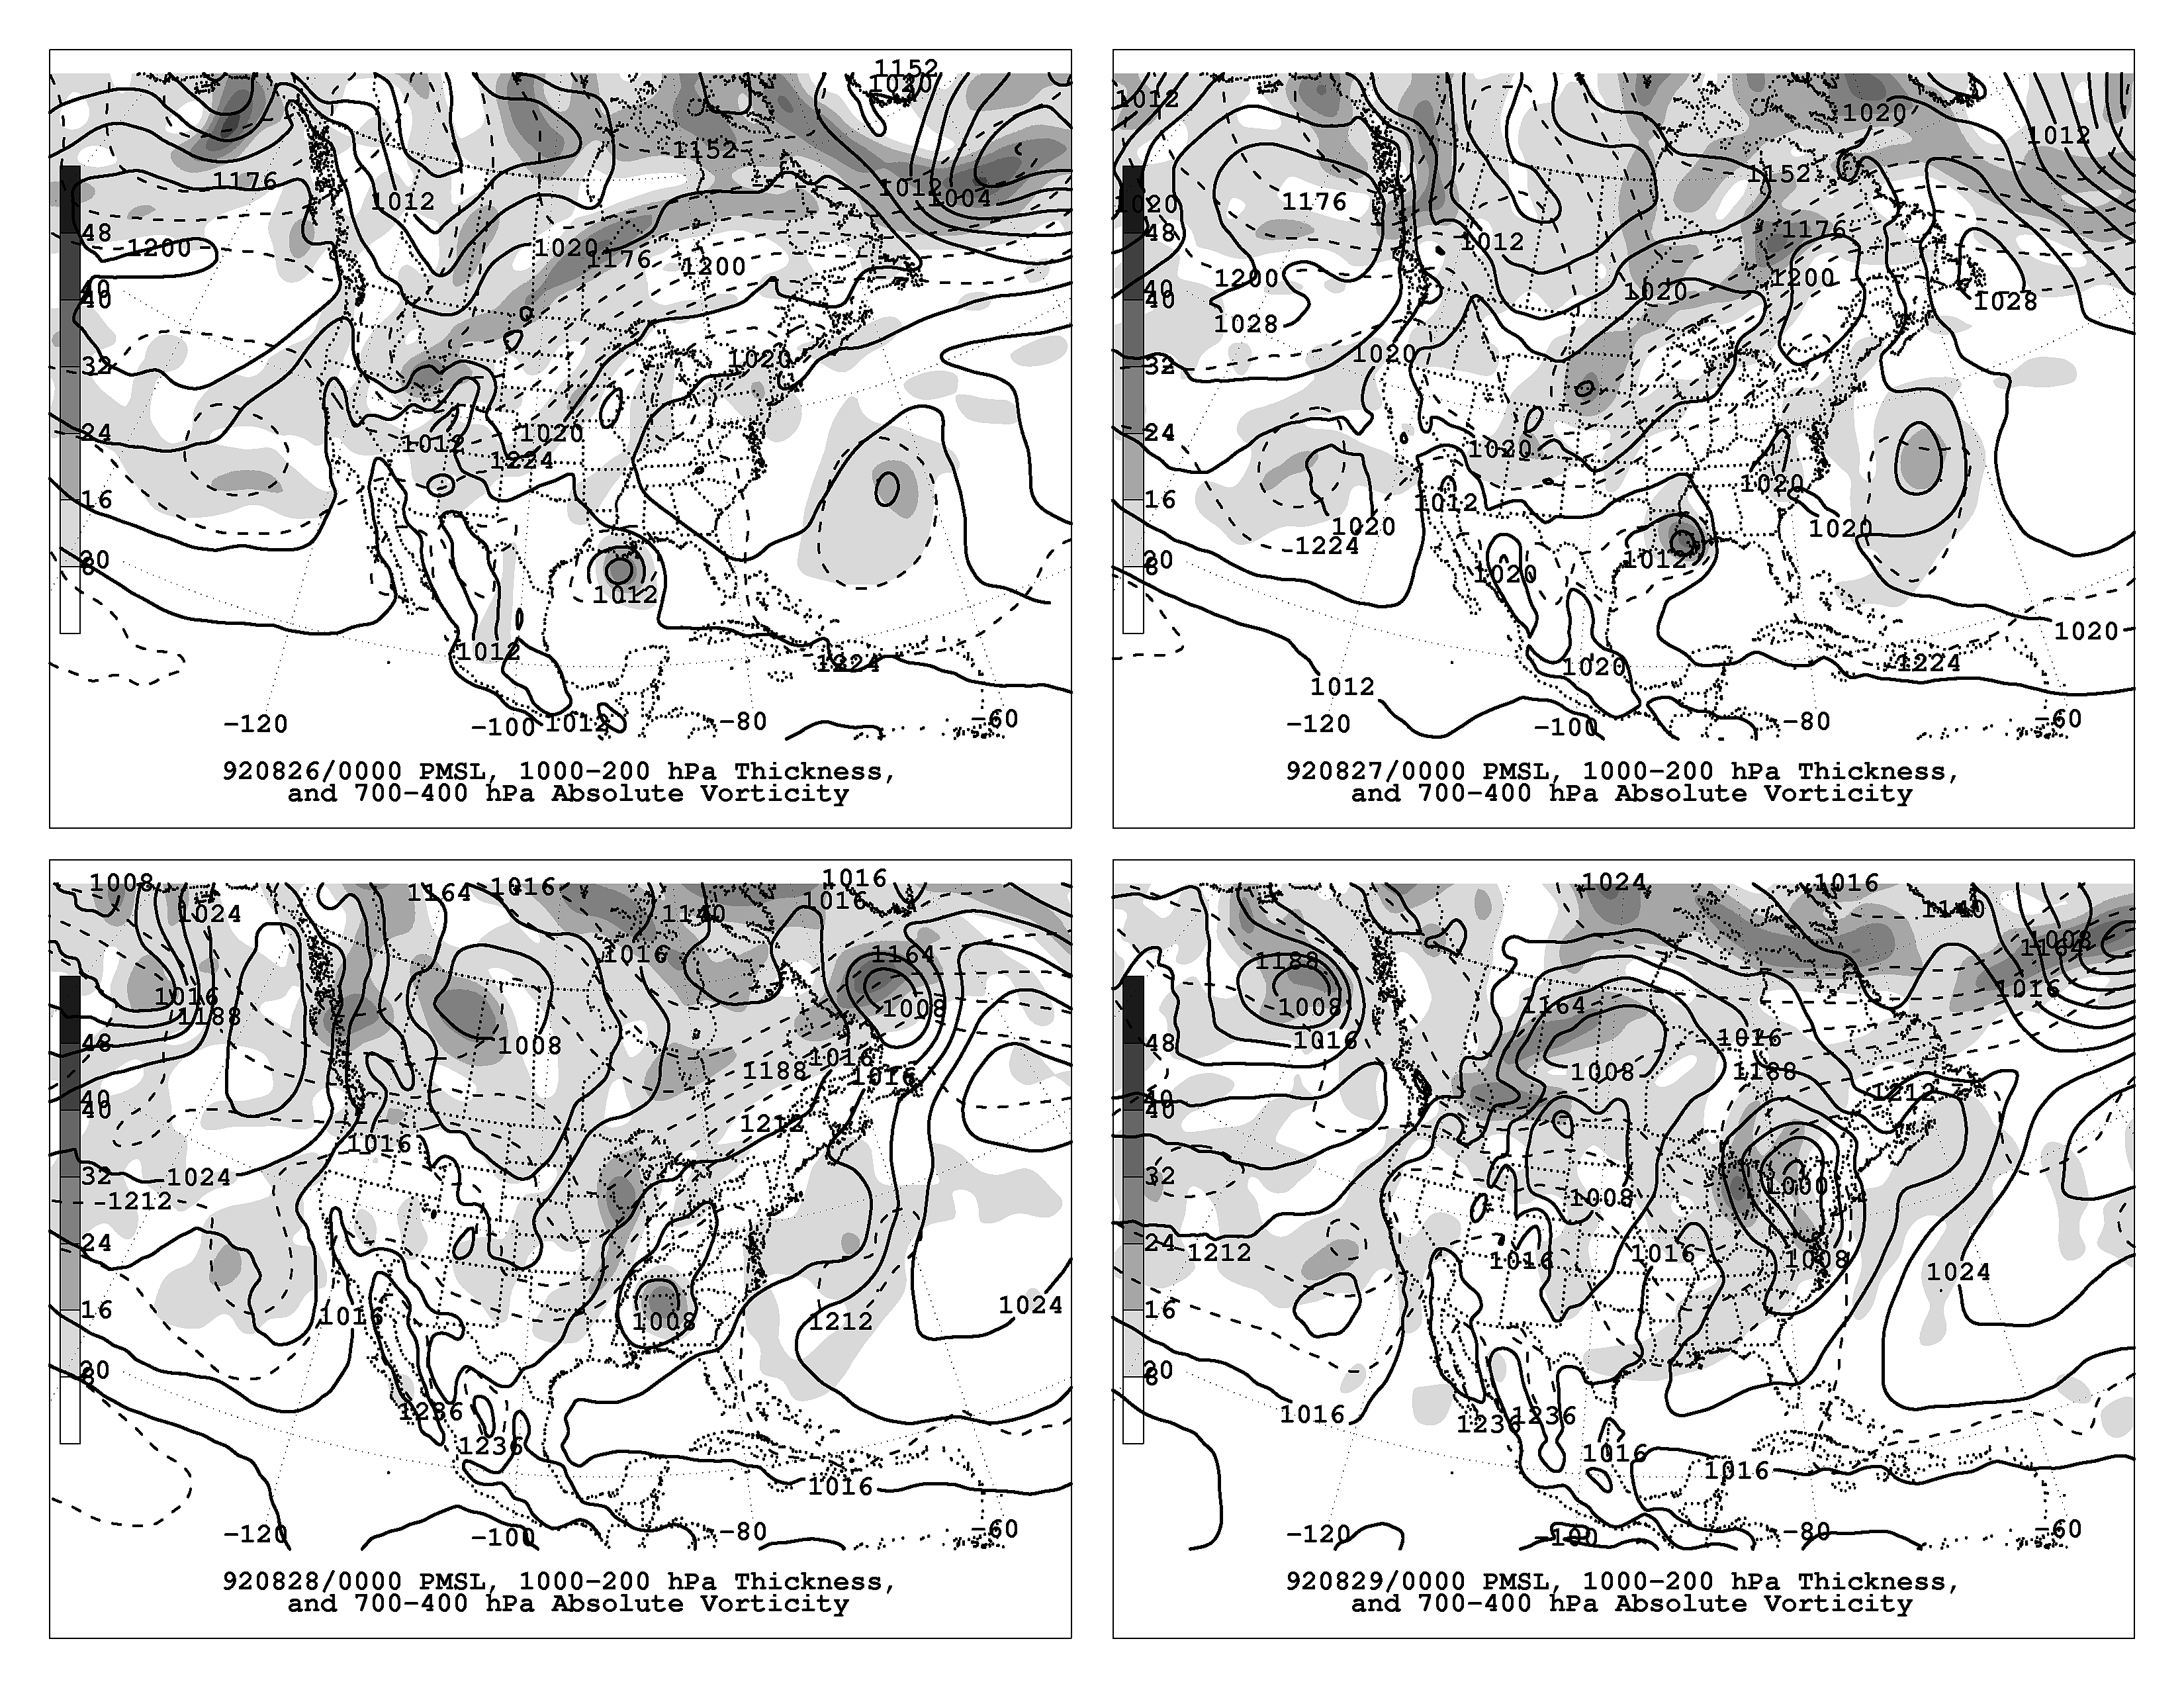
The trough continued eastward where it then interacted with Hurricane Andrew over the southeastern US by 0000 UTC 28 August (Fig. 1e-h). It is unclear, however, if Andrew underwent the "classic" transition process. Cyclogenesis associated with the approaching trough occurs west of the Great Lakes by 0000 UTC 28 August, poleward of the Andrew circulation. This "traditional" cyclogenesis becomes the primary event as the remnants of Andrew remain displaced to the southeast (Fig. 1g,h and 2 g,h). Andrew remains on the warm side of the thickness gradient by 0000 UTC 29 August (Fig. 2h). Additional diagnosis is required to better ascertain the contribution of Andrew in this event.
One of the interesting aspects of this study is that one trough was responsible for the potential transition of two storms. The upscale effects of the ET process were considerably different in each case. The difference in low- level and upscale responses to each transition suggests that there are many flavors of ET.
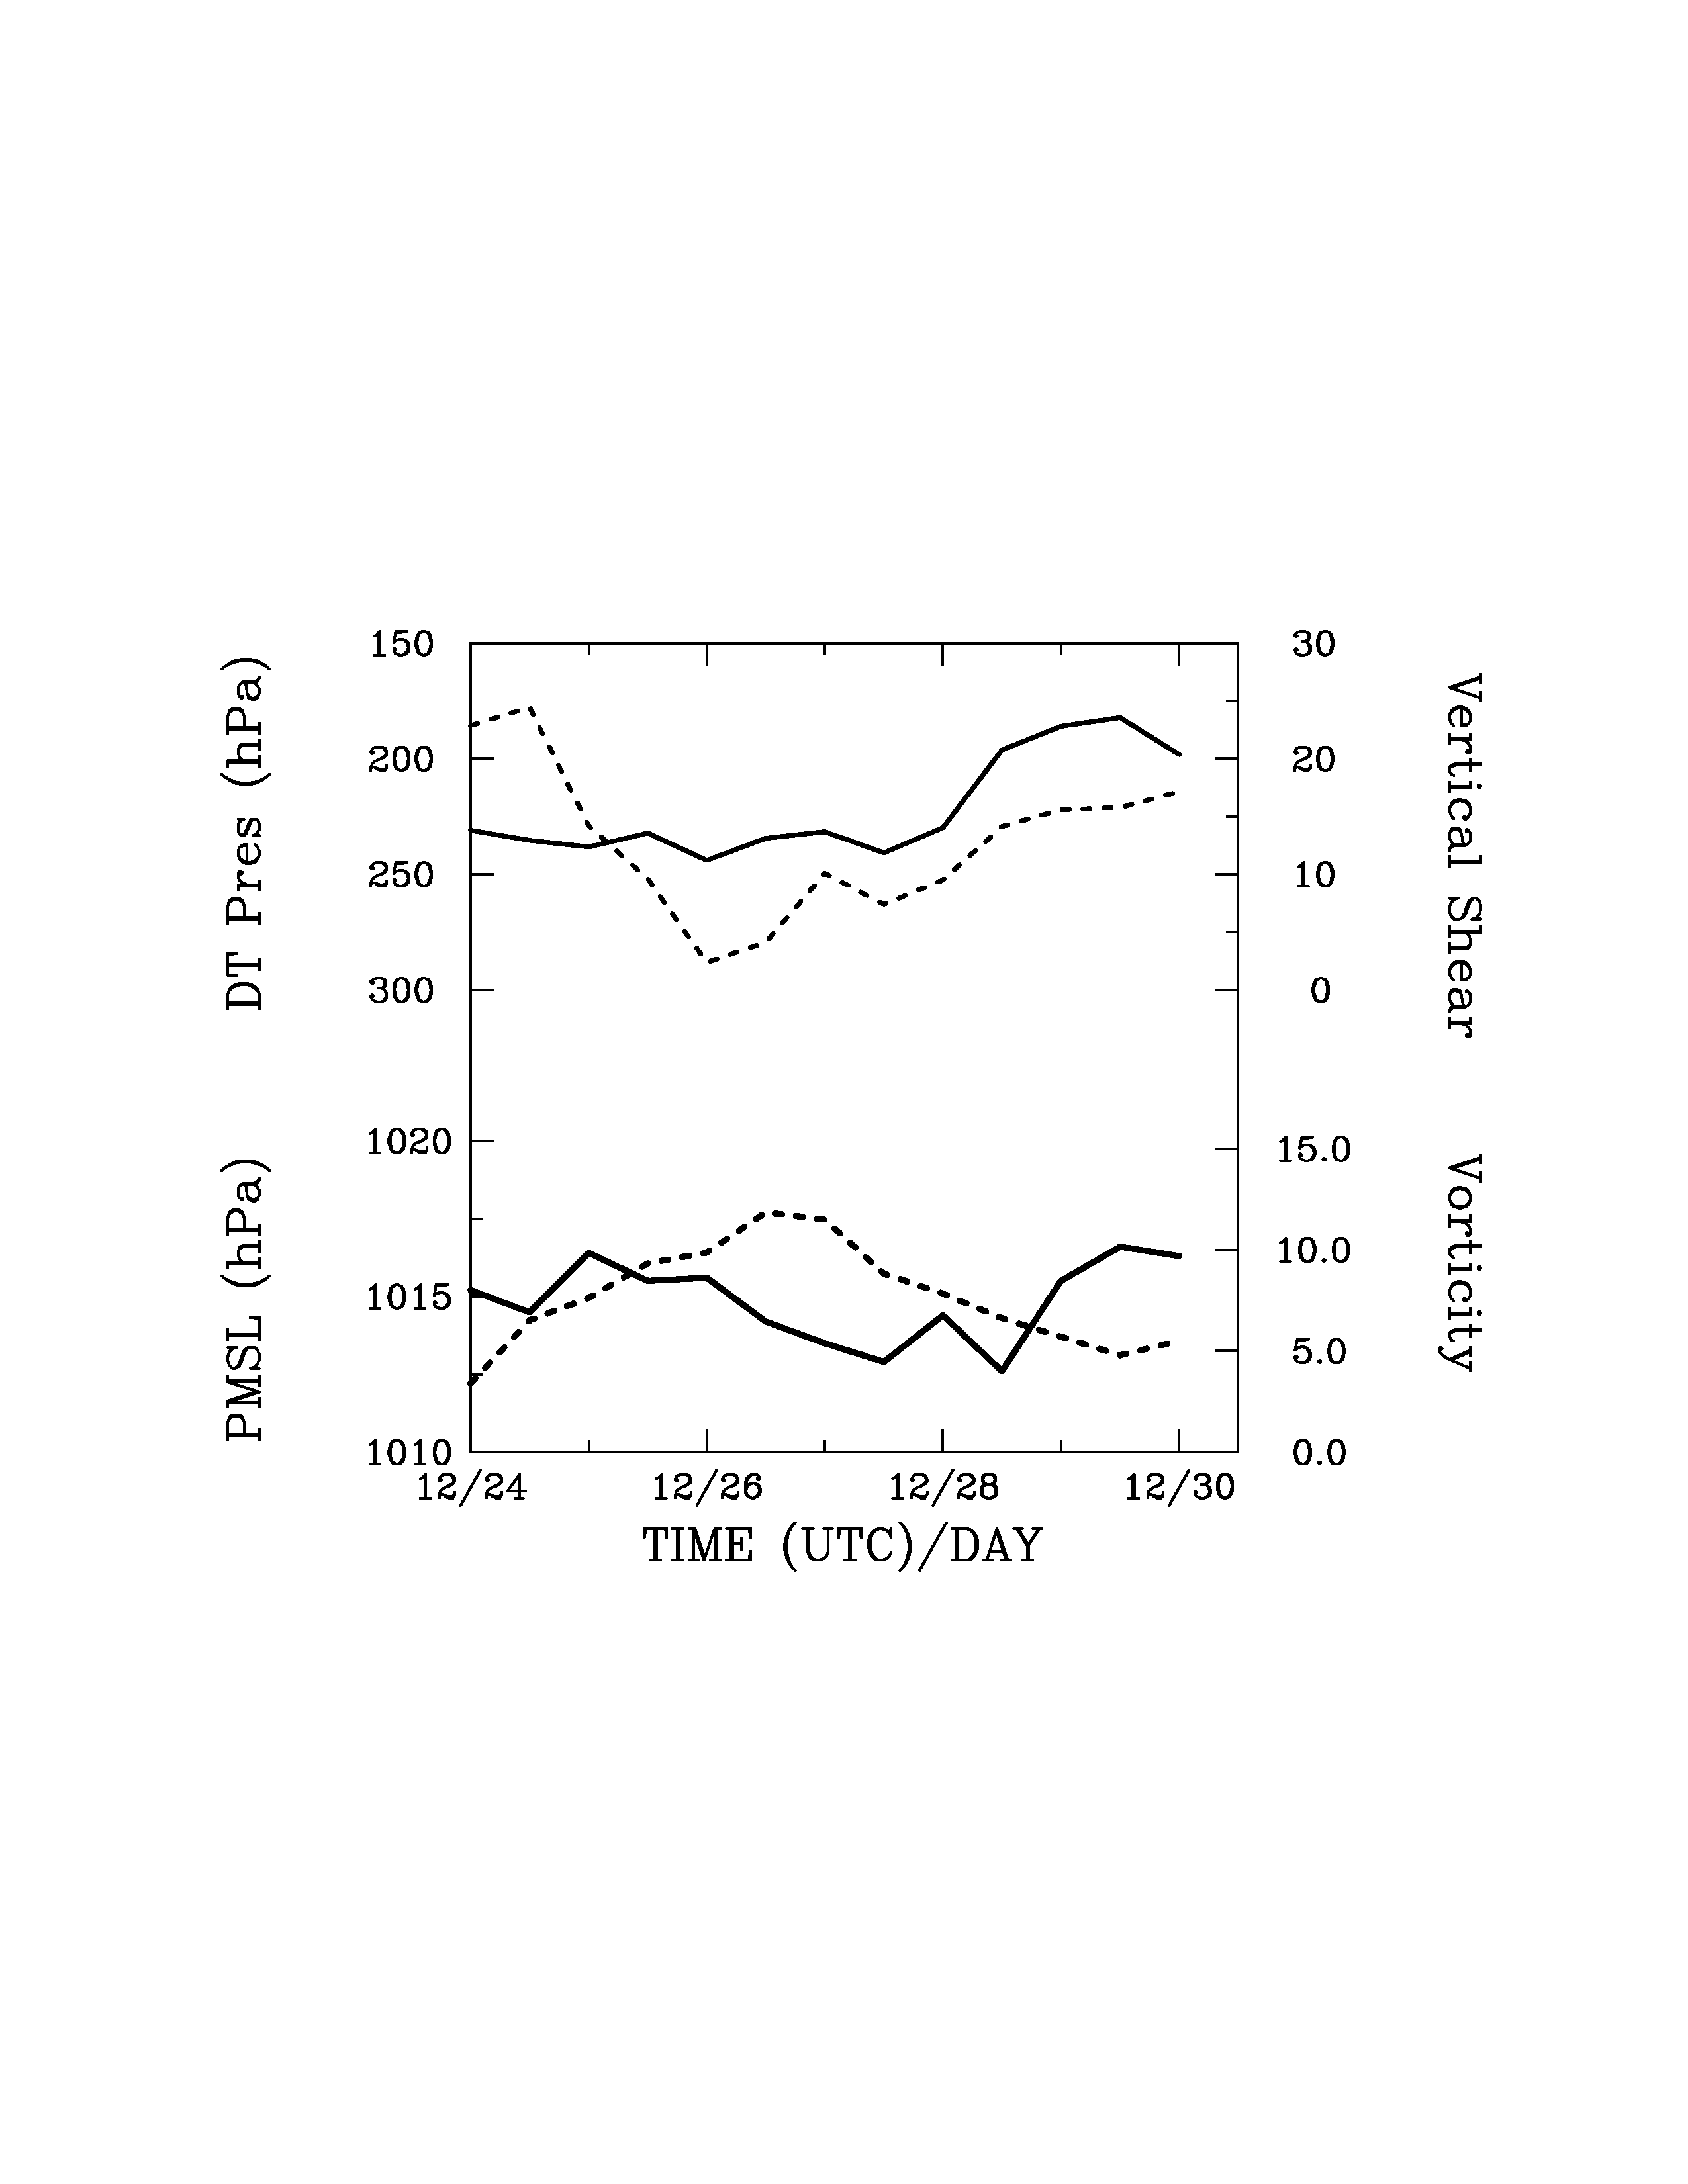
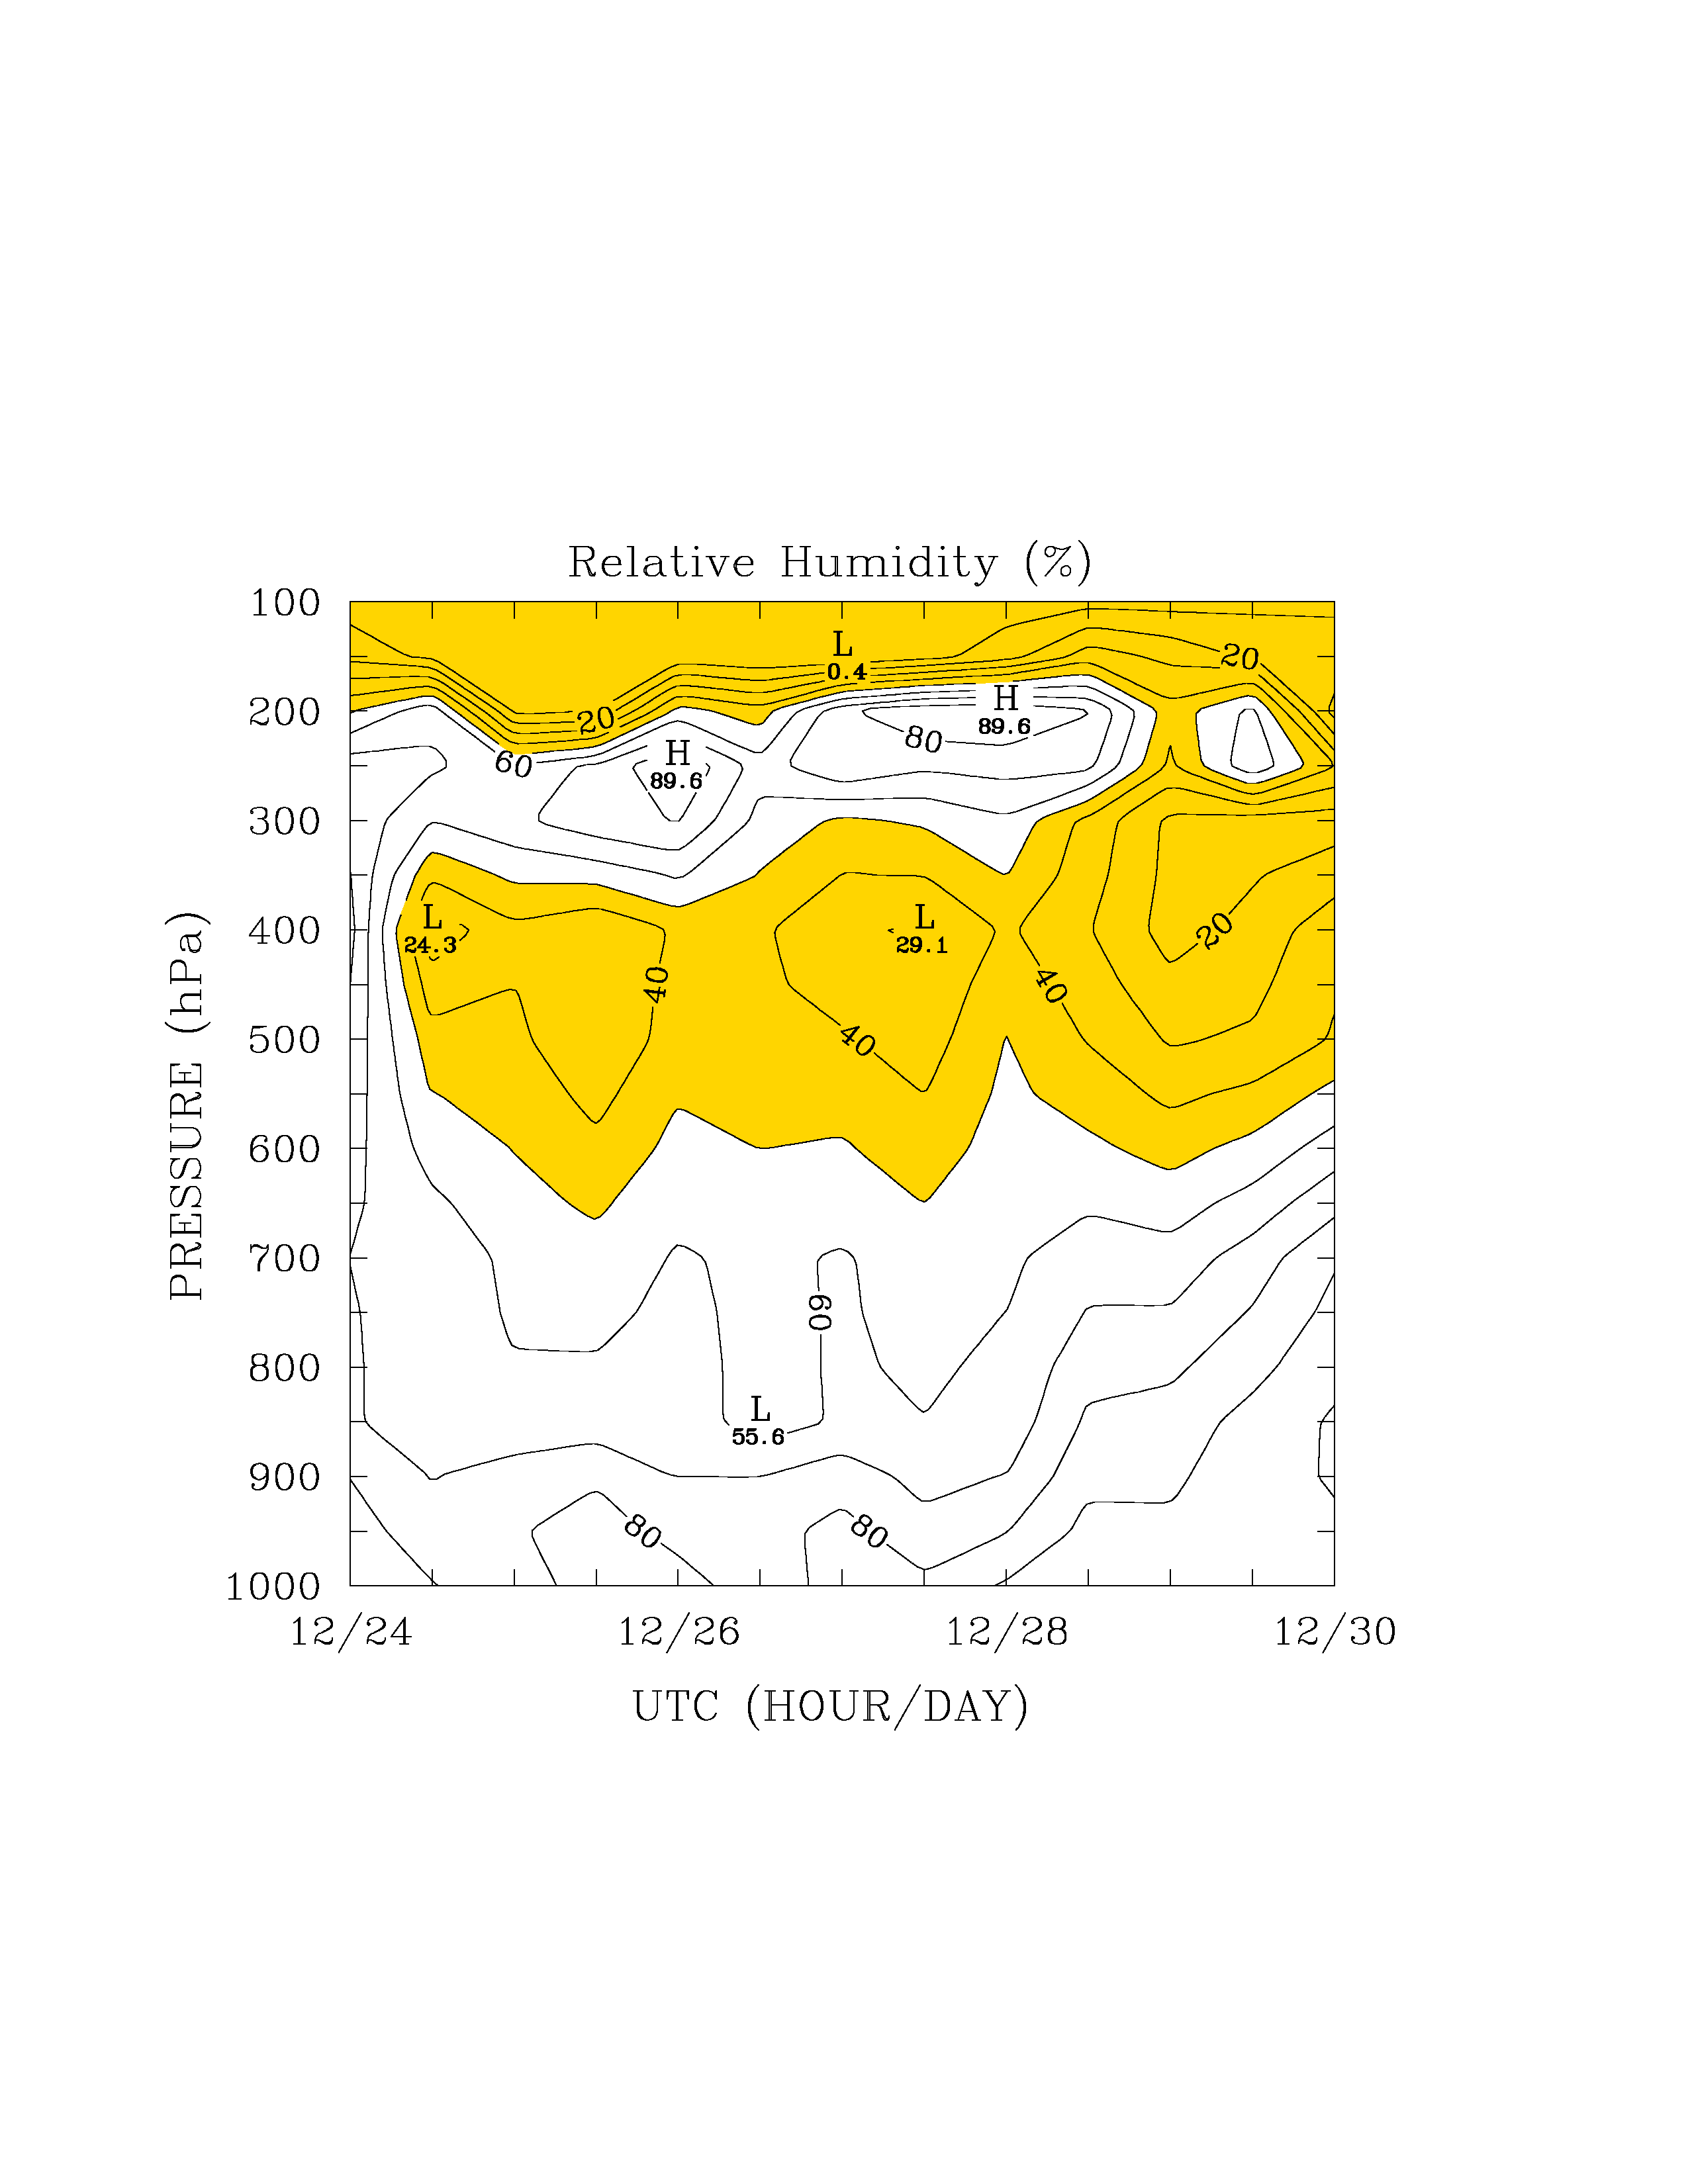
Another noteworthy event during this period occurred over the western Atlantic. An examination of Fig. 1 shows a PV filamentation and fracture near Bermuda beginning around 0000 UTC 24 August. This wave breaking event was associated with the development of the fold over ridge over the central US. The building of this ridge was assisted by the diabatic heating associated with both Lester and Andrew. Low-level cyclonic vorticity develops in response to the positive PV anomaly near Bermuda by 0000 UTC 25 August (Fig. 1d). Figure 3 shows a time series of the 850-200 hPa vertical wind shear (top, dashed) and the pressure on the dynamic tropopause (defined as the 1.5 PVU surface, solid) averaged 500 km around the storm center. While the low-level disturbance remained underneath the positive PV anomaly (higher P on the dynamic tropopause), the vertical wind shear weakened to below 10 m/s over the layer. The lower curves in Fig. 3 show the mean sea-level pressure (PMSL, solid) and 850 hPa relative vorticity (dashed). During the period of weak shear there was some reduction in PMSL and weak growth in relative vorticity. Yet, tropical cyclogenesis did not ensue. Figure 4 shows a time-pressure cross-section of relative humidity (RH) following the 850 hPa relative vorticity center. Clearly the presence of dry air (values of RH < 50%) at midlevels prevents tropical development, despite the presence of favorable vertical wind shear.