UAlbany HWRF Real-Time SHOUT Sensitivities & Target LocationsRyan D. Torn, Zhan Zhang, Vijay Tallapragada |
UAlbany HWRF Real-Time SHOUT Sensitivities & Target LocationsRyan D. Torn, Zhan Zhang, Vijay Tallapragada |
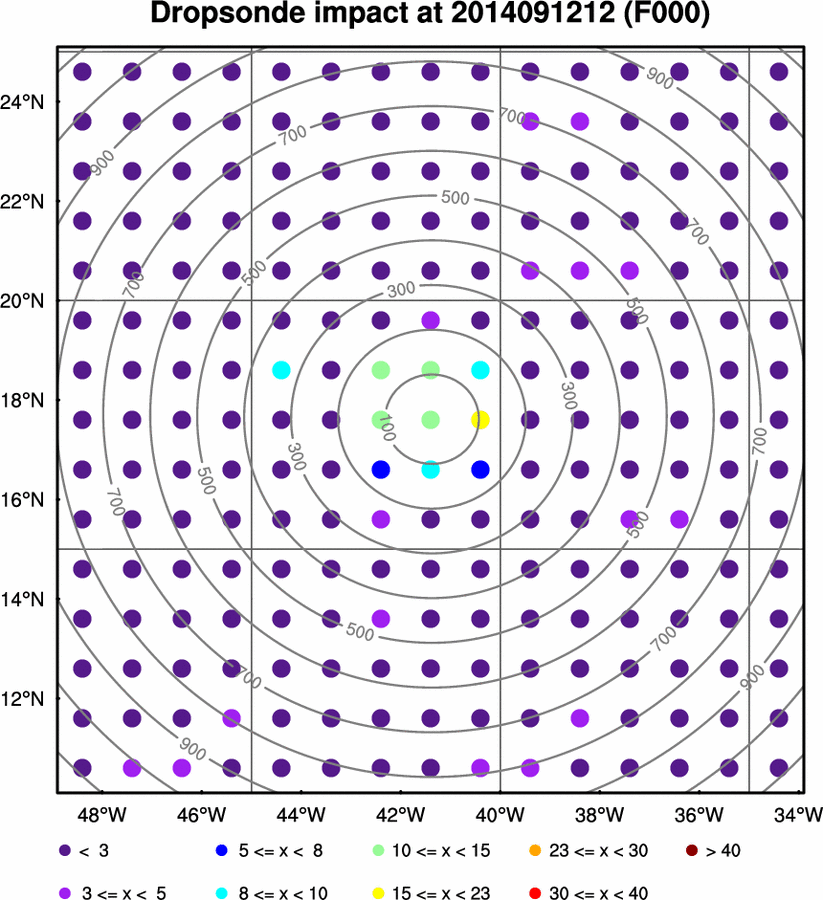
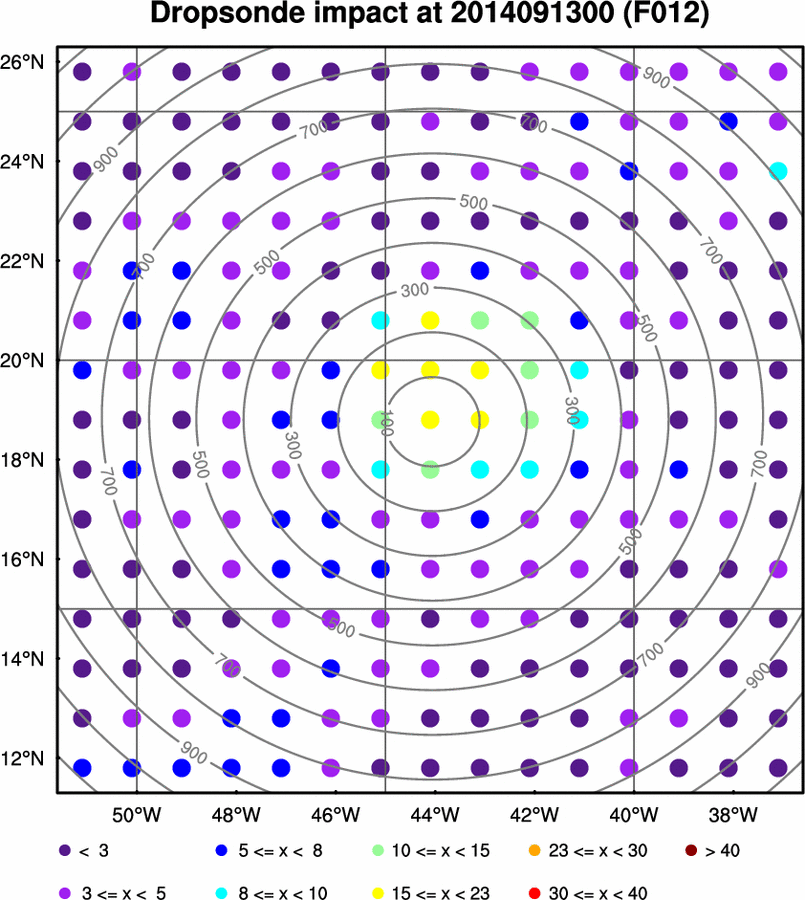
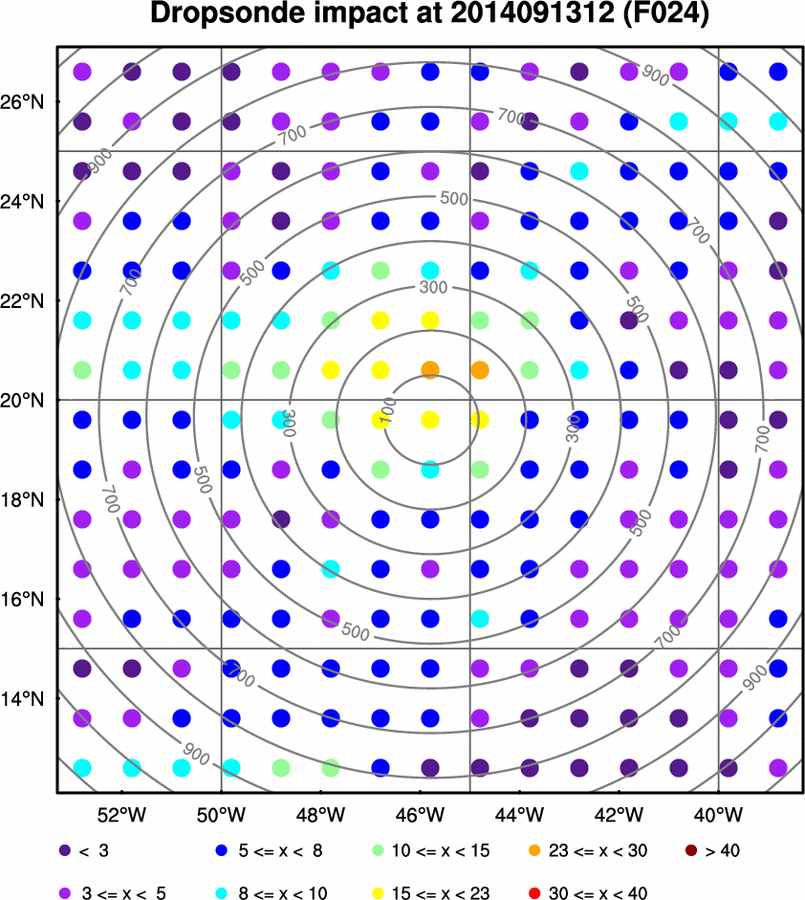
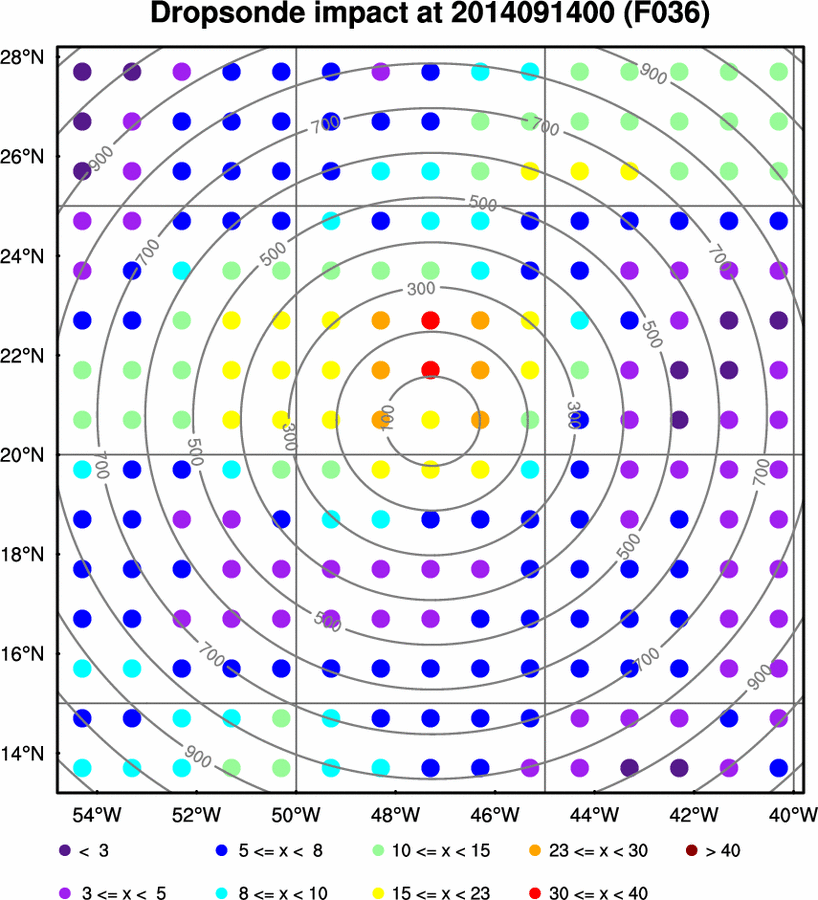
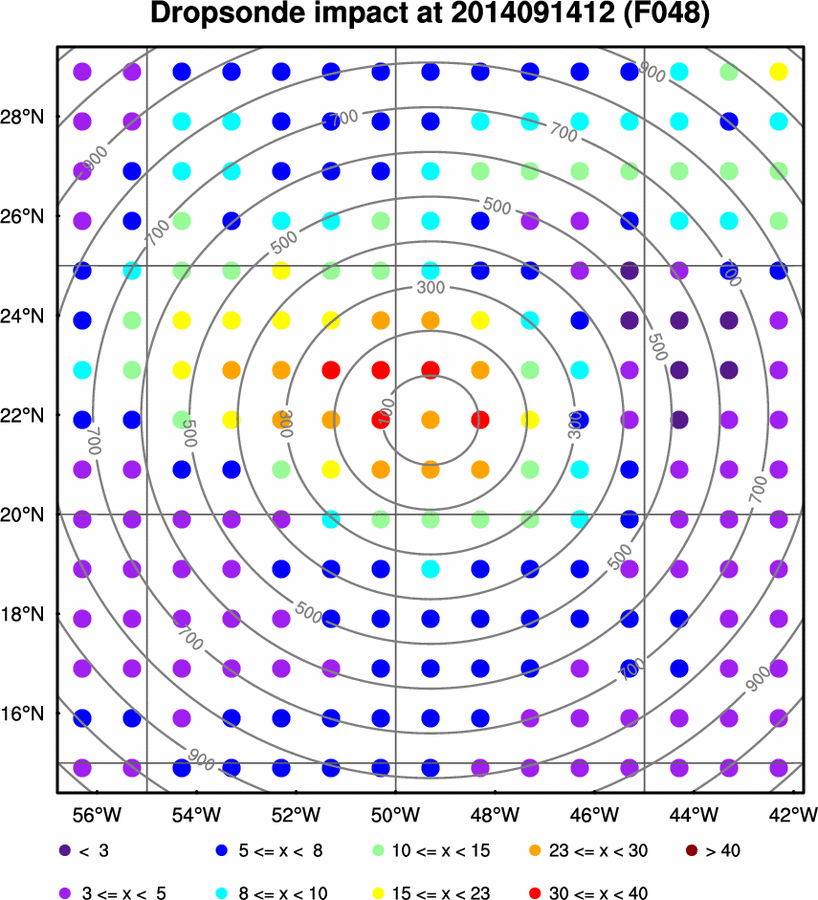
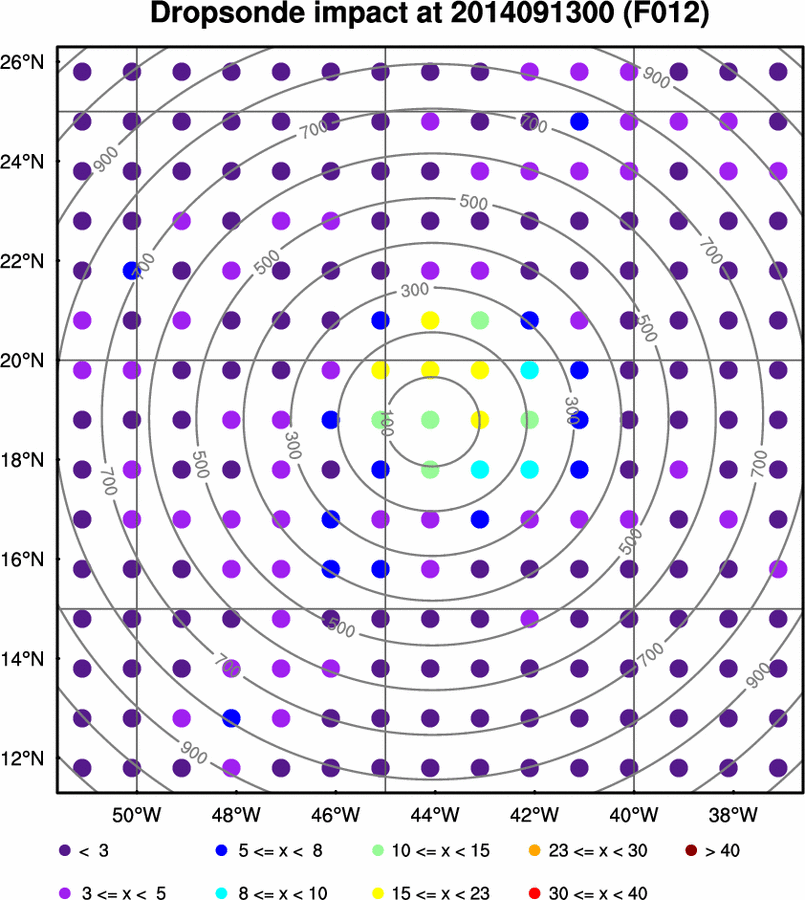
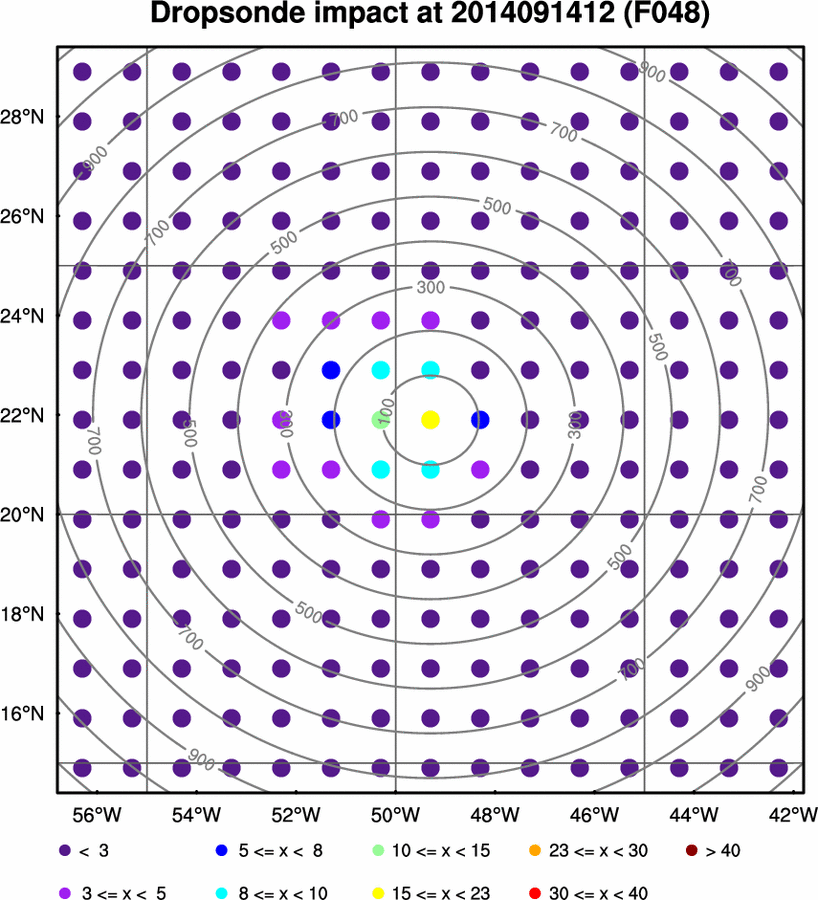
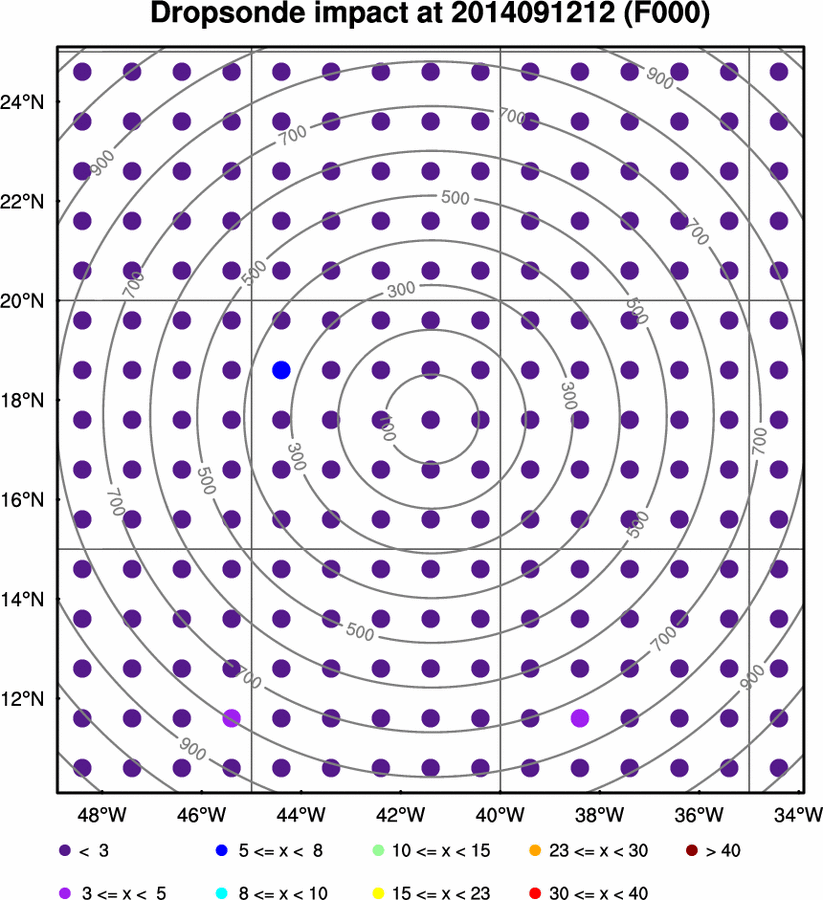
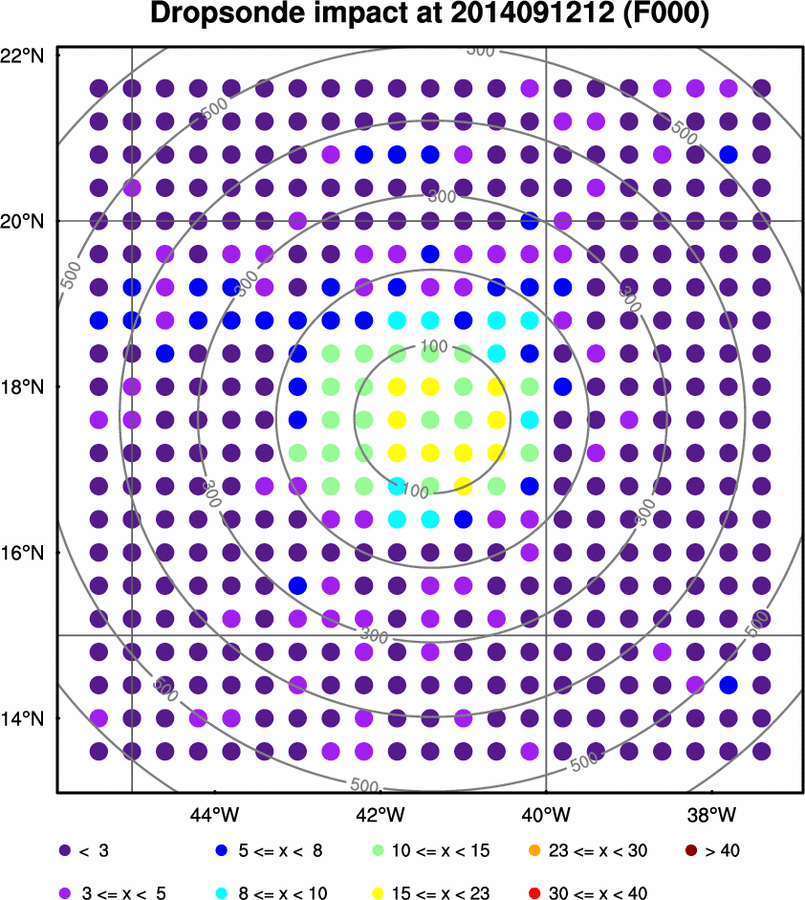
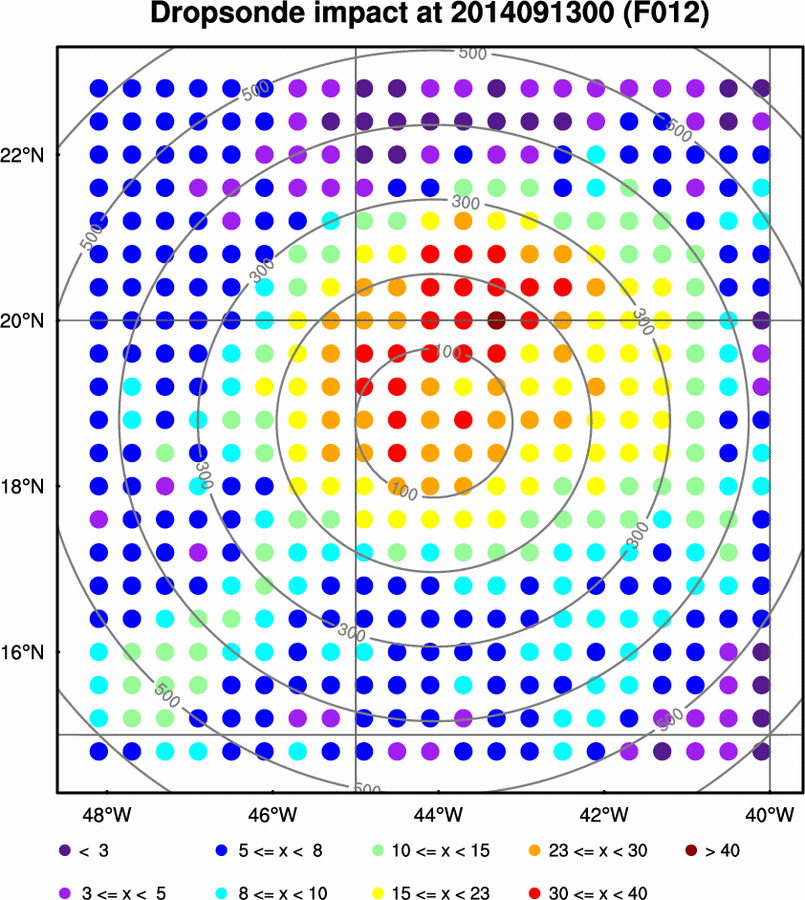
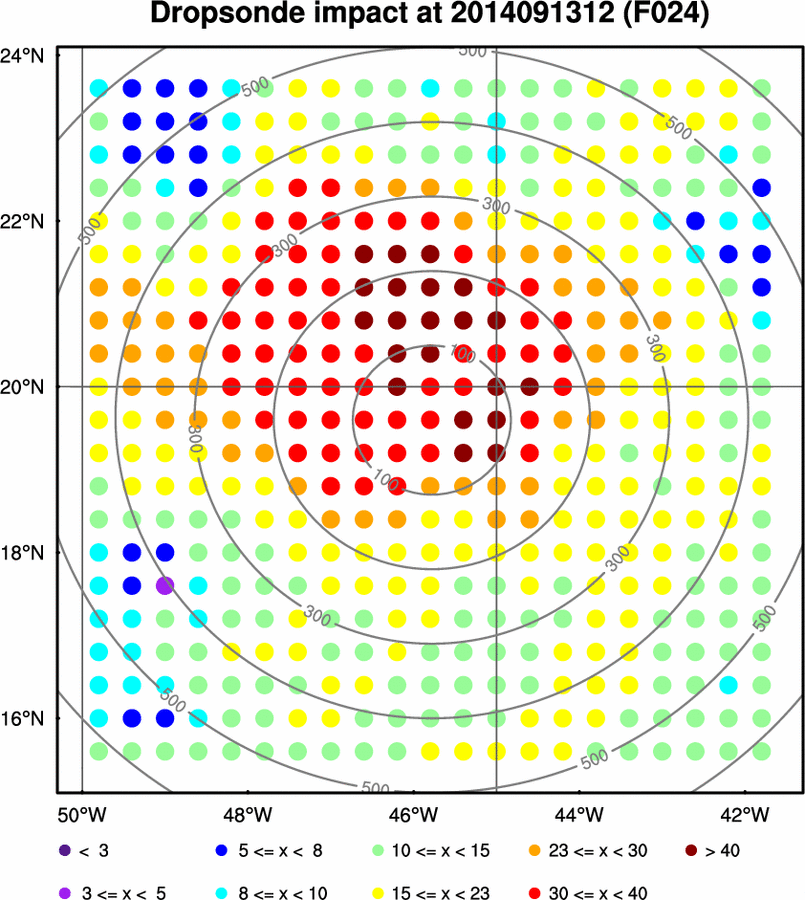
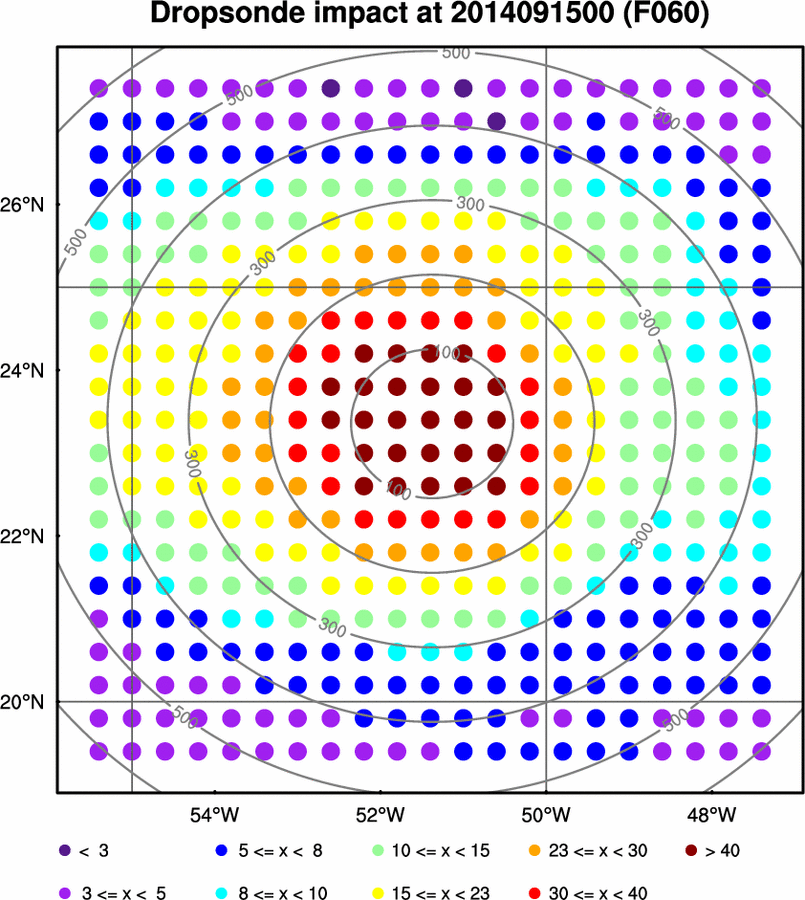
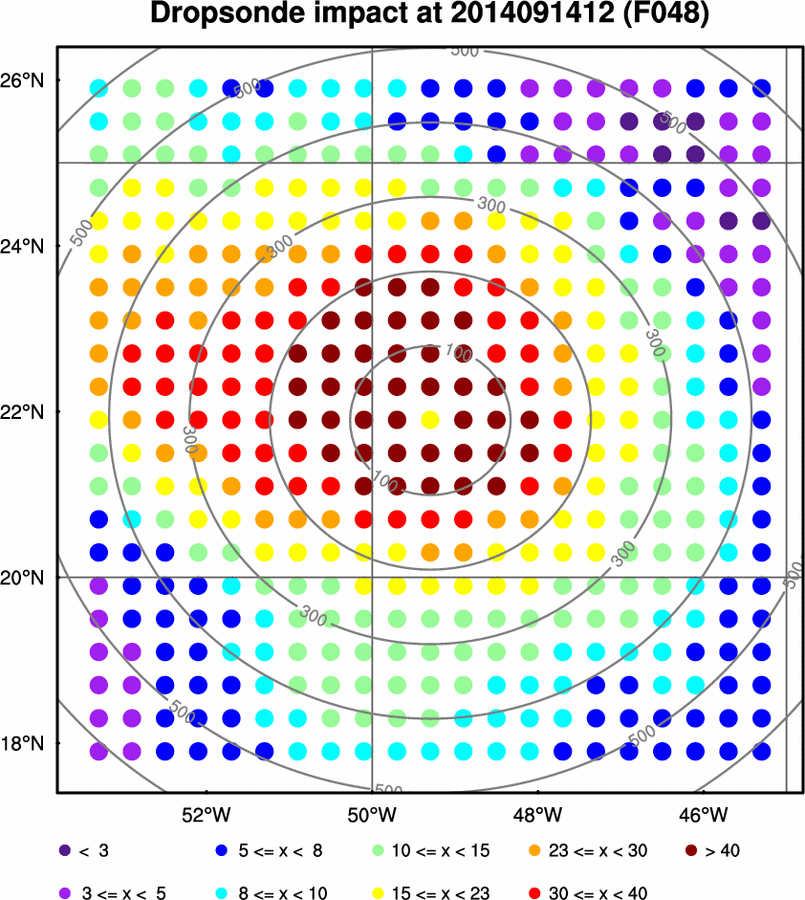
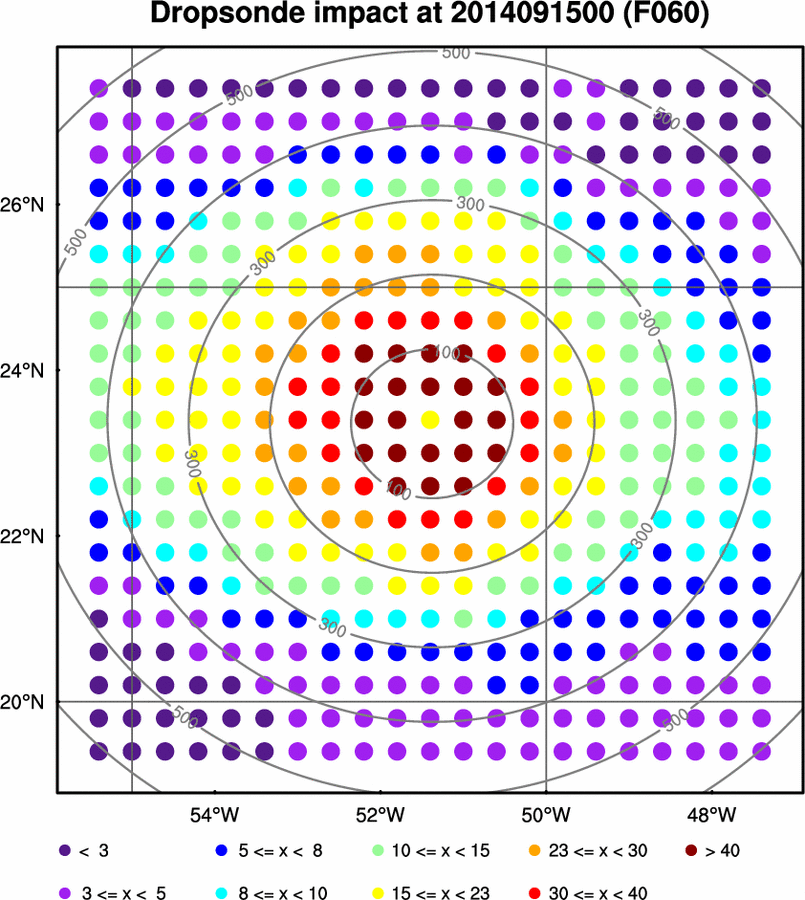
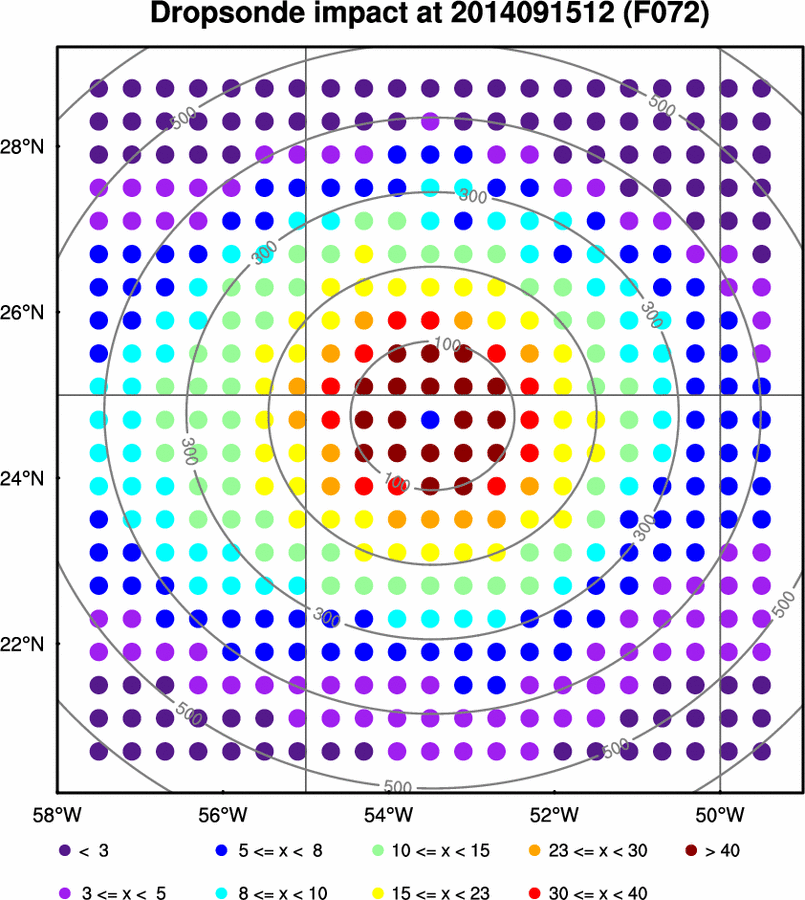
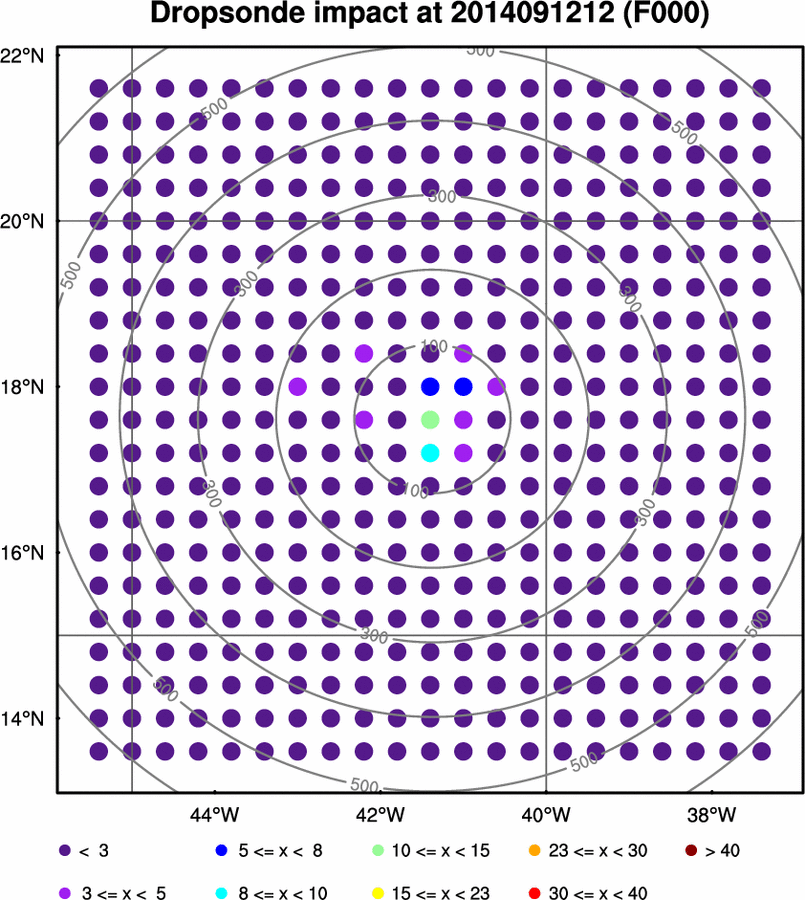
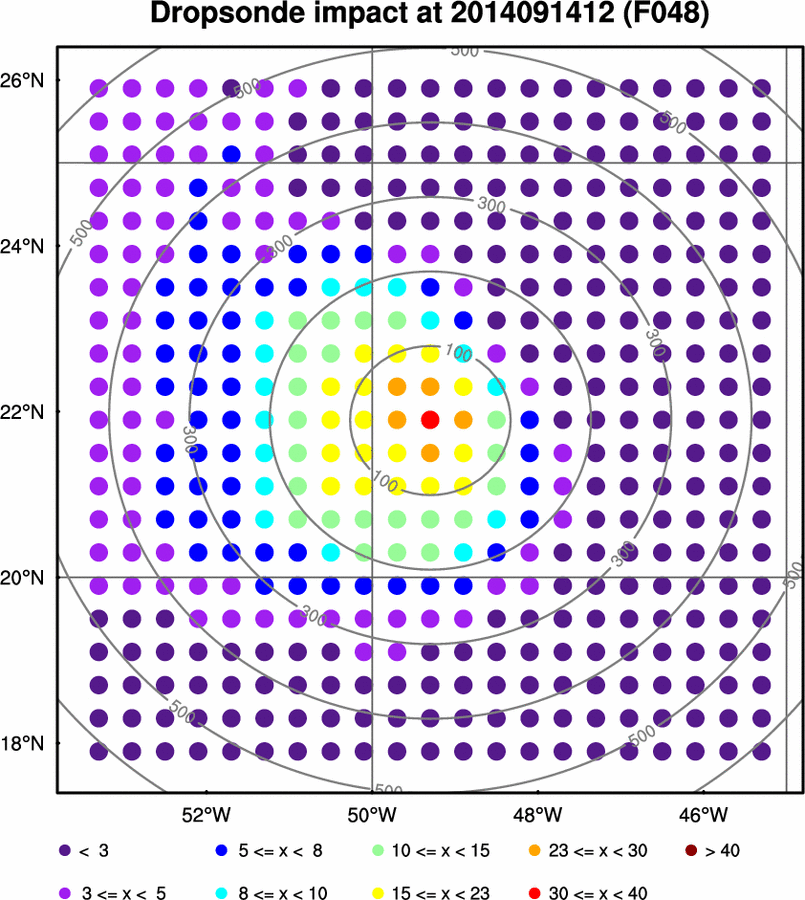
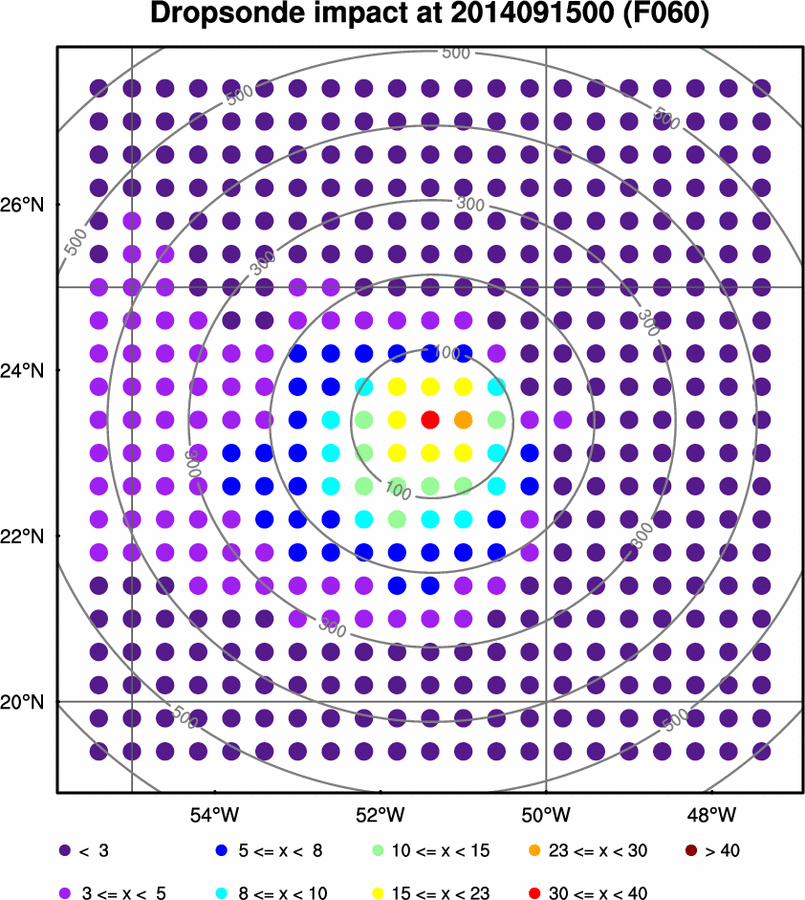
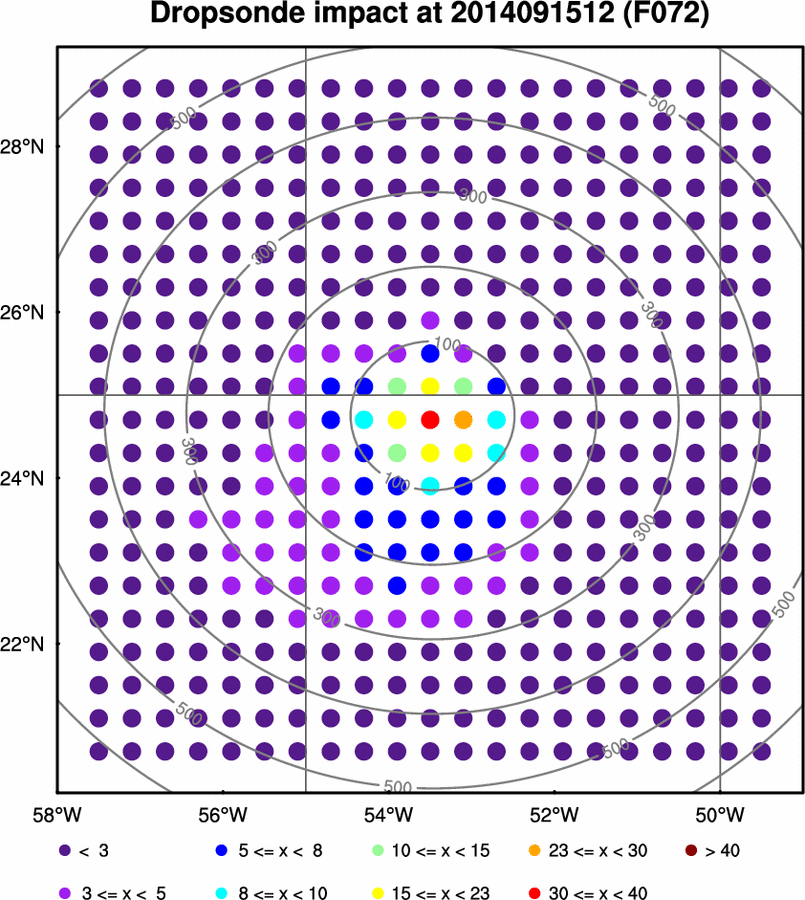
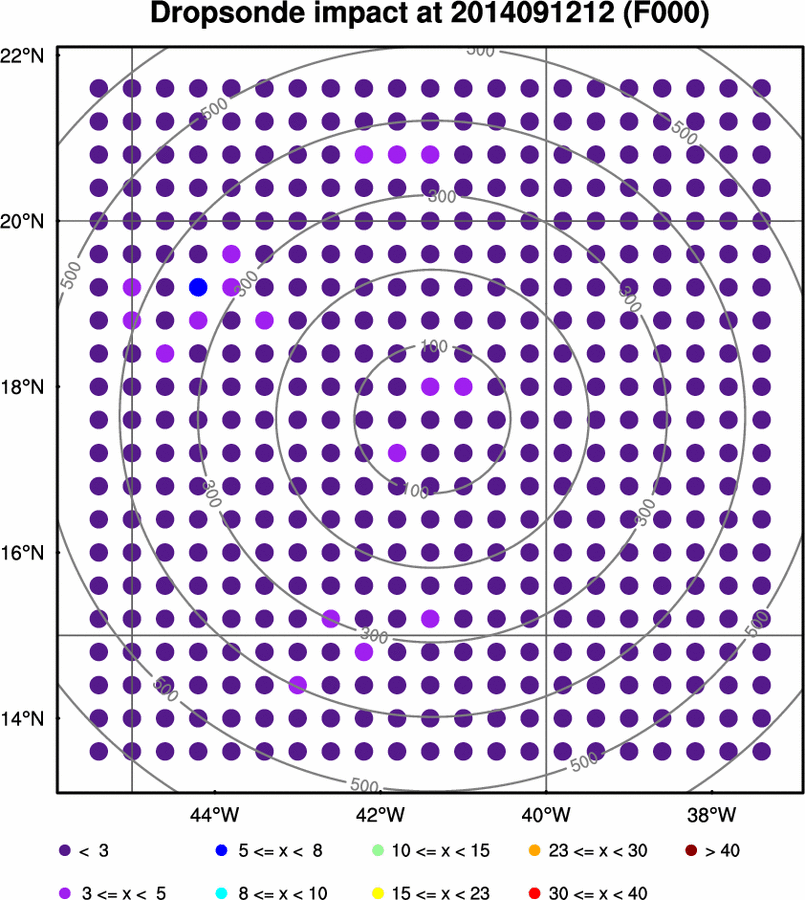
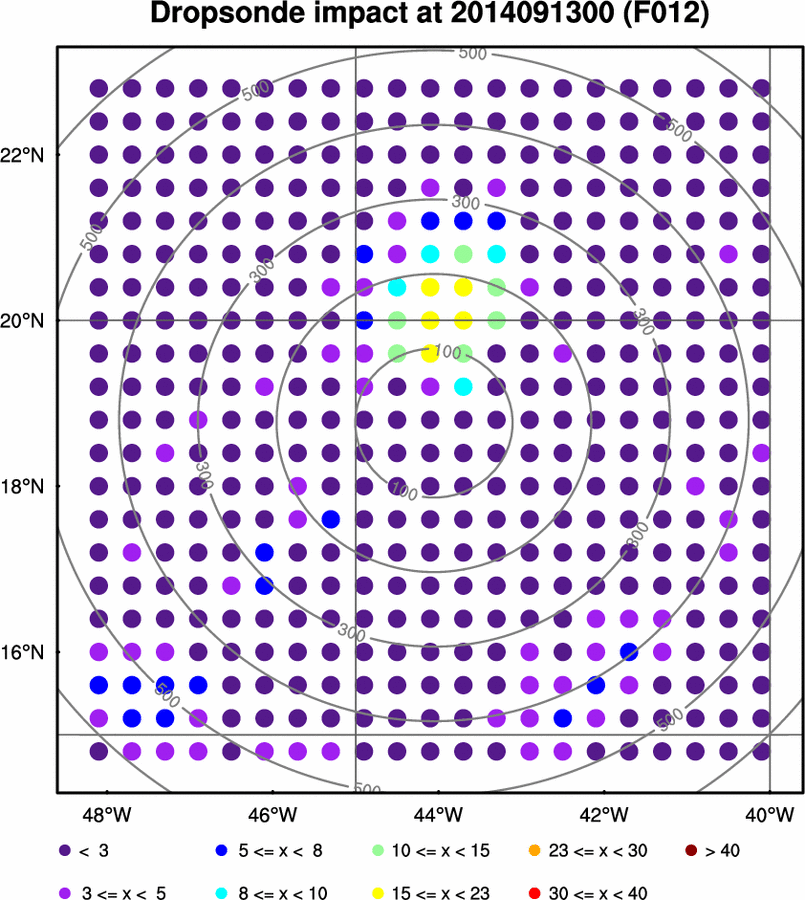
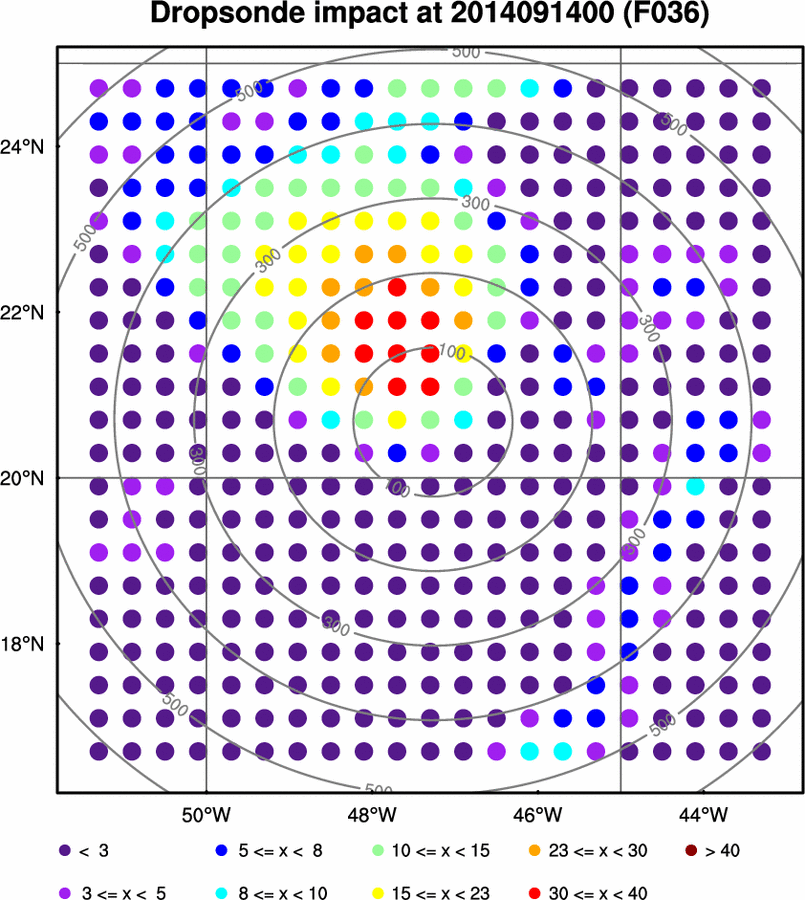
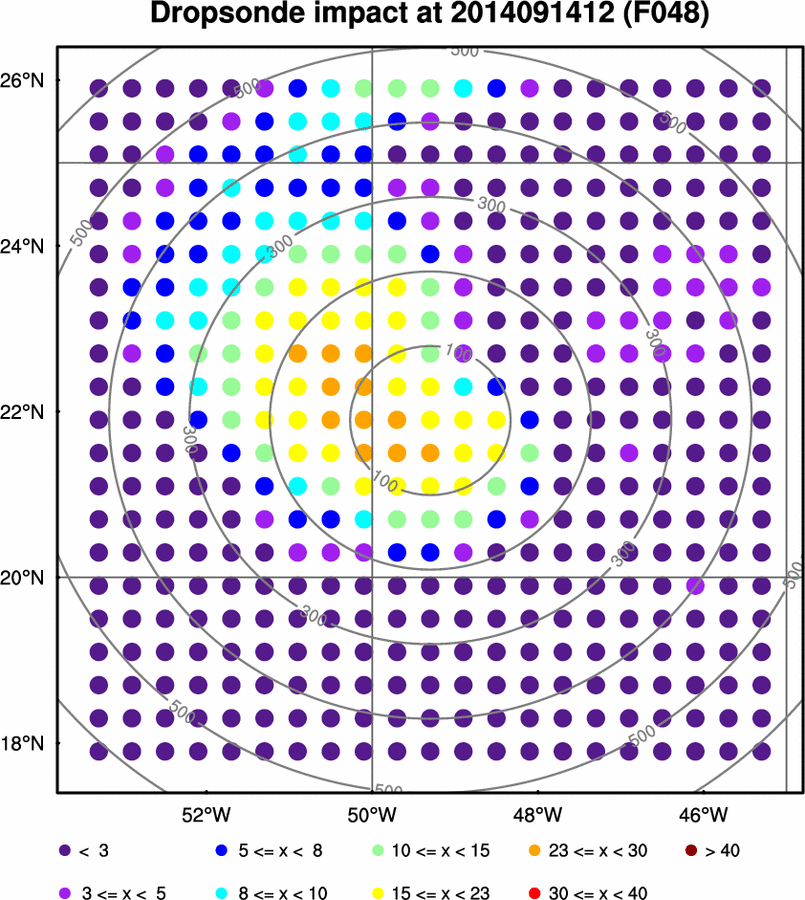
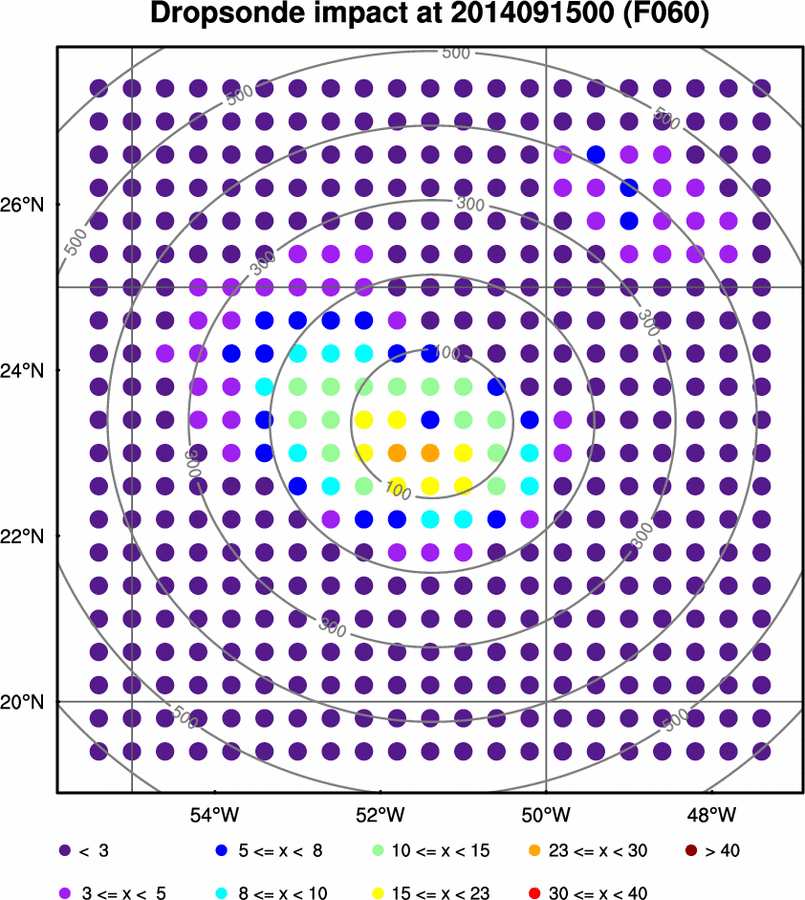
000 h (12/12) 012 h (13/00) 024 h (13/12) 036 h (14/00) 048 h (14/12) 060 h (15/00) 072 h (15/12) Loop All Dropsonde Observation Impact
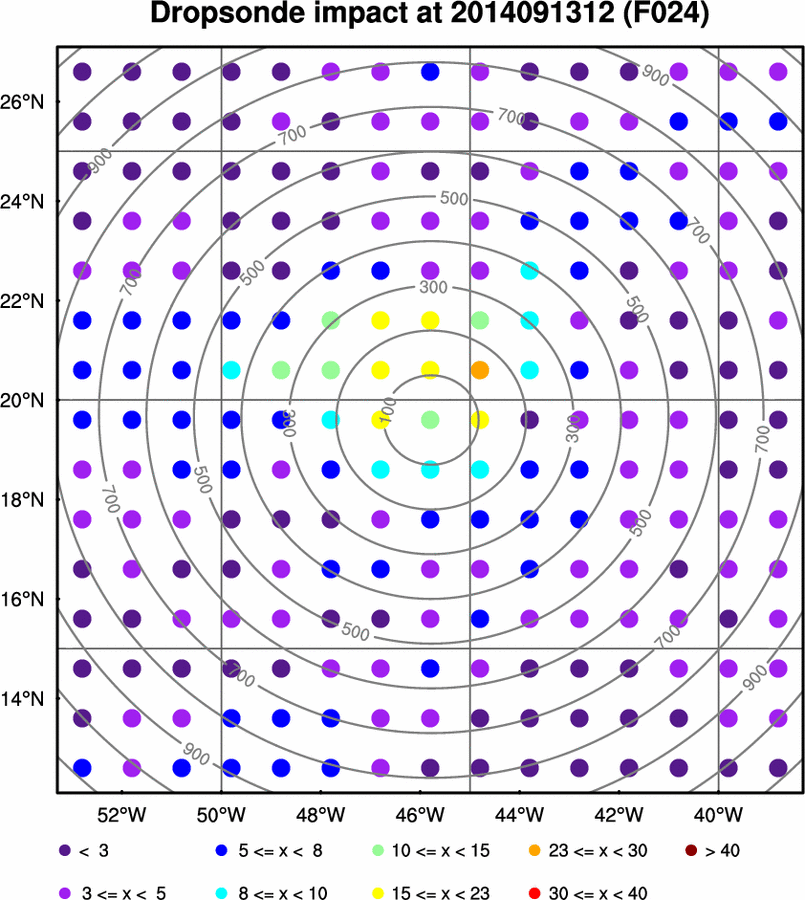
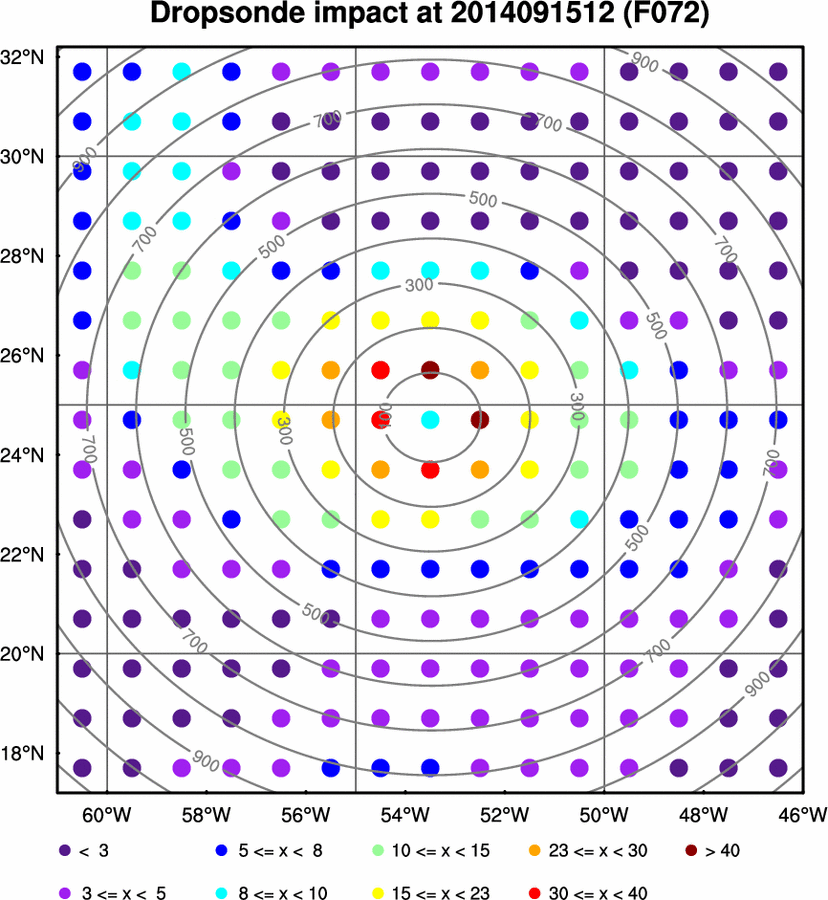
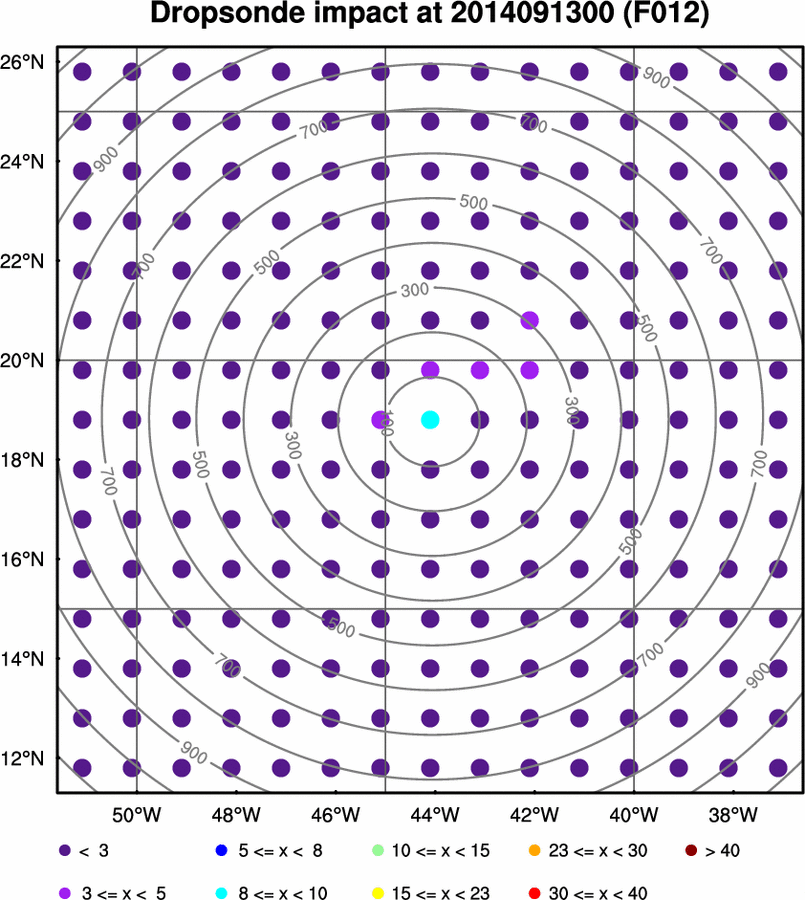
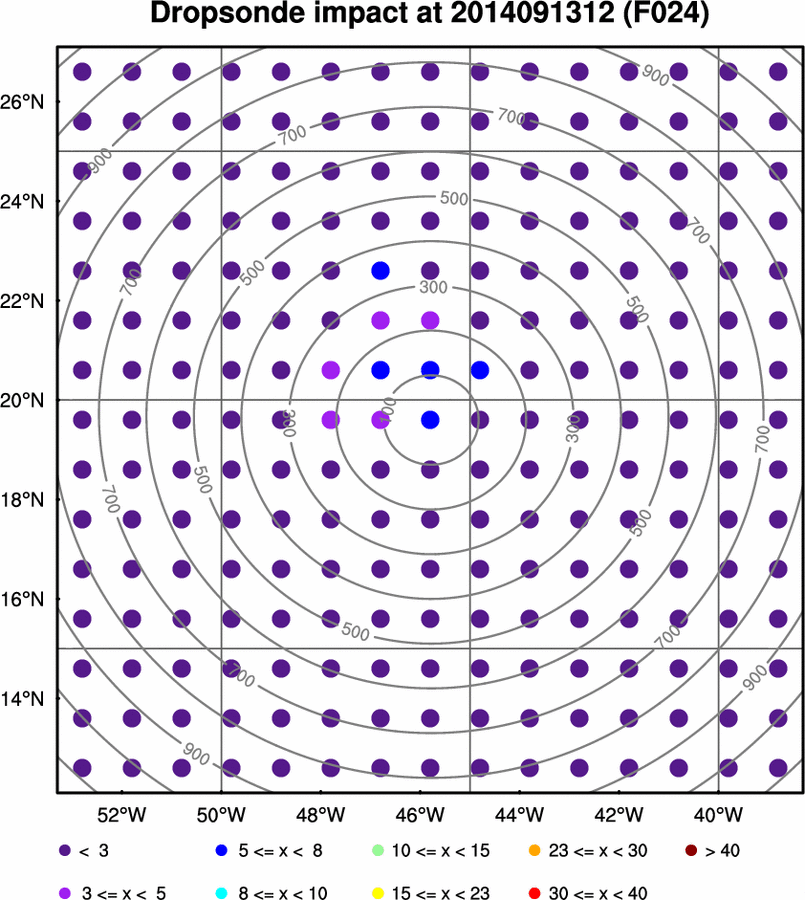
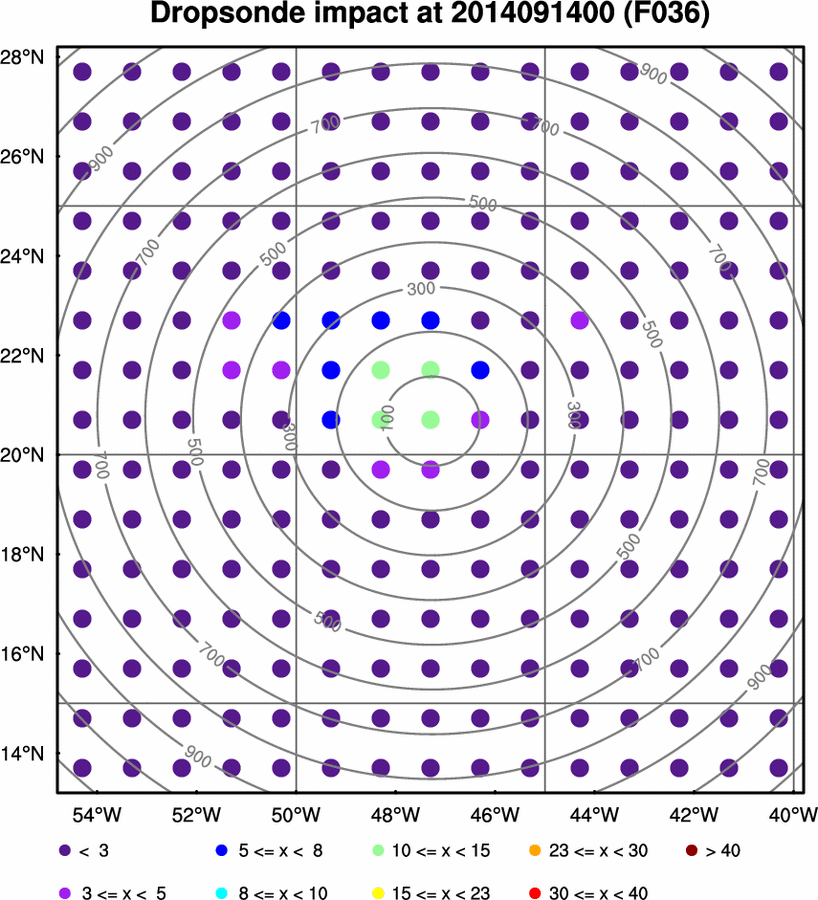
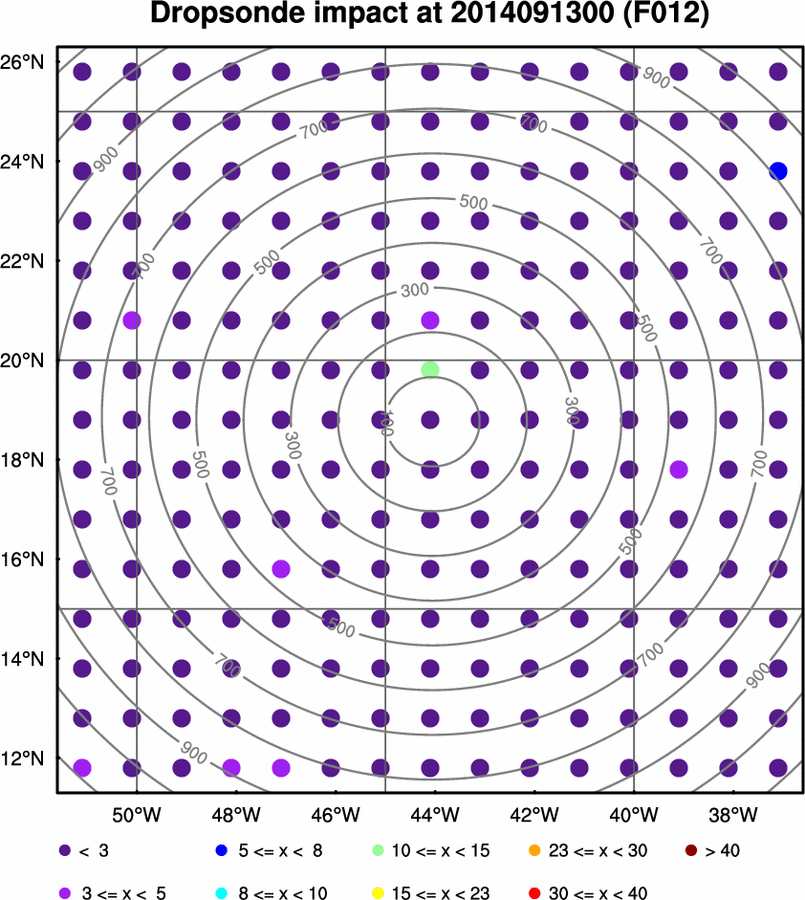
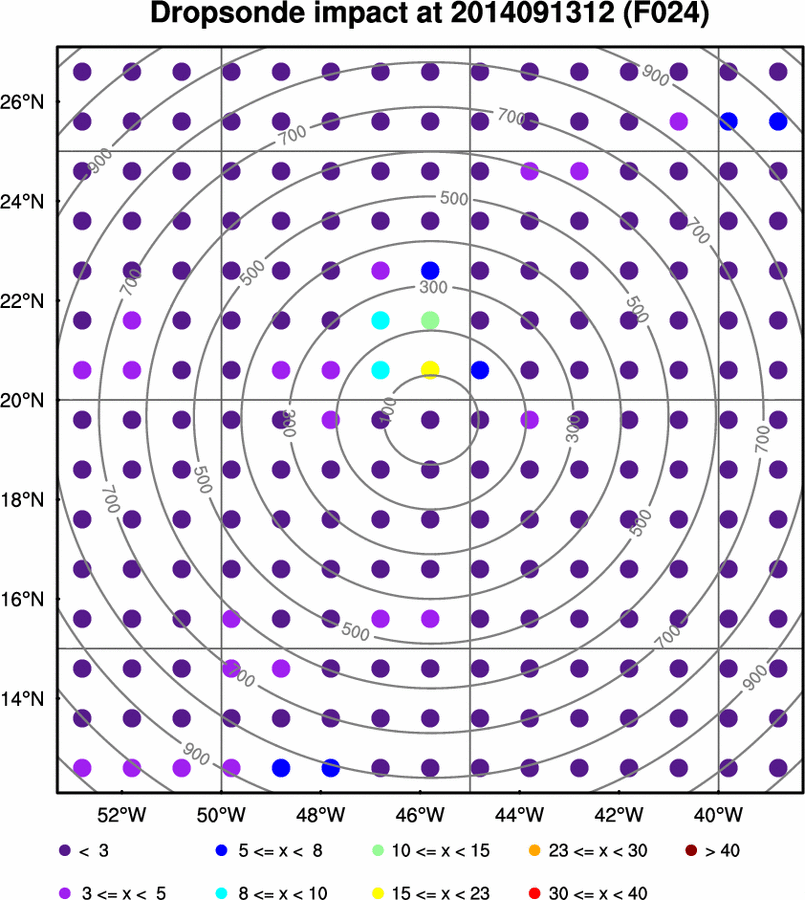
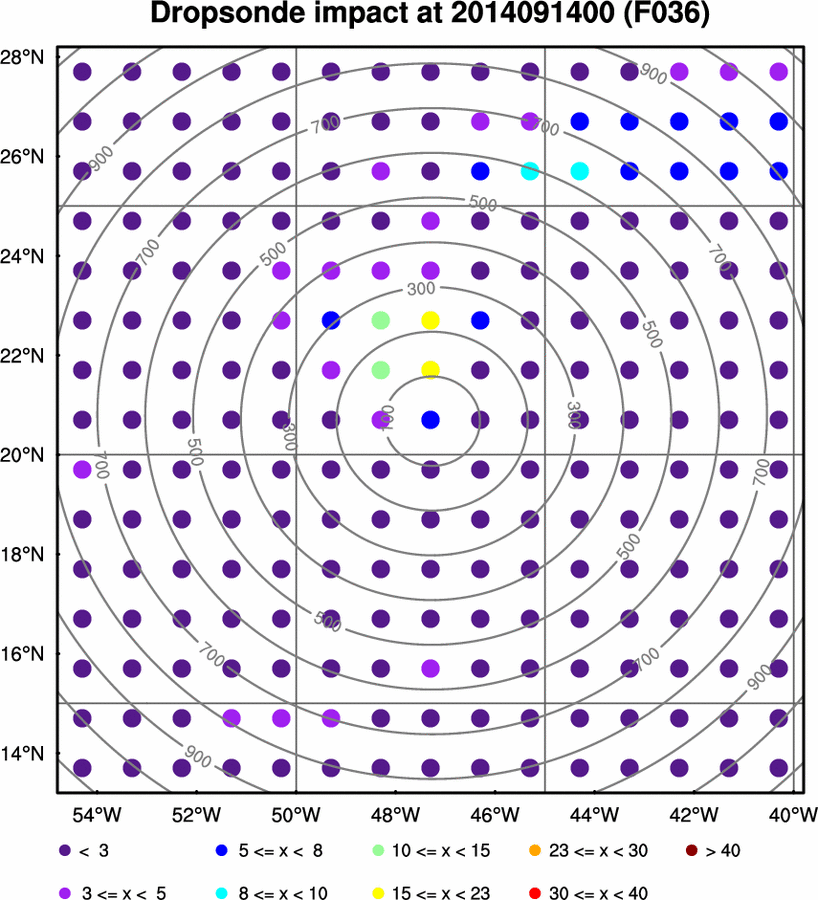
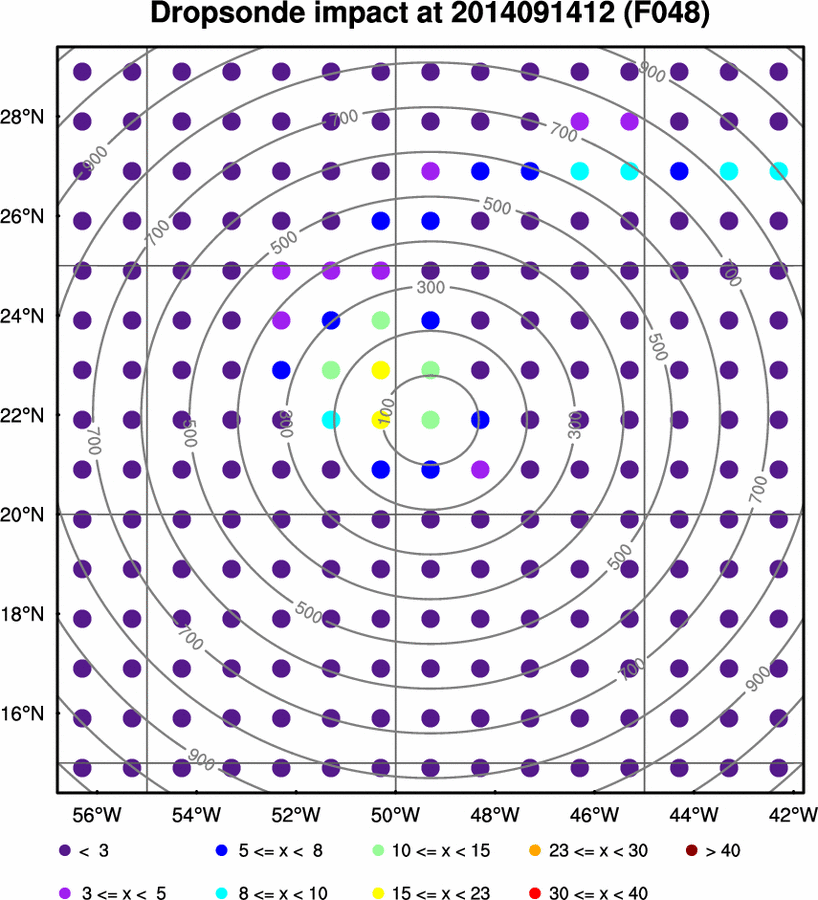
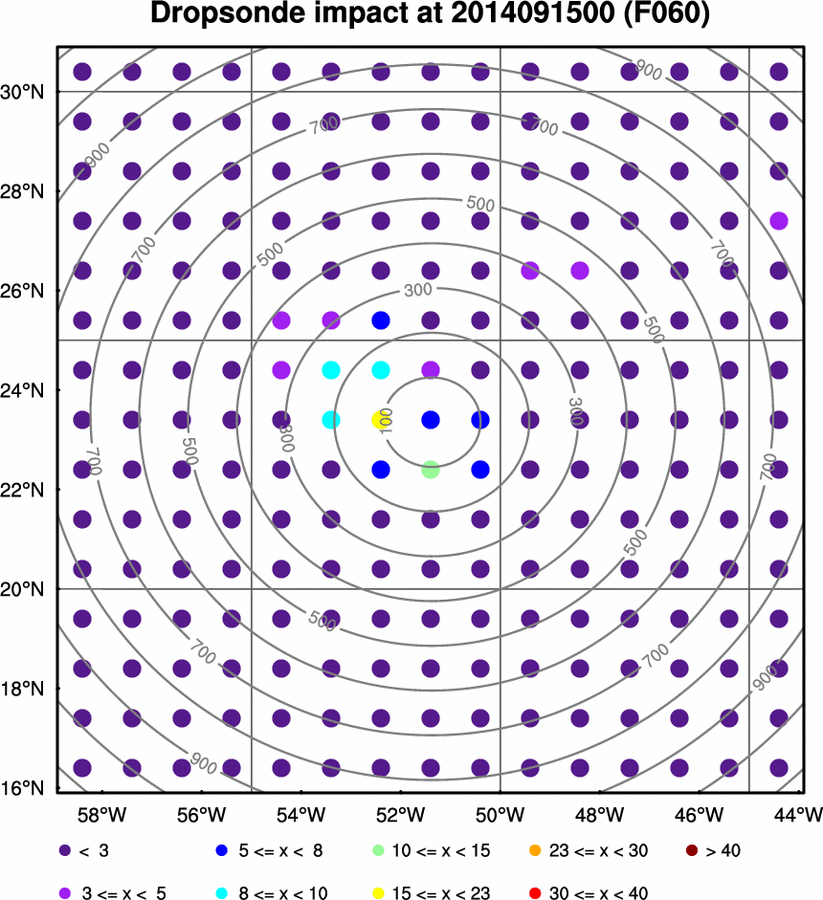
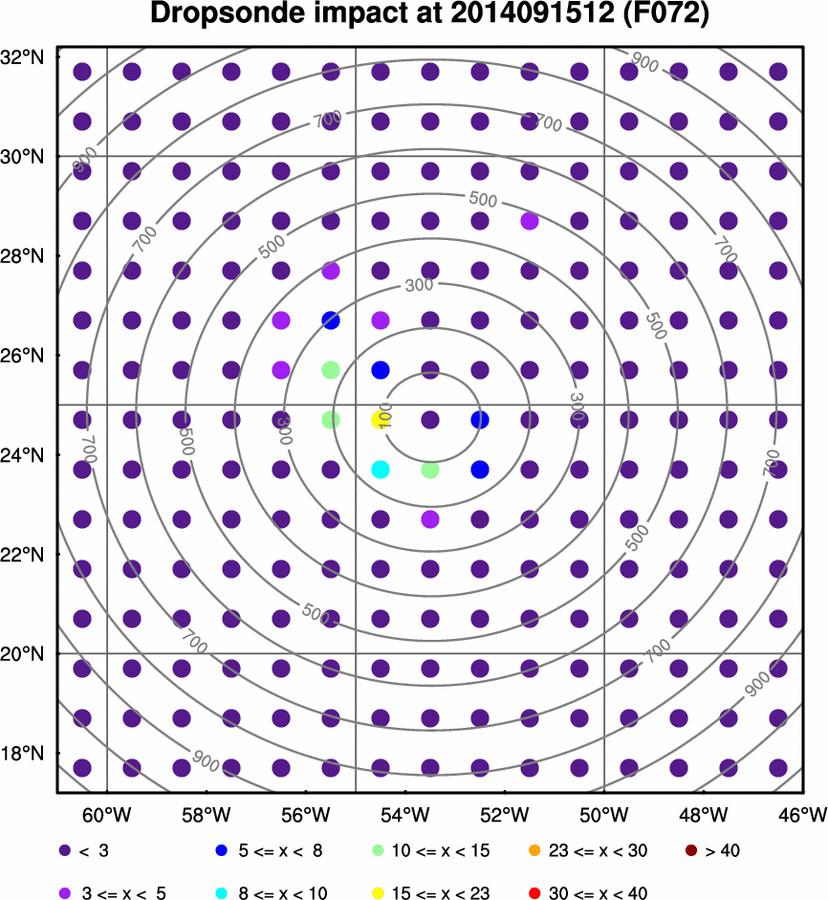
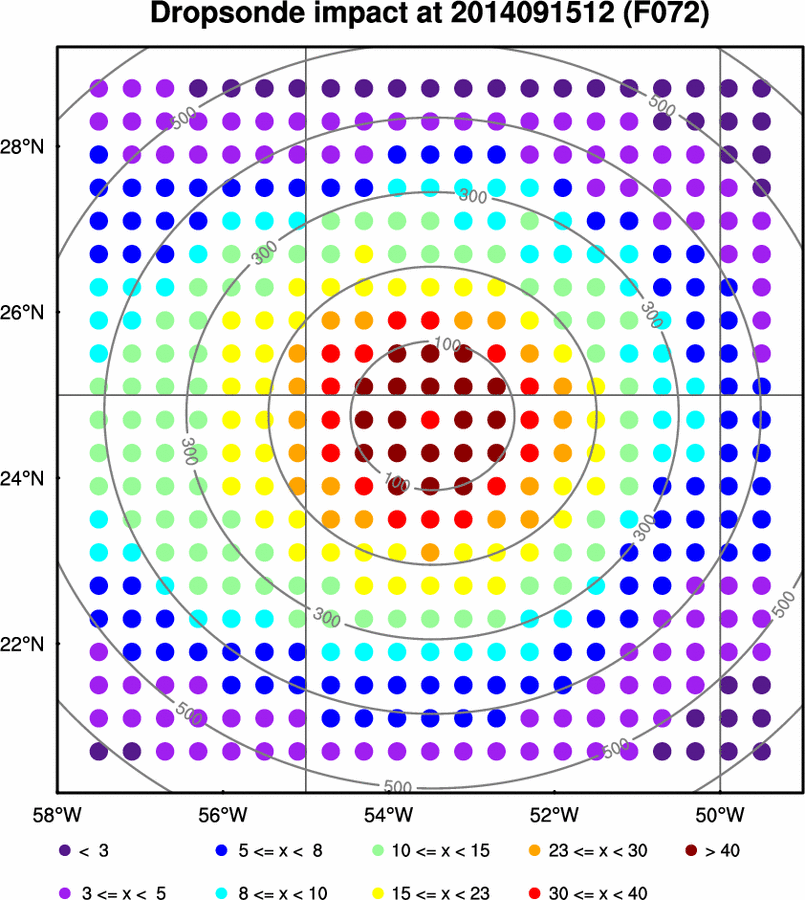
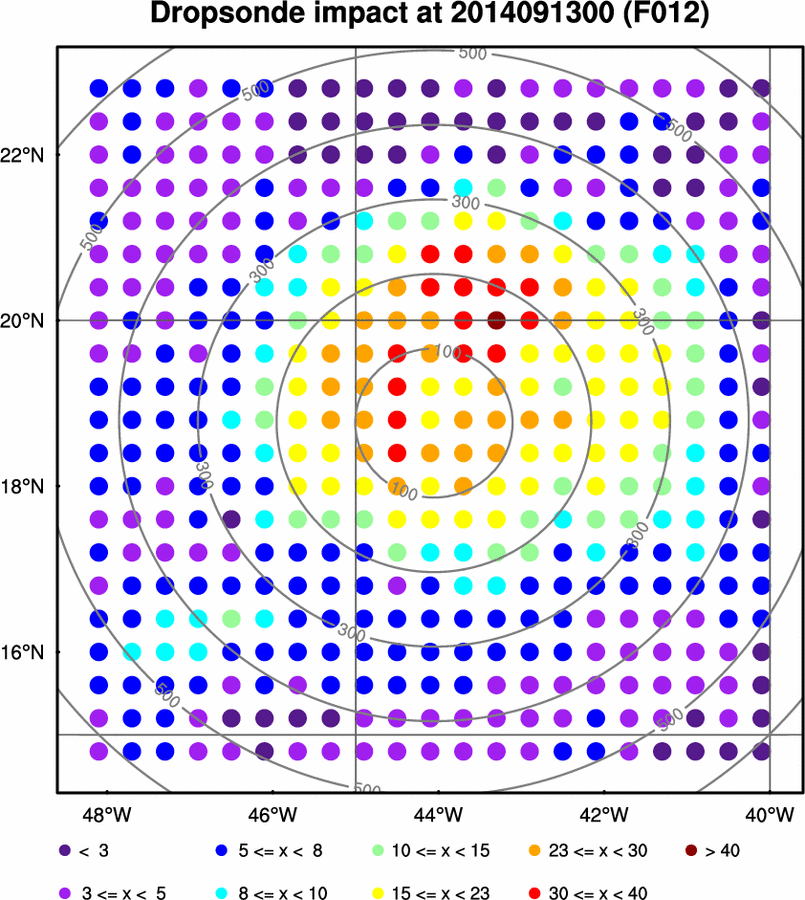
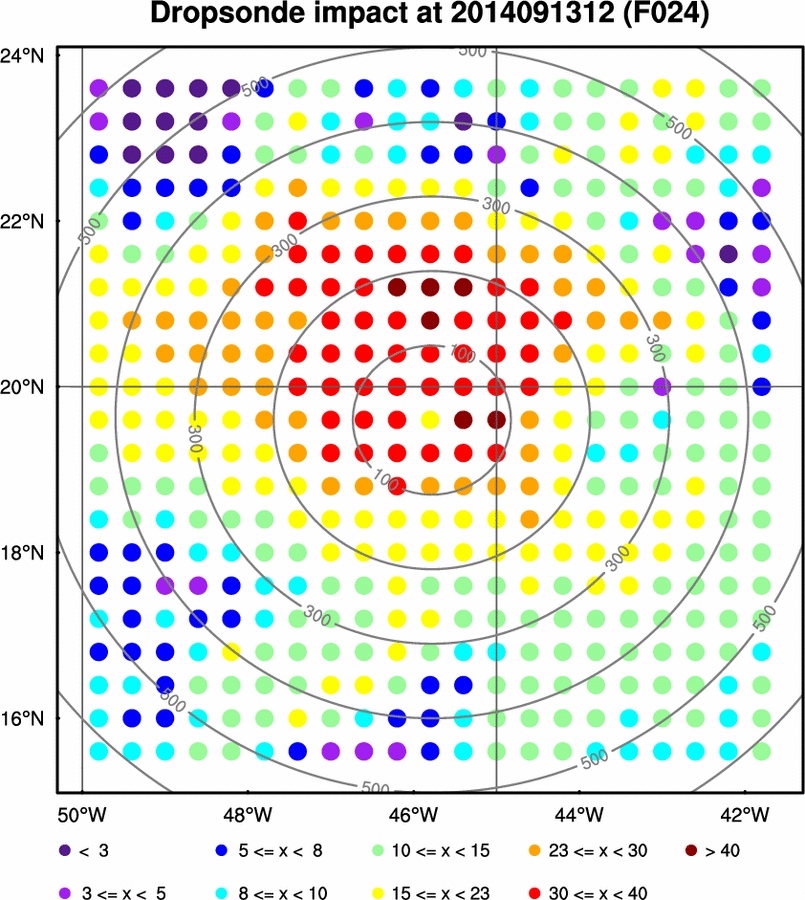
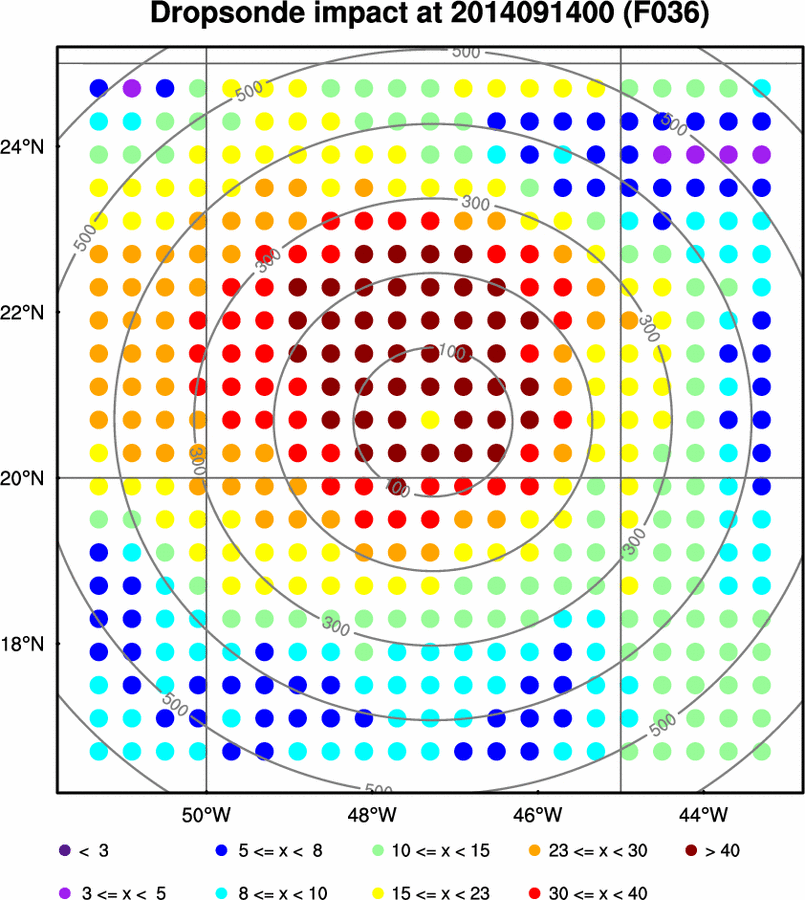
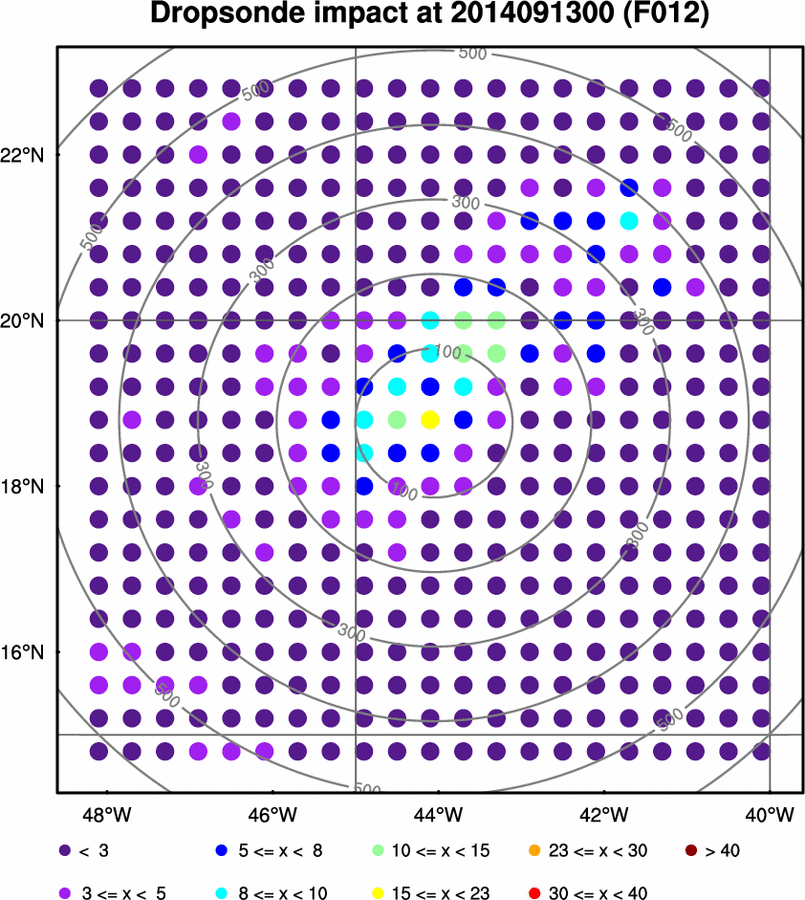
Hypothetical percentage reduction in forecast metric standard deviation due to assimilating all variables from dropsonde at that location.Dropsonde Impact 000 012 024 036 048 060 072 Loop Wind Dropsonde Observation Impact
Hypothetical percentage reduction in forecast metric standard deviation due to assimilating wind from dropsonde at that location.Dropsonde Impact 000 012 024 036 048 060 072 Loop Temp. Dropsonde Observation Impact
Hypothetical percentage reduction in forecast metric standard deviation due to assimilating temperature from dropsonde at that location.Dropsonde Impact 000 012 024 036 048 060 072 Loop RH Dropsonde Observation Impact
Hypothetical percentage reduction in forecast metric standard deviation due to assimilating RH from dropsonde at that location.Dropsonde Impact 000 012 024 036 048 060 072 Loop Zonal Steering Wind
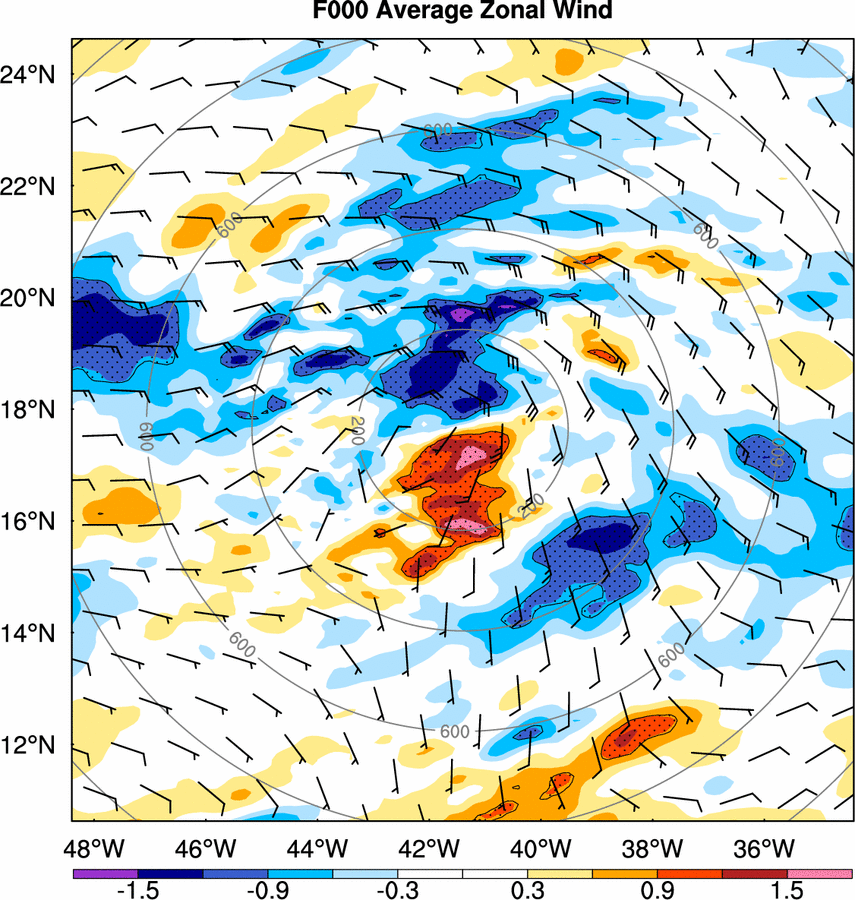
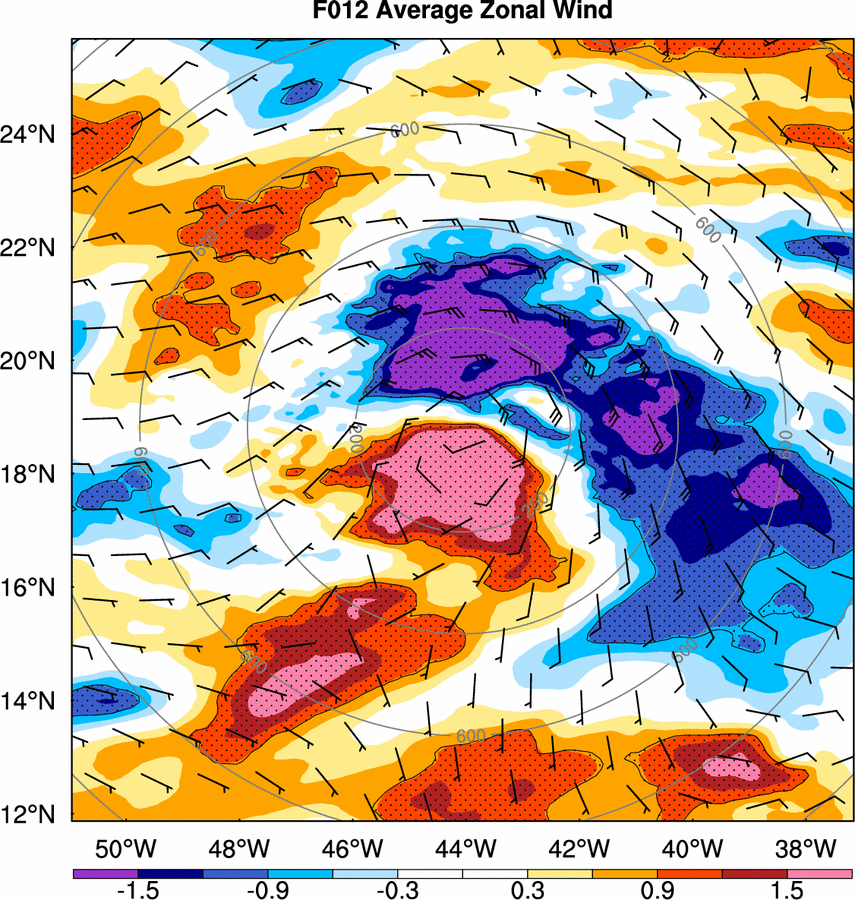
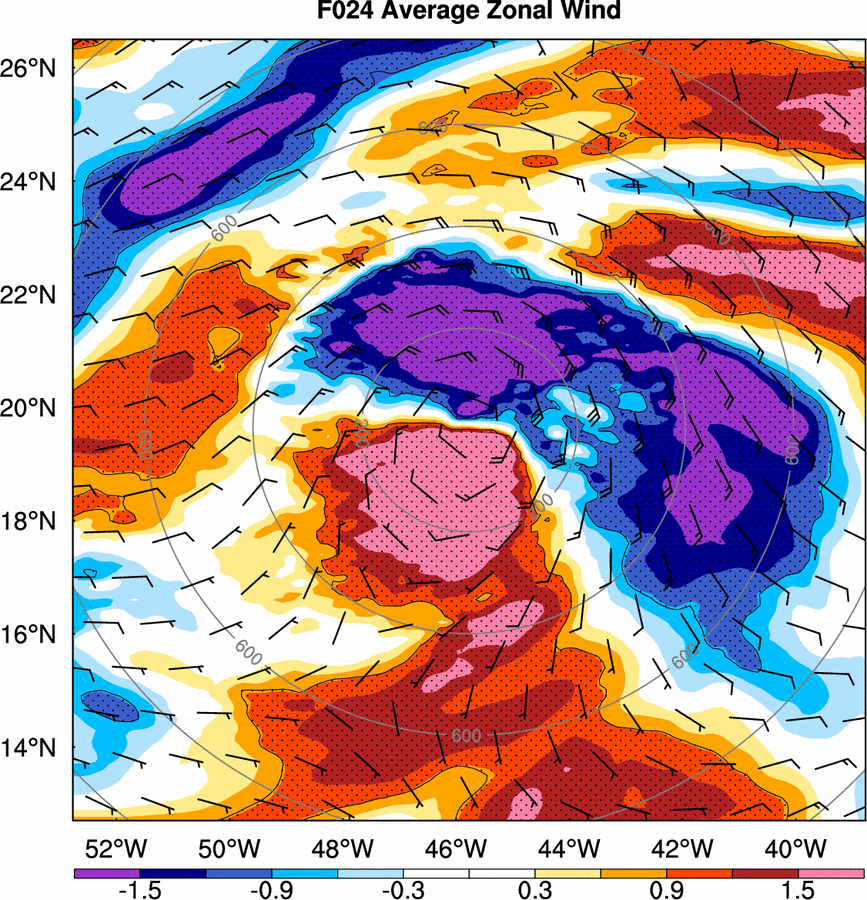
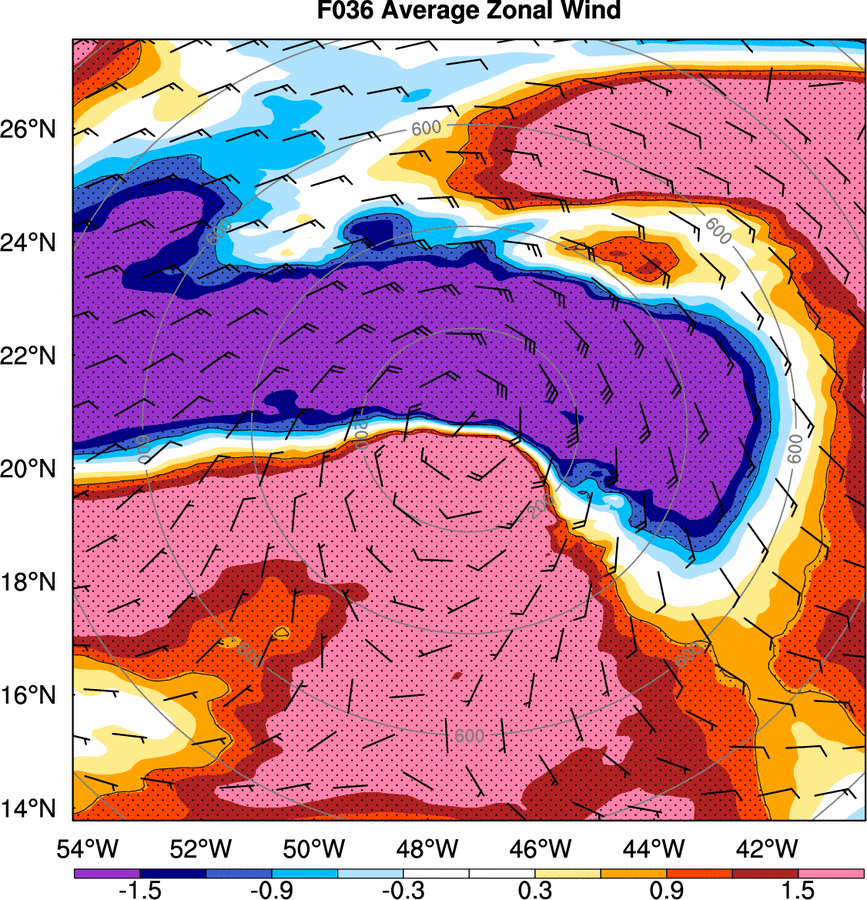
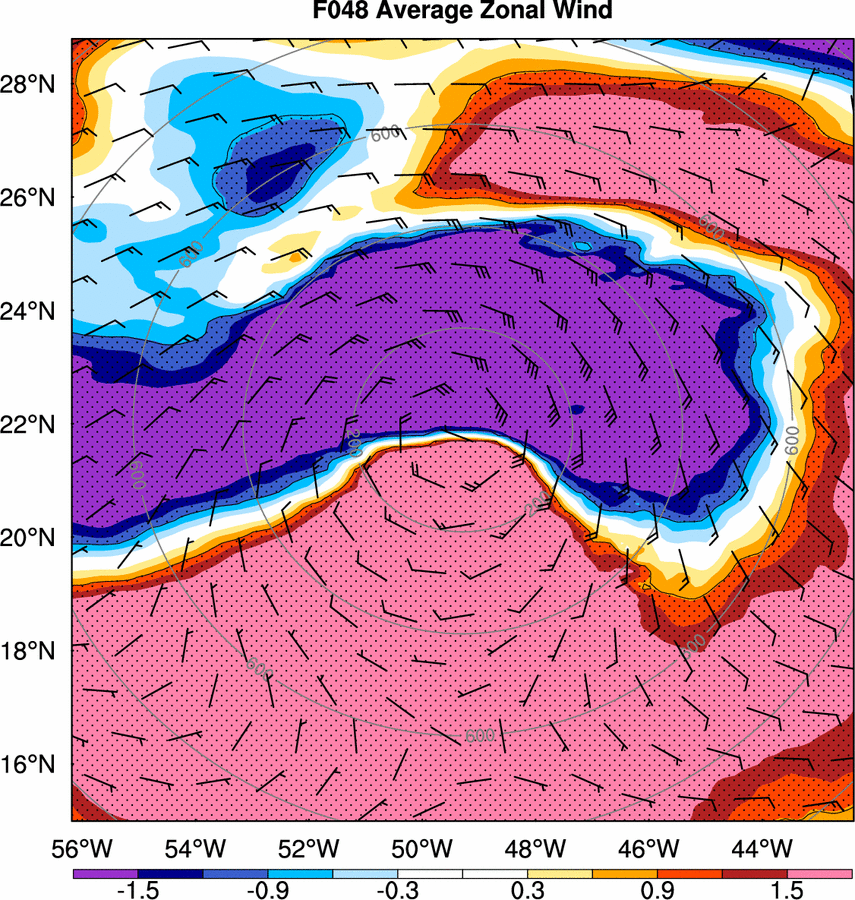
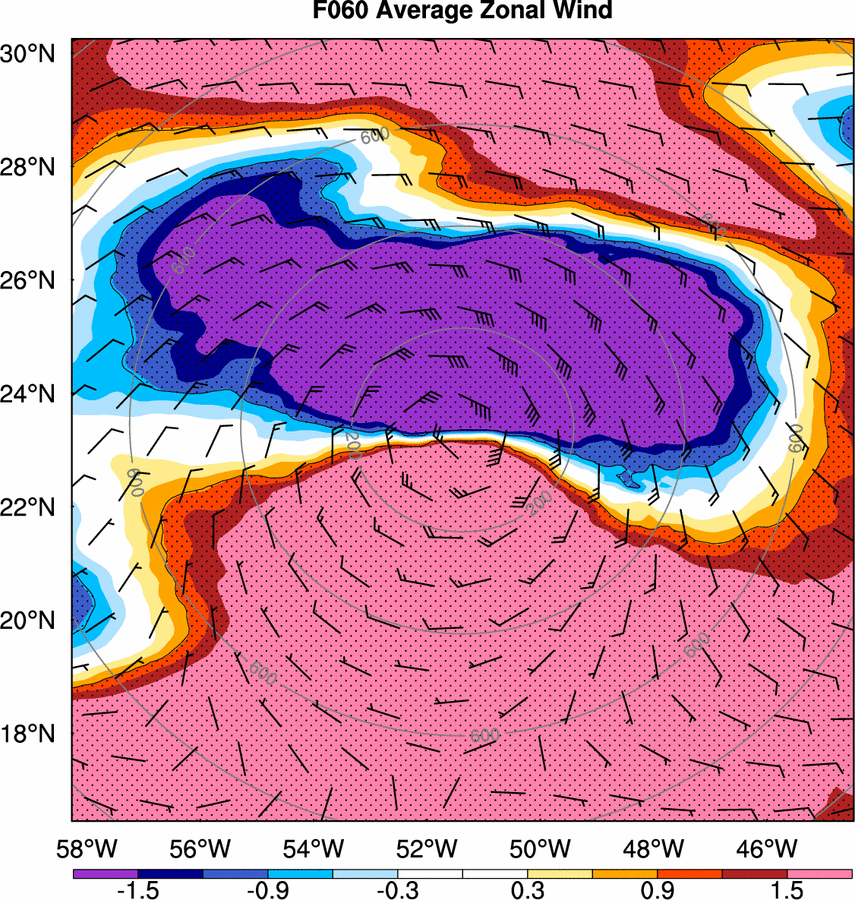
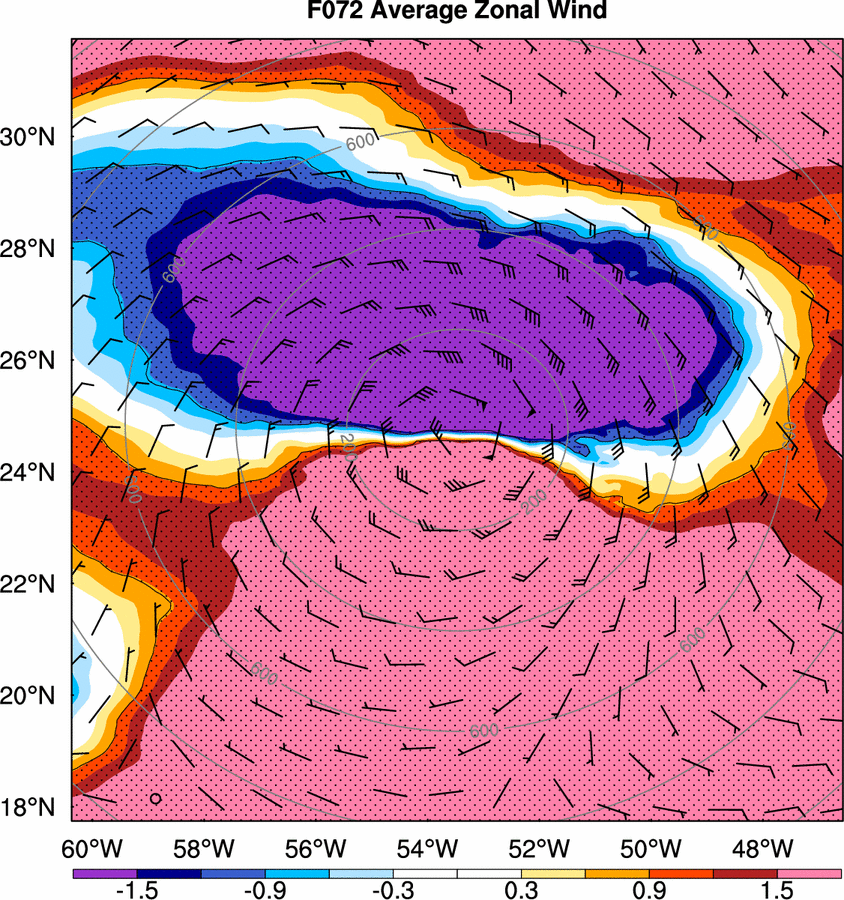
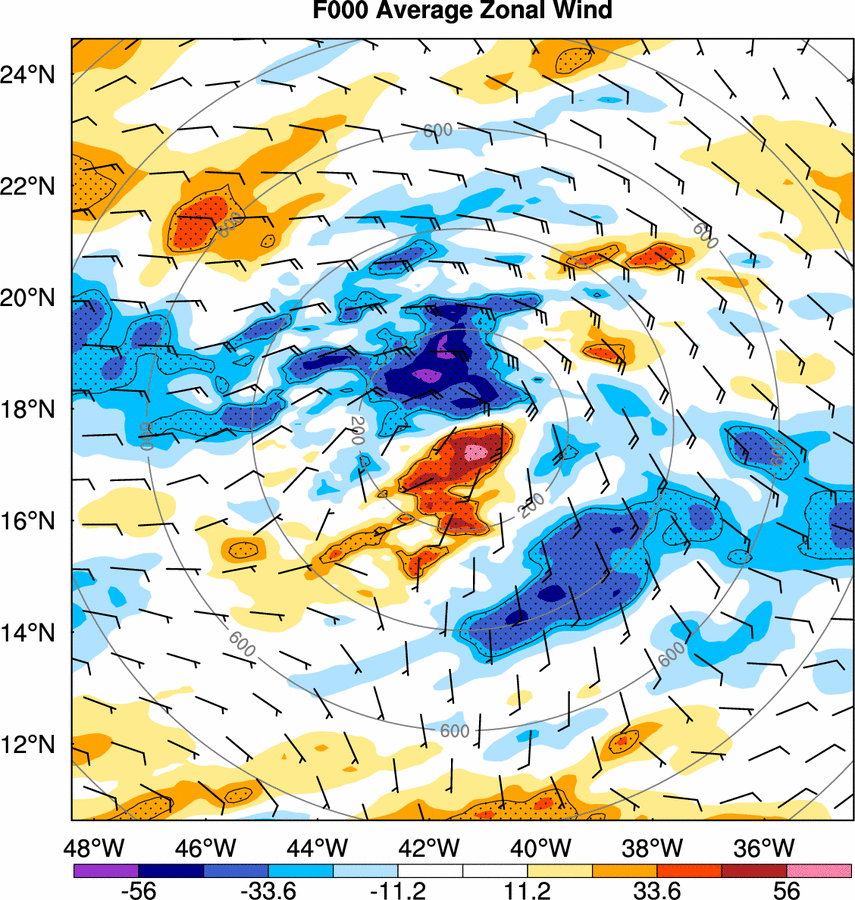
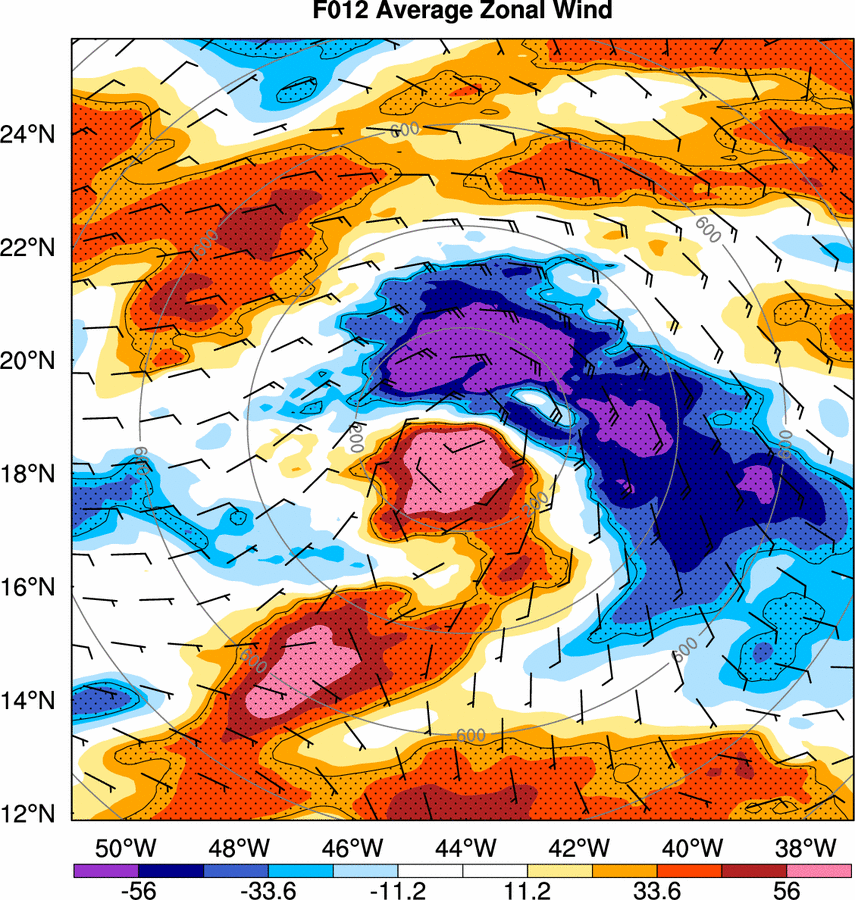
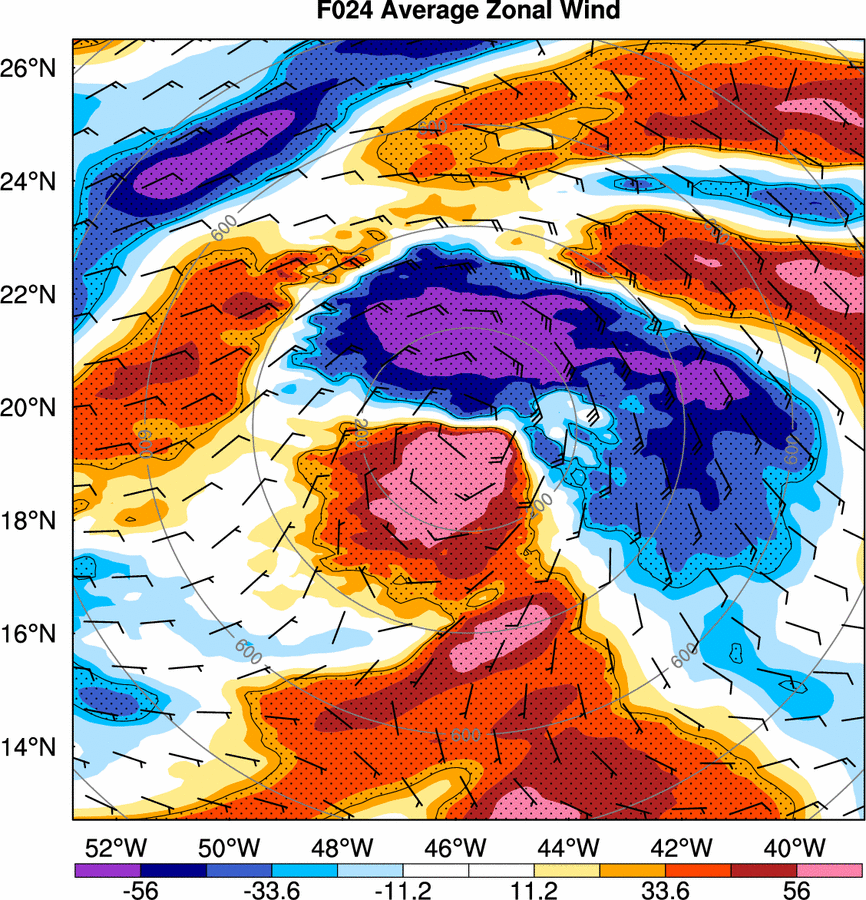
Mean Zonal Wind between 300-850 hPa, which is the typical TC steering level (units: m/s)Composite Diff. 000 012 024 036 048 060 072 Loop Sensitivity (dJ/dx) 000 012 024 036 048 060 072 Loop Meridional Steering Wind
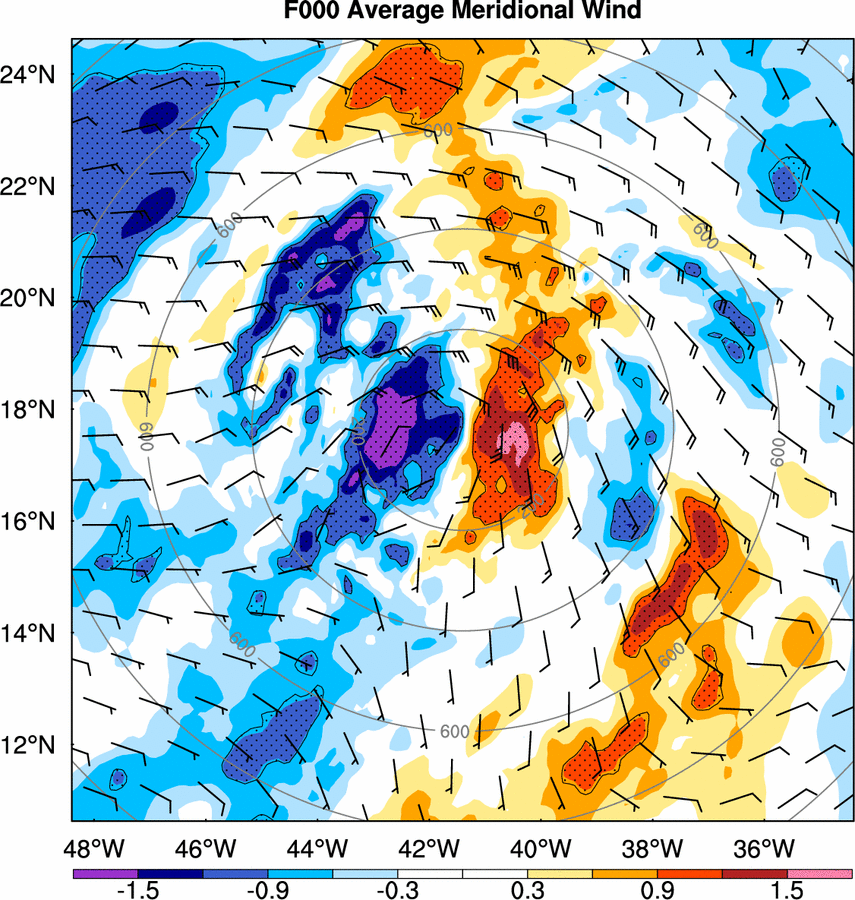
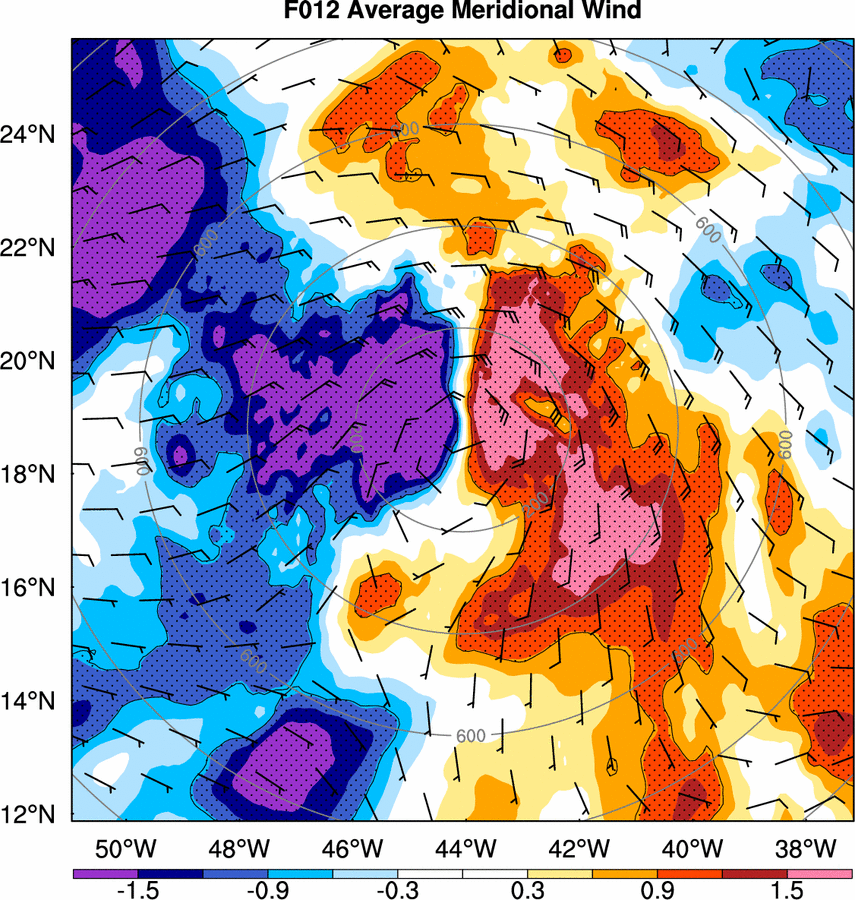
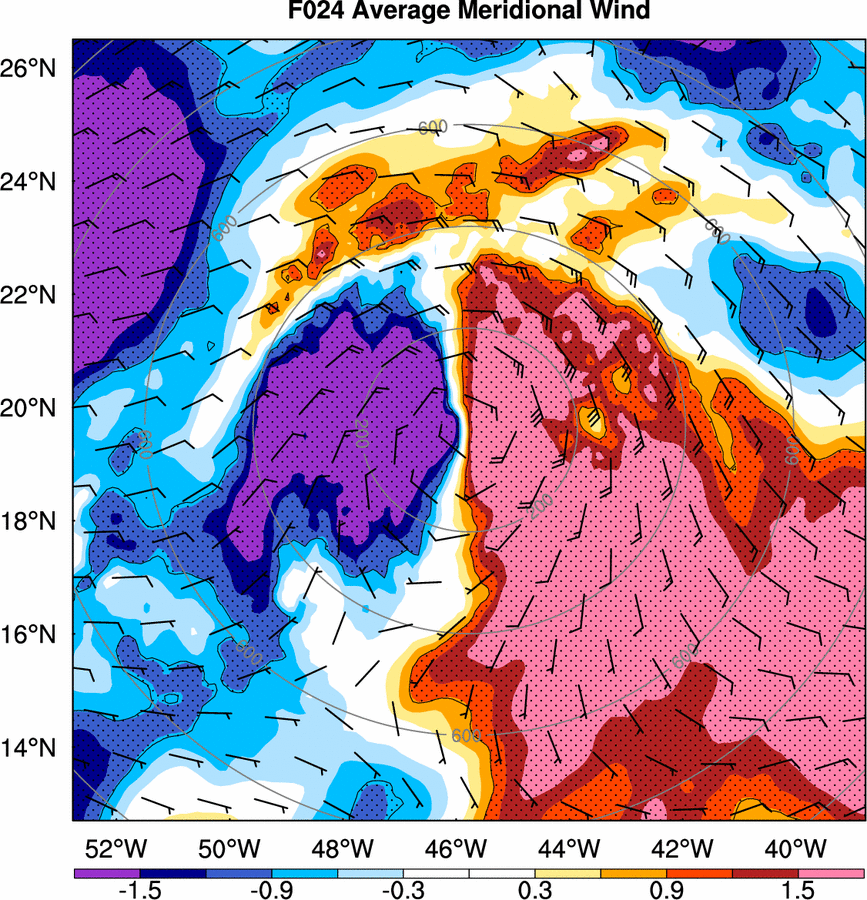
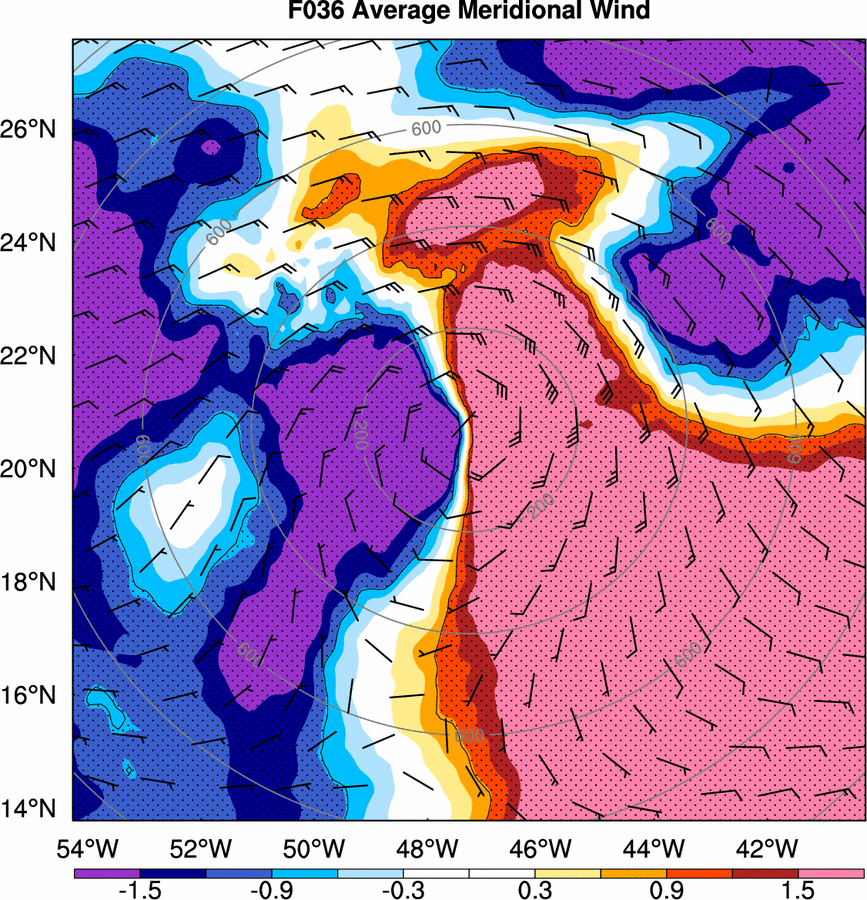
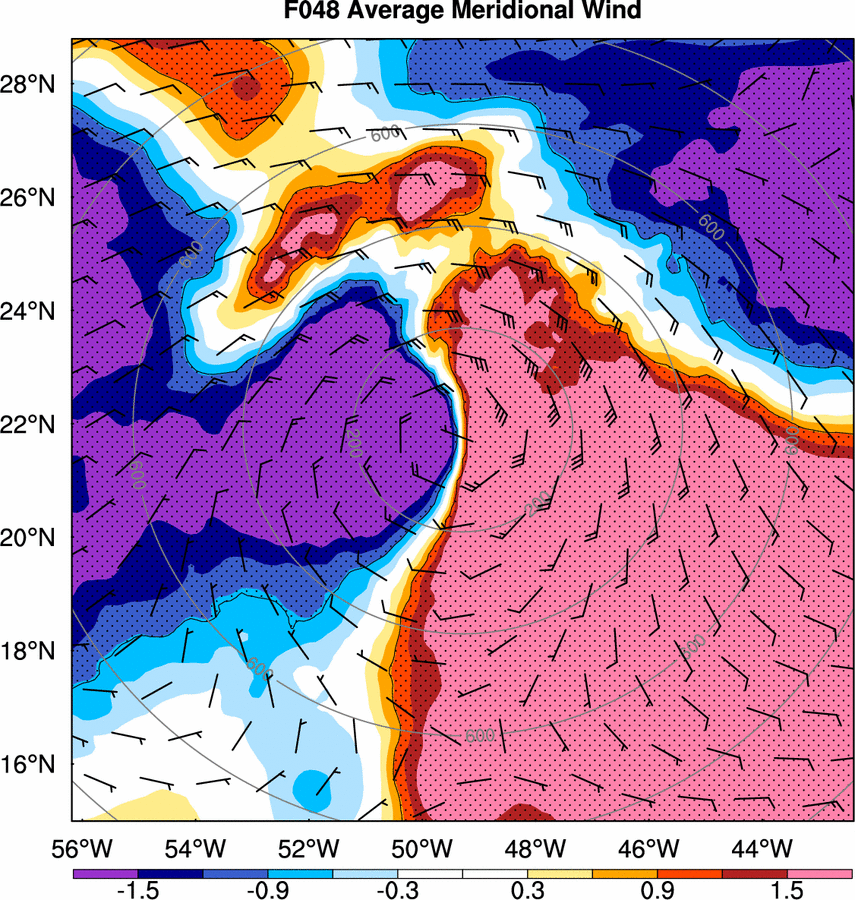
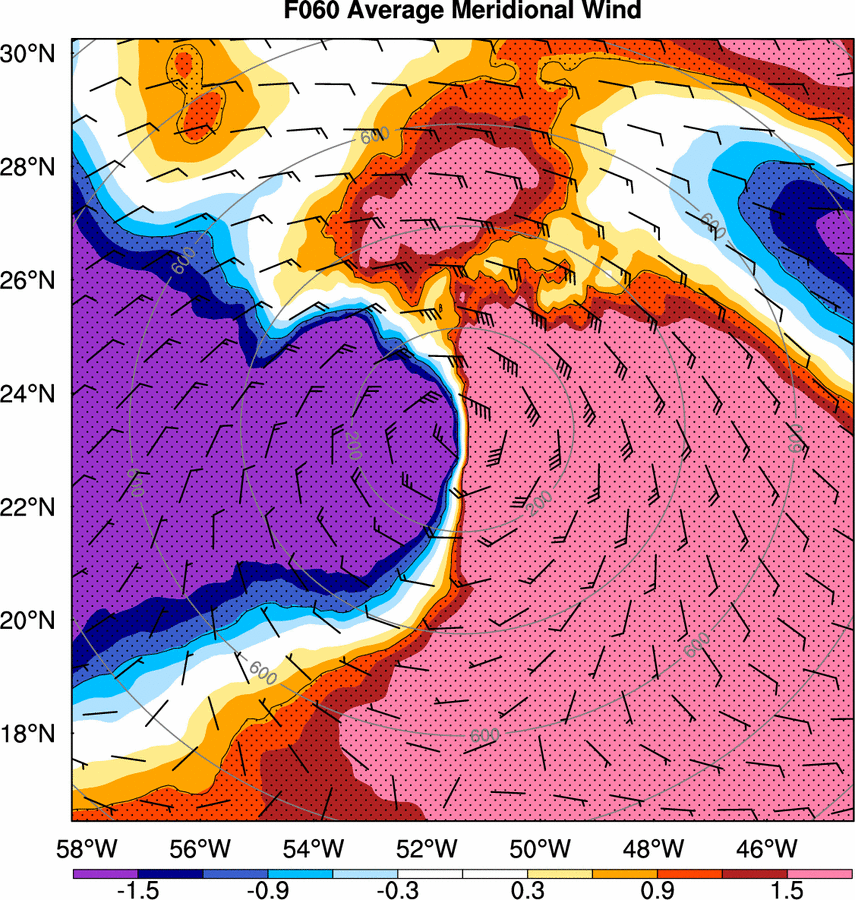
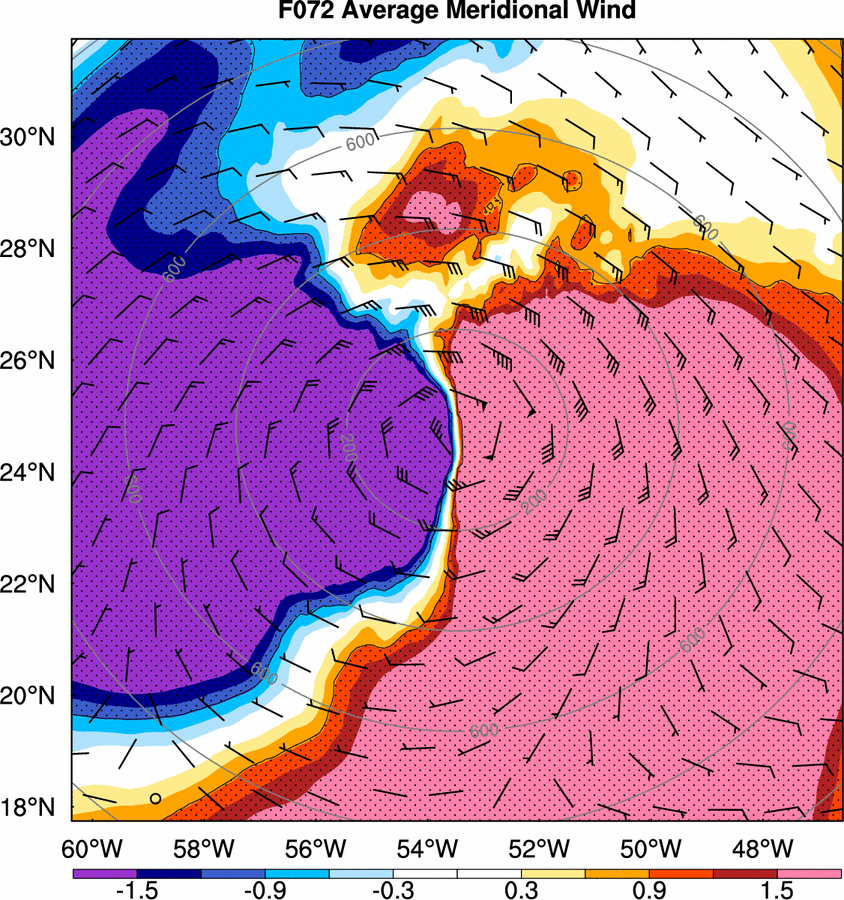
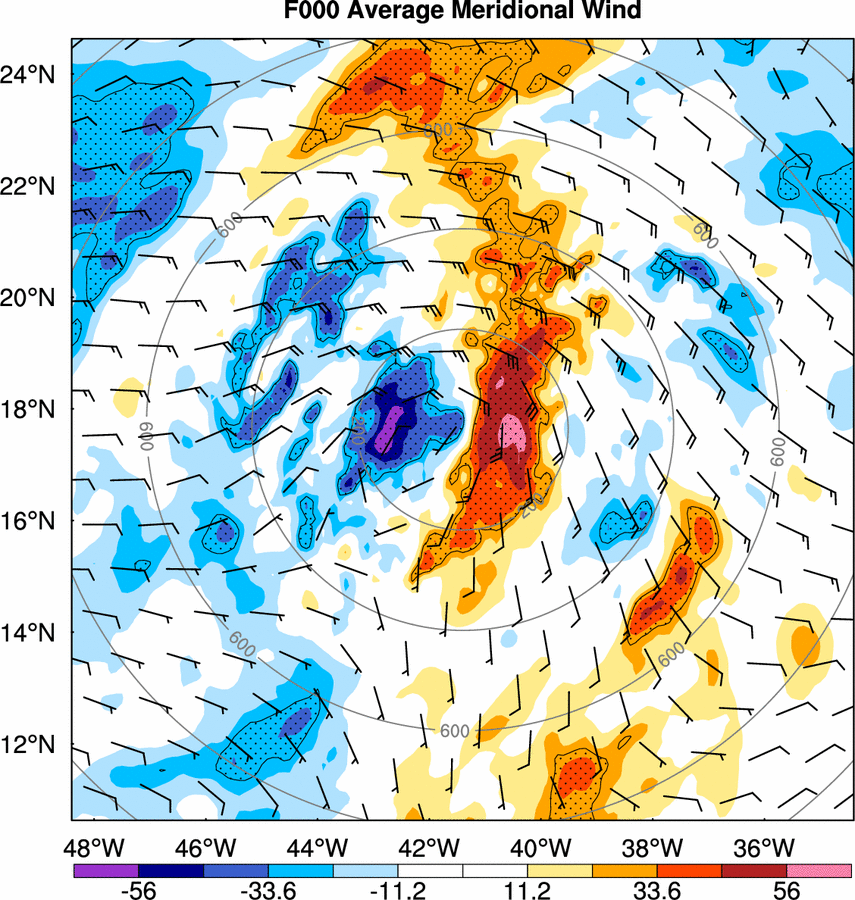
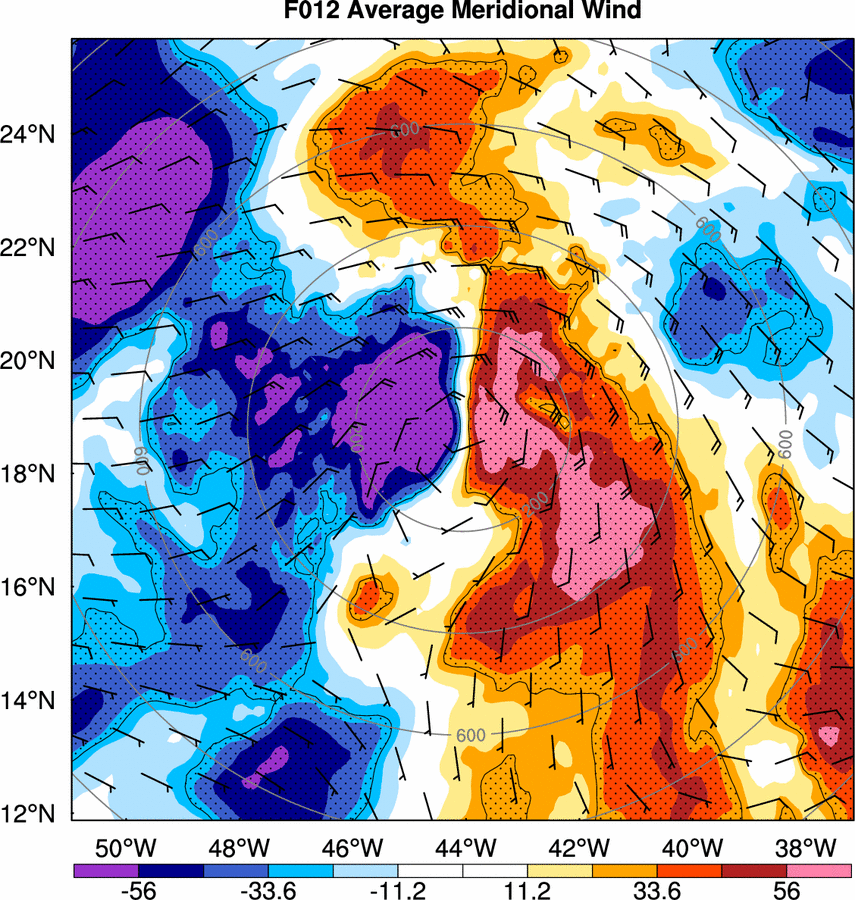
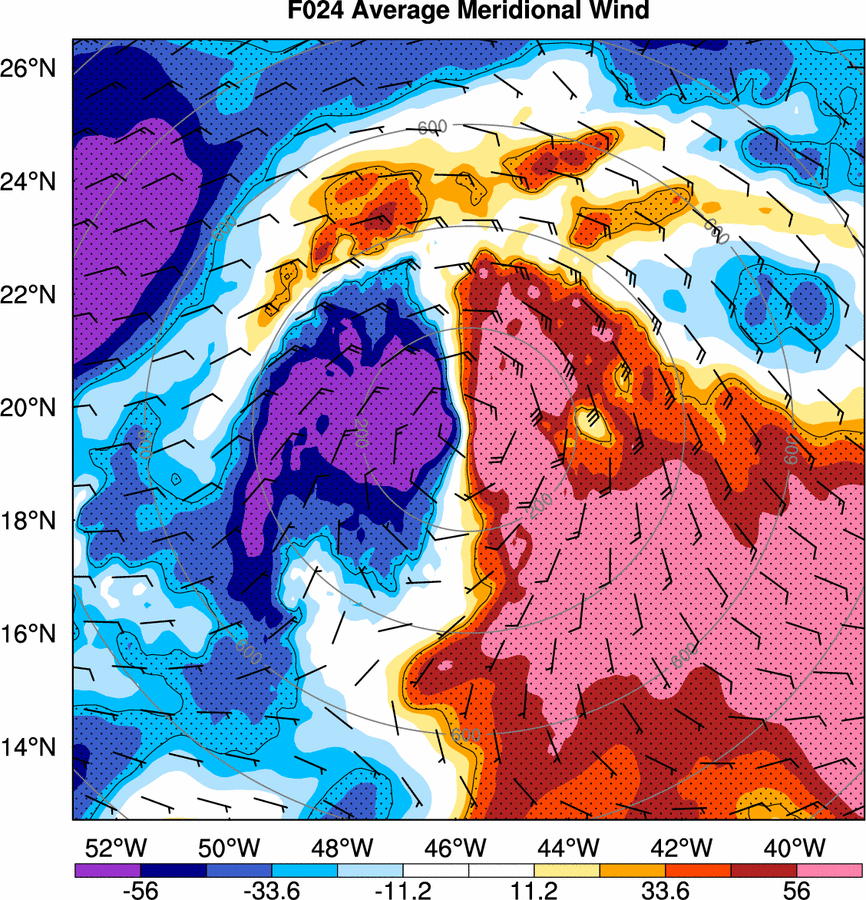
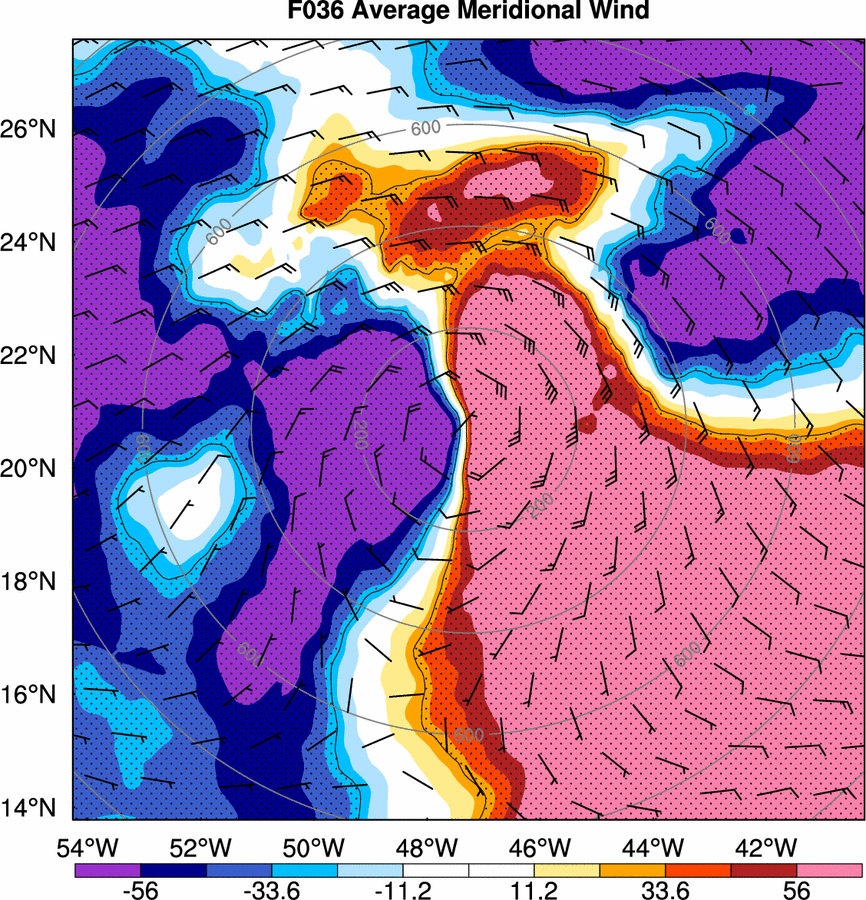
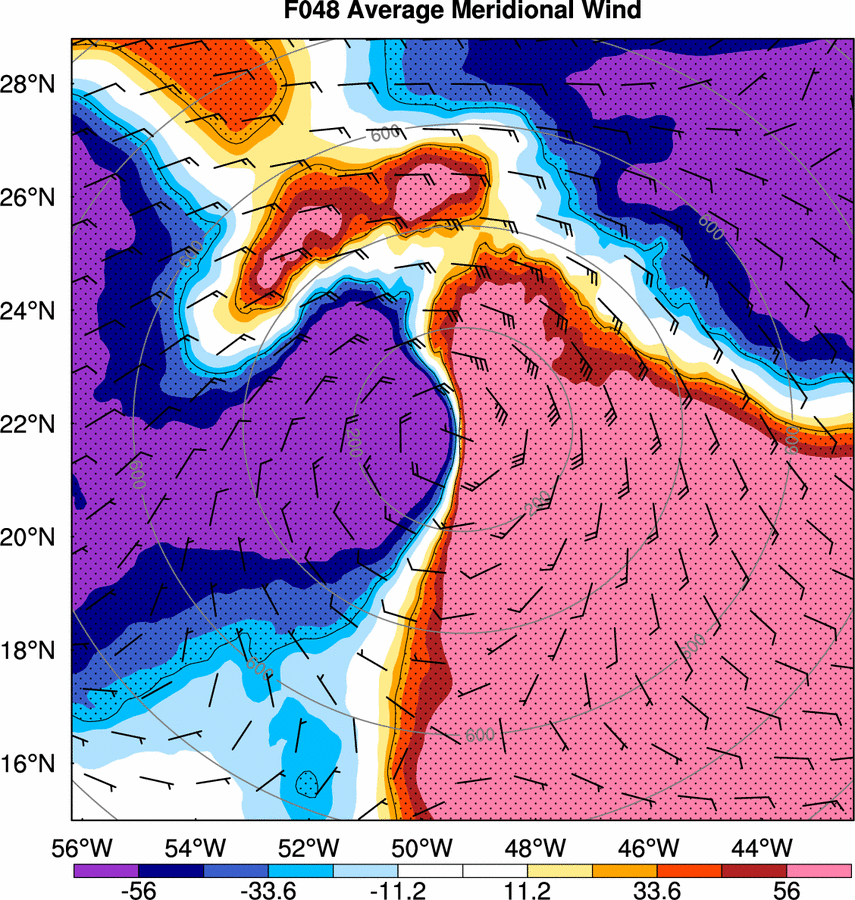
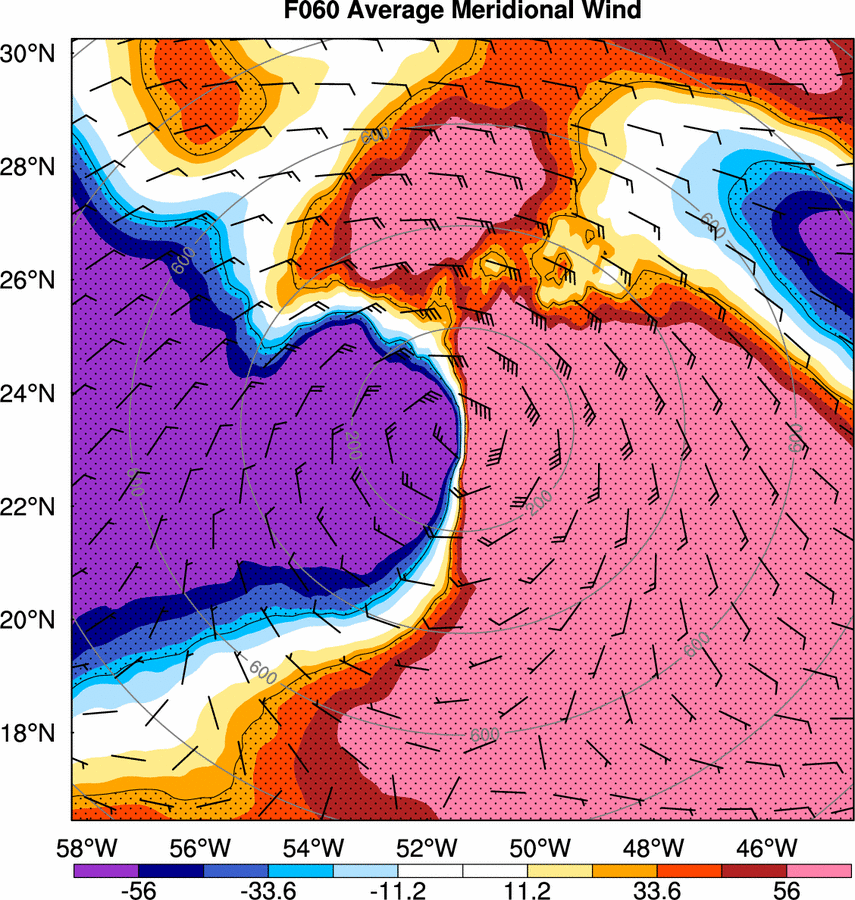
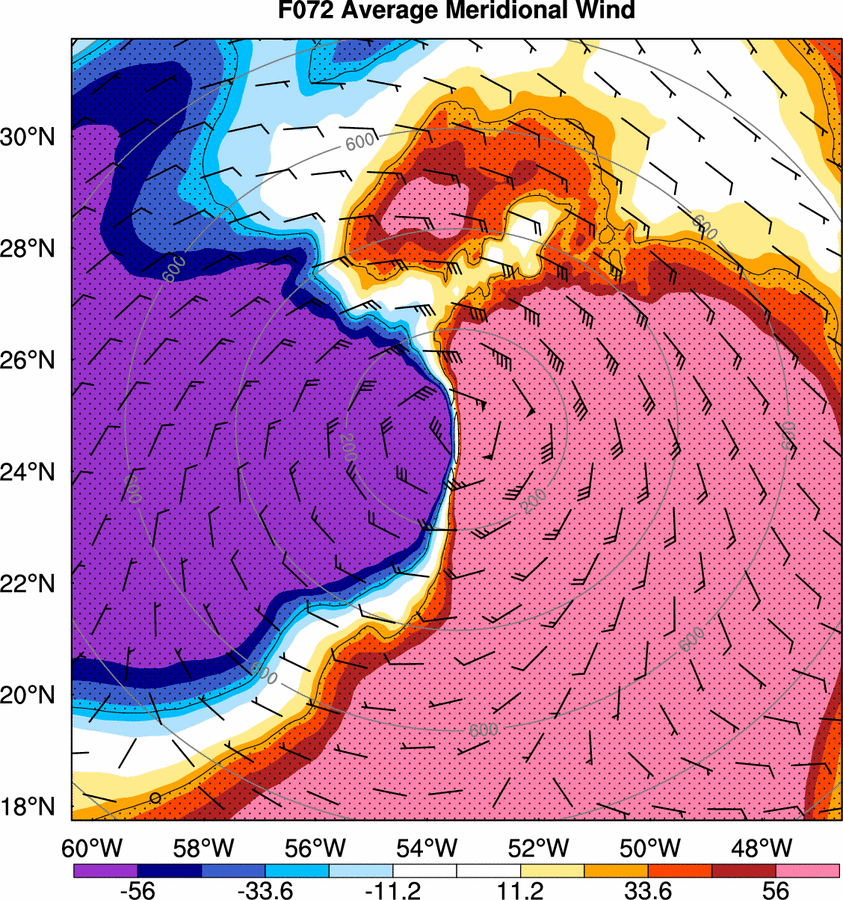
Mean Meridional Wind between 300-850 hPa, which is the typical TC steering level (units: m/s)Composite Diff. 000 012 024 036 048 060 072 Loop Sensitivity (dJ/dx) 000 012 024 036 048 060 072 Loop
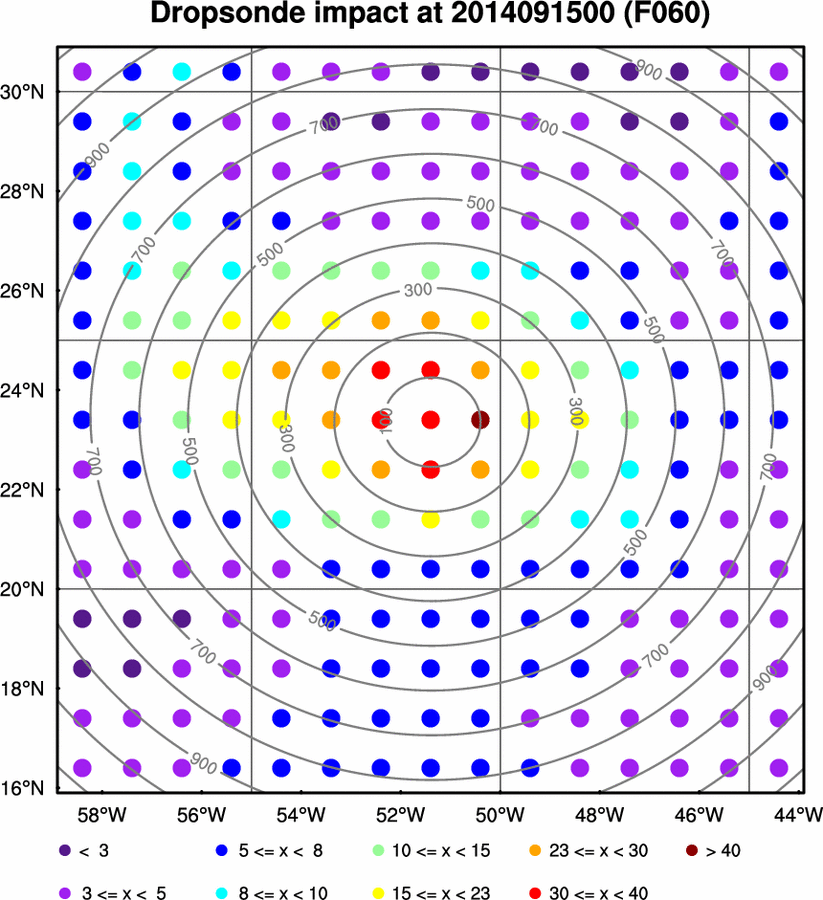
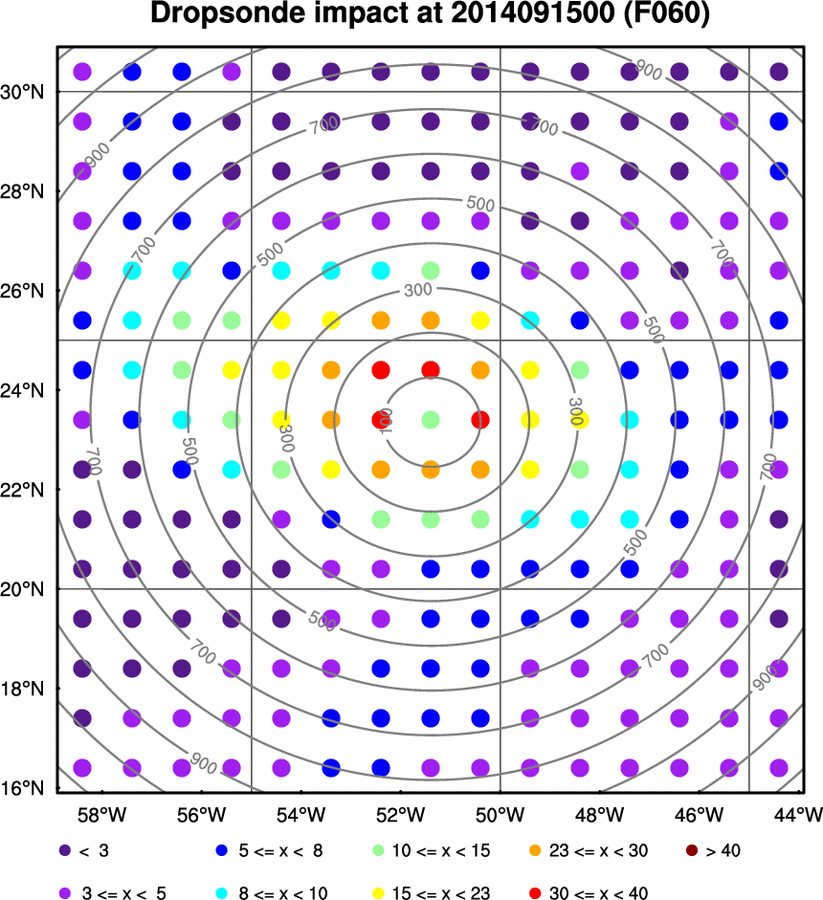
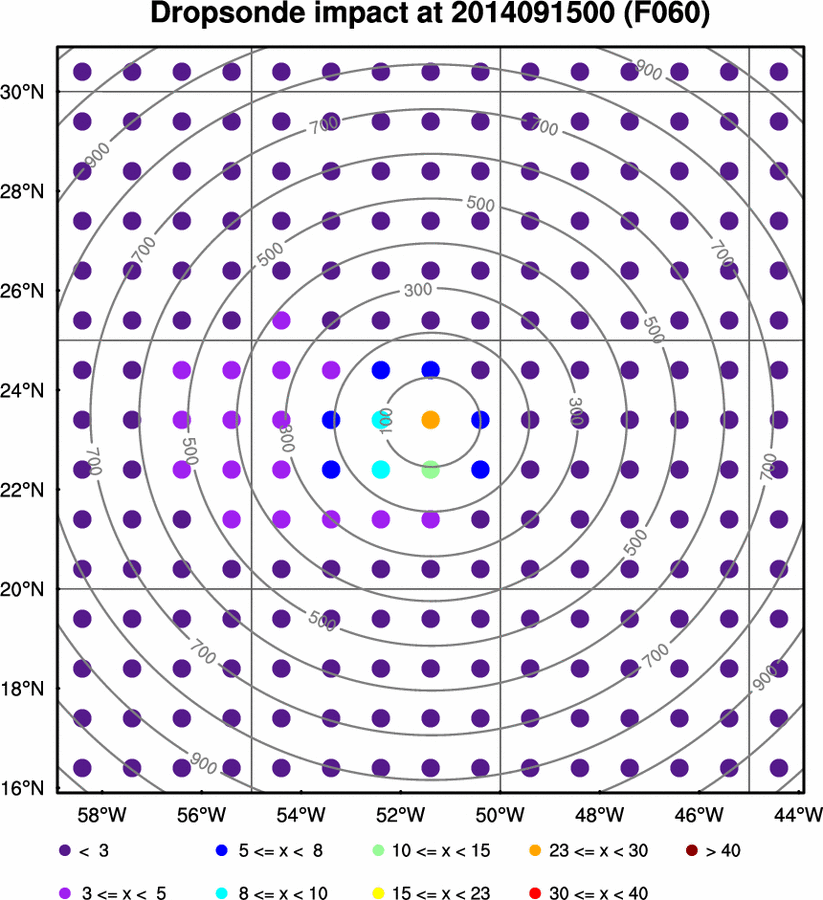
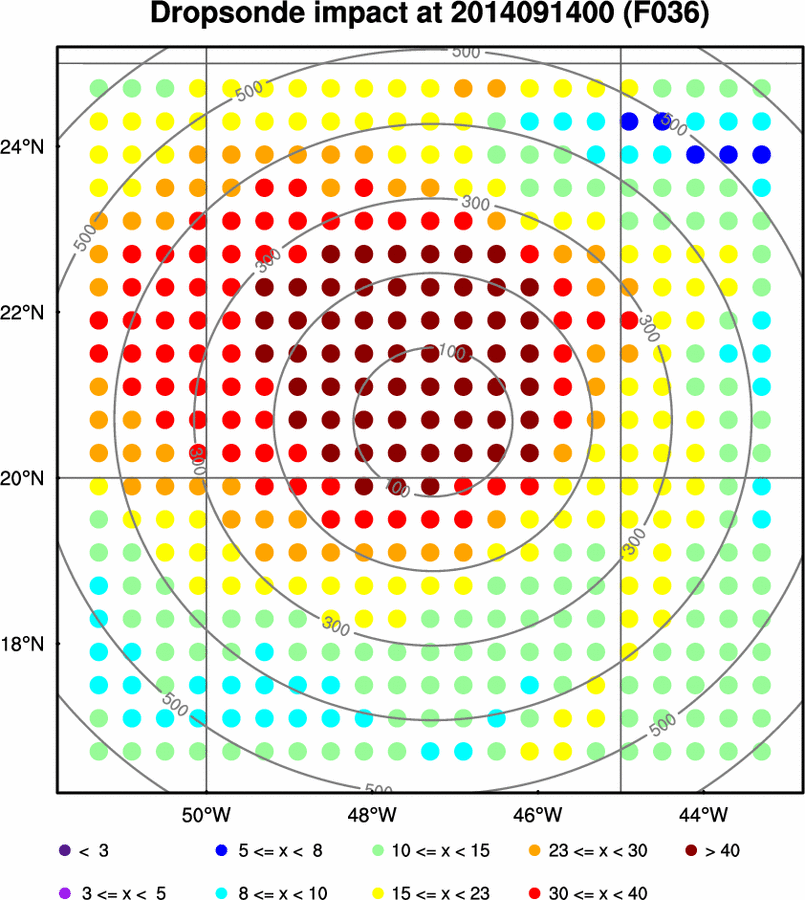
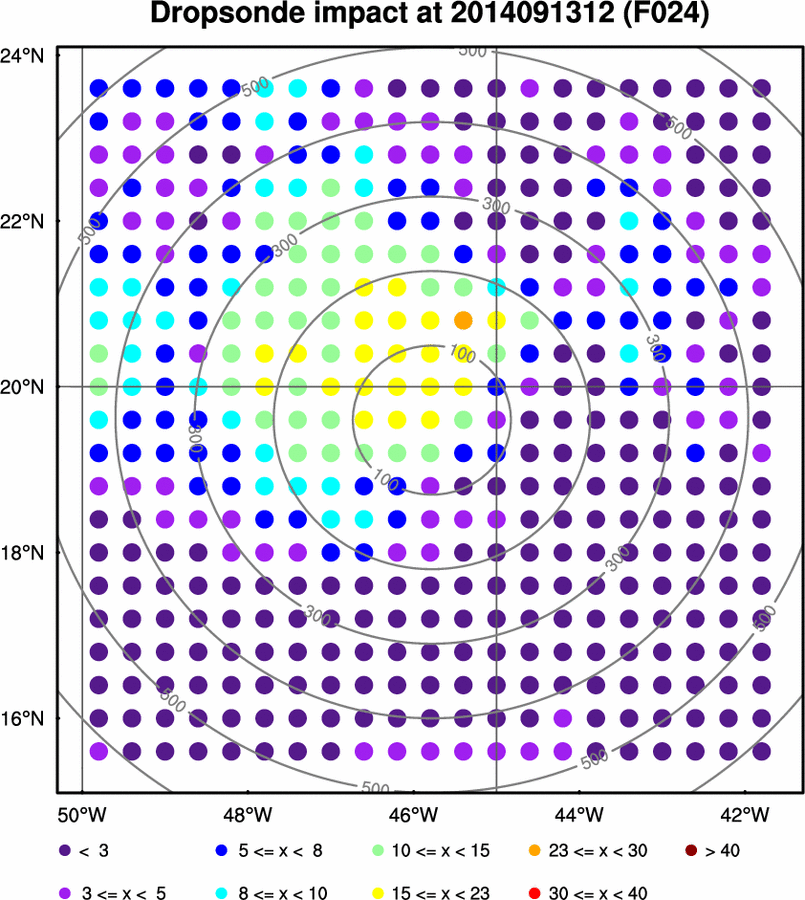
000 h (12/12) 012 h (13/00) 024 h (13/12) 036 h (14/00) 048 h (14/12) 060 h (15/00) 072 h (15/12) Loop All Dropsonde Observation Impact
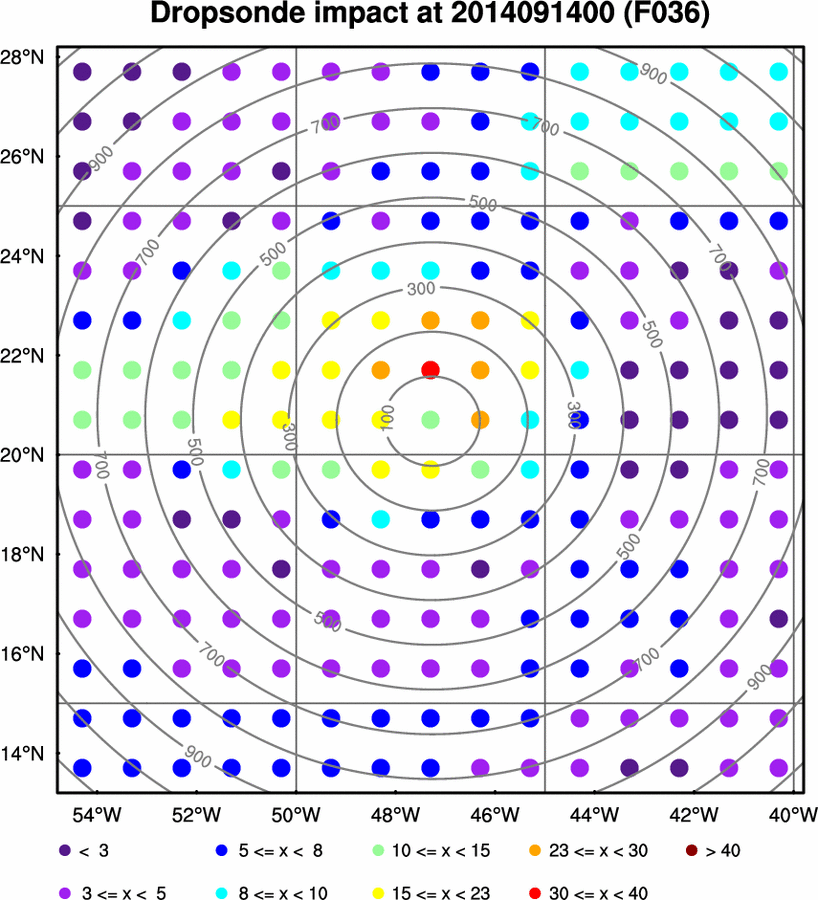
Hypothetical percentage reduction in forecast metric standard deviation due to assimilating all variables from dropsonde at that location.Dropsonde Impact 000 012 024 036 048 060 072 Loop Wind Dropsonde Observation Impact
Hypothetical percentage reduction in forecast metric standard deviation due to assimilating wind from dropsonde at that location.Dropsonde Impact 000 012 024 036 048 060 072 Loop Temp. Dropsonde Observation Impact
Hypothetical percentage reduction in forecast metric standard deviation due to assimilating temperature from dropsonde at that location.Dropsonde Impact 000 012 024 036 048 060 072 Loop RH Dropsonde Observation Impact
Hypothetical percentage reduction in forecast metric standard deviation due to assimilating RH from dropsonde at that location.Dropsonde Impact 000 012 024 036 048 060 072 Loop
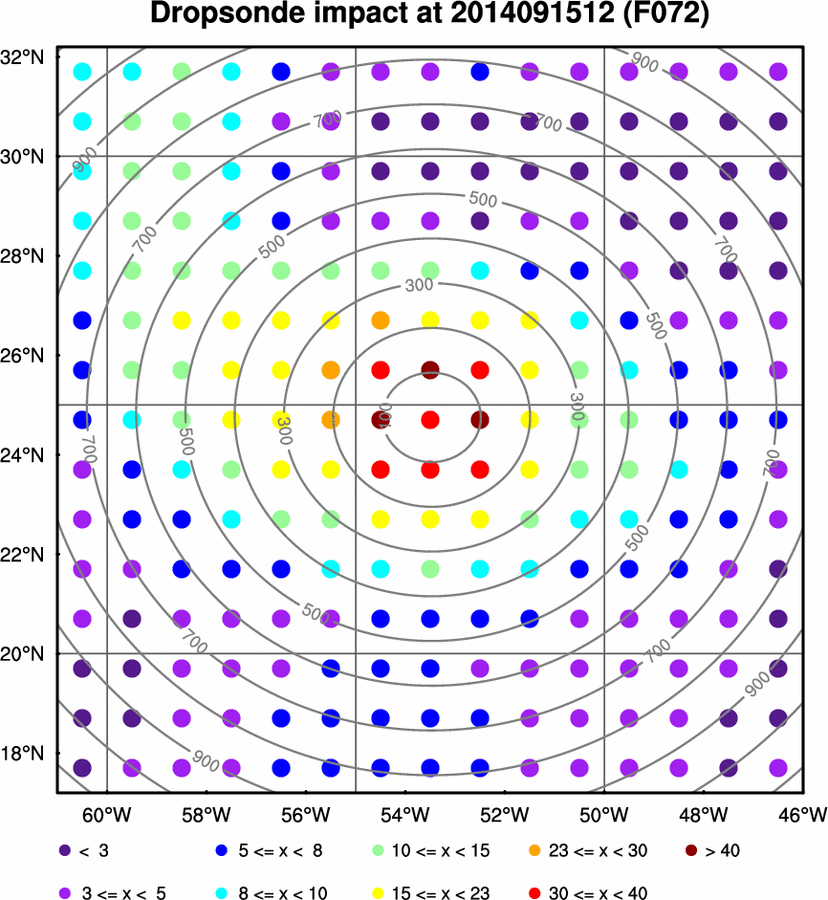
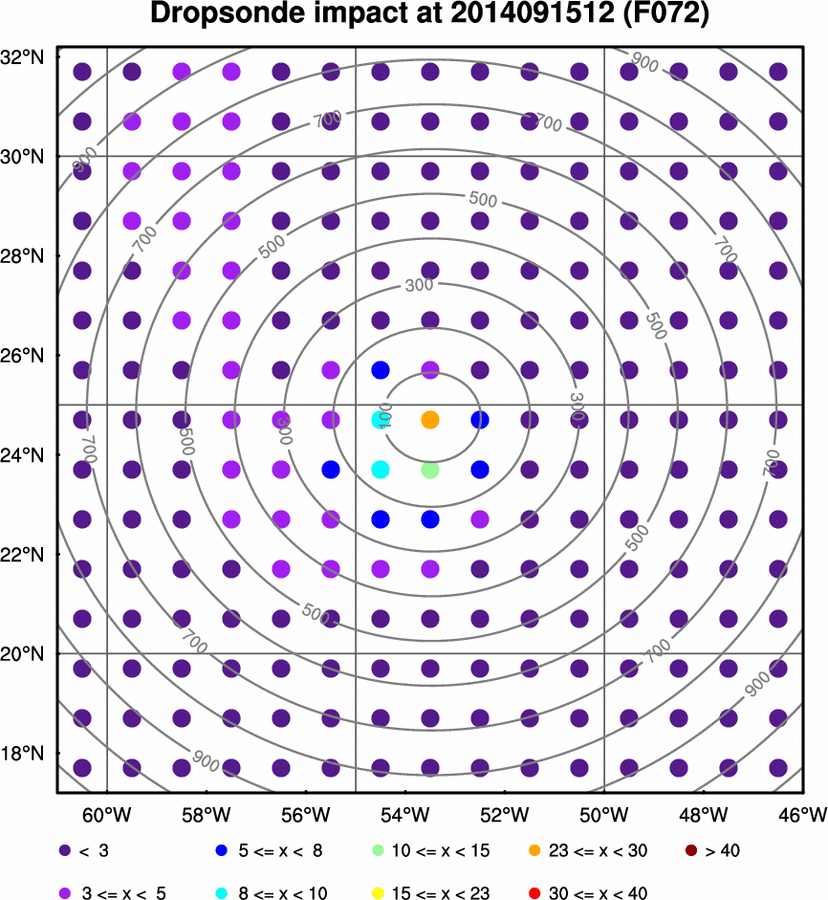
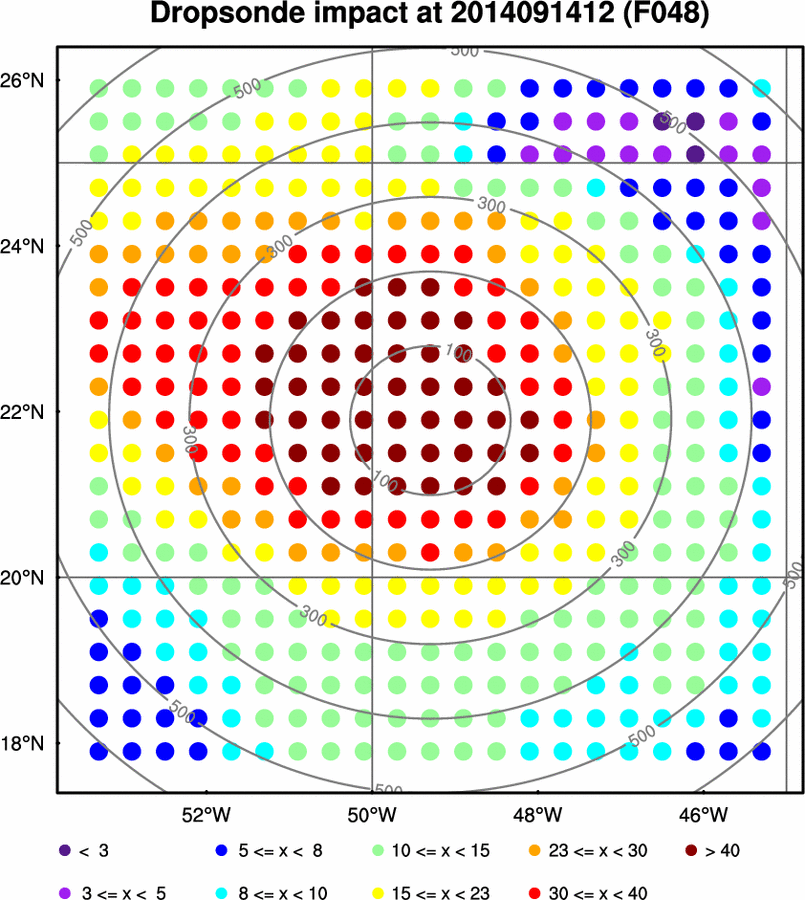
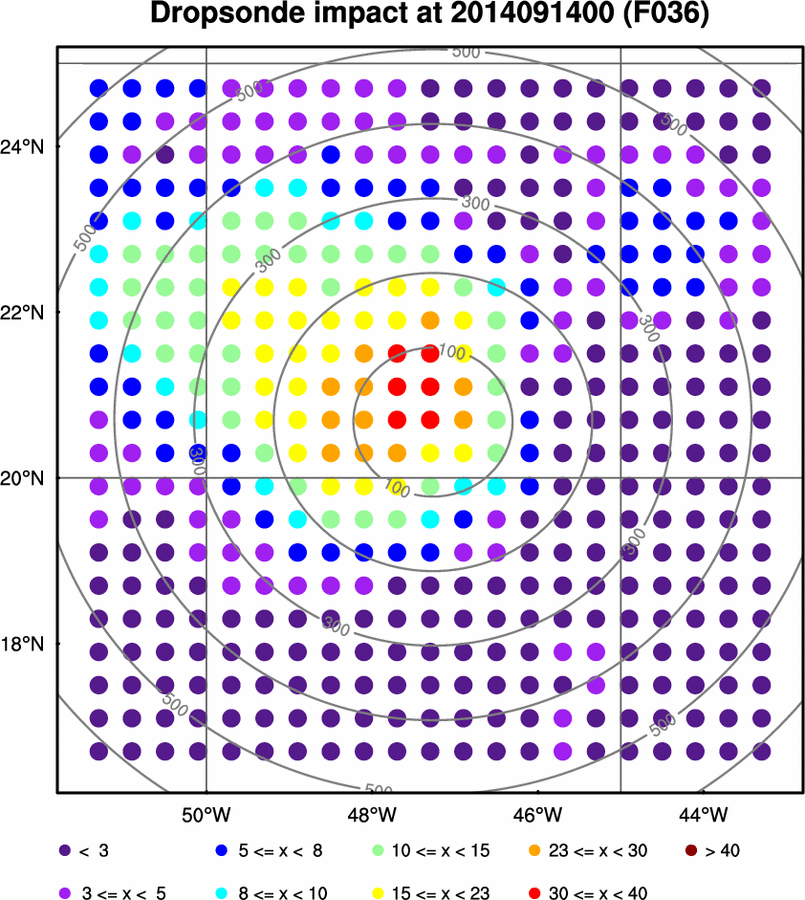
000 h (12/12) 012 h (13/00) 024 h (13/12) 036 h (14/00) 048 h (14/12) 060 h (15/00) 072 h (15/12) Loop All Dropsonde Observation Impact
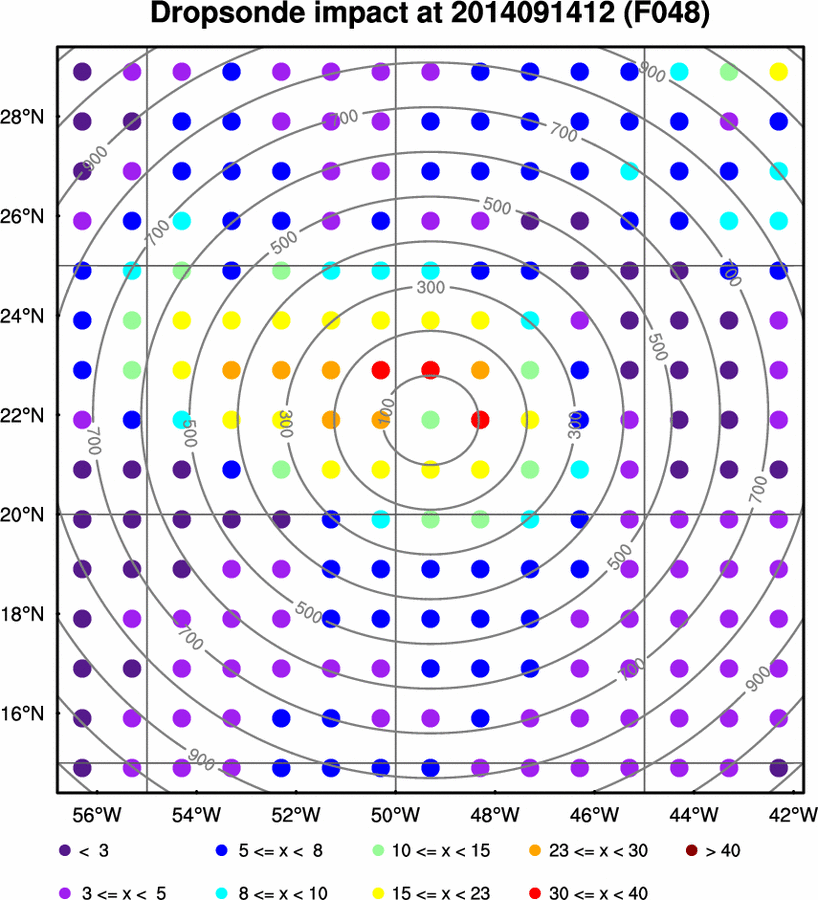
Hypothetical percentage reduction in forecast metric standard deviation due to assimilating all variables from dropsonde at that location.Dropsonde Impact 000 012 024 036 048 060 072 Loop Wind Dropsonde Observation Impact
Hypothetical percentage reduction in forecast metric standard deviation due to assimilating wind from dropsonde at that location.Dropsonde Impact 000 012 024 036 048 060 072 Loop Temp. Dropsonde Observation Impact
Hypothetical percentage reduction in forecast metric standard deviation due to assimilating temperature from dropsonde at that location.Dropsonde Impact 000 012 024 036 048 060 072 Loop RH Dropsonde Observation Impact
Hypothetical percentage reduction in forecast metric standard deviation due to assimilating RH from dropsonde at that location.Dropsonde Impact 000 012 024 036 048 060 072 Loop
- The date in the Table title is the forecast valid time (i.e., the date of the forecast that you are trying to improve.
- Composite Diff. is the normalized difference betweeen the mean of the 10 members with the largest metric value and the mean of the 10 members with the smallest metric value (shaded). The normalized difference is computed by taking the difference and dividing by the ensemble standard deviation. The contours or wind barbs are the ensemble mean values.
- Sensitivity is the change in the forecast metric value per one standard deviation change in the field at that location. Shaded field units are the same as the forecast metric.