HTML>
1988 WPAC gyre page for Dave Vollaro

Animation of Unfiltered 1000hPa wind height and relative vorticity. Every 6h from Jul 23-30 1988. (Contains gyre loc as determined from 1000mb hgt minima.)
Animation of Unfiltered 850hPa wind Temperature. Every 6h from Jul 23-30 1988
Animation of Unfiltered 500hPa wind Temperature. Every 6h from Jul 23-30 1988
Animation of Unfiltered 200hPa wind Temperature. Every 6h from Jul 23-30 1988
Animation of Unfiltered 850hPa wind Meridional Temperature flux. Every 6h from Jul 23-30 1988
Animation of Unfiltered 500hPa wind Meridional Temperature flux. Every 6h from Jul 23-30 1988
Animation of Unfiltered 200hPa wind Meridional Temperature flux. Every 6h from Jul 23-30 1988
Animation of SST with sfc wind vectors and Latent Heat flux. Every 6h from Jul 23-30 1988
Animation of CLAUS Brightness temp and 850hPa wind vectors. Daily from Jul 20-30 1988
Animation of Lopass 850hPa wind and relative vorticity. Daily from Jul 15-31 1988
Animation of Lopass 200hPa wind and relative vorticity. Daily from Jul 15-31 1988
Animation of Lopass 850hPa wind and divergence. Daily from Jul 15-31 1988
Animation of Lopass 200hPa wind and divergence. Daily from Jul 15-31 1988
Animation of 20DAY Lopass 850hPa wind and CLAUS IR. Daily from Jul 1 Aug 15 1988
Animation of 10DAY Lopass CLAUS IR. Daily from Jul 1 Sep 30 1988
Animation of 15DAY Lopass CLAUS IR. Daily from Jul 1 Sep 30 1988
Animation of 20DAY Lopass CLAUS IR. Daily from Jul 1 Sep 30 1988
Animation of 30DAY Lopass CLAUS IR. Daily from Jul 1 Sep 30 1988
Animation of 40DAY Lopass CLAUS IR. Daily from Jul 1 Sep 30 1988
Animation of 20DAY Lopass 850hPa relative vorticity and CLAUS IR. Daily from Jul 1 Aug 31 1988
Animation of 850hPa relative vorticity,wind and CLAUS IR. From Jul 1 Jul 31 1988
Animation of 850hPa relative vorticity,wind and CLAUS IR. From Jul 10 Aug 5 1988(vort 1,6,11x10-5)
Animation of 200hPa relative vorticity,wind and CLAUS IR. From Jul 10 Aug 5 1988(vort 1,6,11x10-5)
Animation of 500hPa relative vorticity,wind and CLAUS IR. From Jul 10 Aug 5 1988(vort 1,6,11x10-5)
Animation of 1000hPa relative vorticity,wind and CLAUS IR. From Jul 10 Aug 5 1988(vort 1,6,11x10-5)
Animation of 150hPa relative vorticity,wind and CLAUS IR. From Jul 10 Aug 5 1988(vort 1,6,11x10-5)
Animation of 1000hPa relative vorticity,wind and CLAUS IR. From Jul 23 Jul 29 1988(inc= 1x10⁻⁵)
Animation of 850hPa relative vorticity,wind and CLAUS IR. From Jul 23 Jul 29 1988(inc= 1x10⁻⁵)
Animation of 700hPa relative vorticity,wind and CLAUS IR. From Jul 23 Jul 29 1988(inc= 1x10⁻⁵)
Animation of 500hPa relative vorticity,wind and CLAUS IR. From Jul 23 Jul 29 1988(inc= 1x10⁻⁵)
Animation of 200hPa relative vorticity,wind and CLAUS IR. From Jul 23 Jul 29 1988(inc= 1x10⁻⁵)
Animation of 1000hPa relative vorticity(shaded) and wind. From Jul 23 Jul 29 1988
Animation of 850hPa relative vorticity(shaded) and wind. From Jul 23 Jul 29 1988
Animation of 500hPa relative vorticity(shaded) and wind. From Jul 23 Jul 29 1988
Animation of 300hPa relative vorticity(shaded) and wind. From Jul 23 Jul 29 1988
Animation of 200hPa relative vorticity(shaded) and wind. From Jul 23 Jul 29 1988
Animation of PV,Pres and wind on 345K Isentropic sfc. Every 6h from Jul 27-28 1988
Animation of PV,Pres and wind on 355K Isentropic sfc. Every 6h from Jul 27-28 1988
Animation of PV and wind on 350K Isentropic sfc. Every 6h from Jul 21-30 1988
Animation of PV and wind on 345K Isentropic sfc. Every 6h from Jul 21-30 1988
Animation of PV and wind on 340K Isentropic sfc. Every 6h from Jul 21-30 1988
Animation of PV and wind on 335K Isentropic sfc. Every 6h from Jul 21-30 1988
Animation of PV and wind on 330K Isentropic sfc. Every 6h from Jul 21-30 1988
Animation of PV and wind on 350K sfc with contours of 850 vorticity. Every 6h from Jul 19-27 1988
Animation of Blown-up region of PV and wind on 350K sfc with contours of 850 vorticity. Every 6h from Jul 19-27 1988
Animation of PV and wind on 350K Isentropic sfc. Every 6h from Jul 21-30 1988
Animation of PV and wind on 345K Isentropic sfc. Every 6h from Jul 21-30 1988
Animation of PV and wind on 340K Isentropic sfc. Every 6h from Jul 21-30 1988
Animation of PV and wind on 335K Isentropic sfc. Every 6h from Jul 21-30 1988
Animation of 1000-500hPa wind with Claus IR and contours of 850hPa vorticity. Every 6h from Jul 19-27 1988
Animation of 1000-400hPa wind with Claus IR and contours of 850hPa vorticity. Every 6h from Jul 19-27 1988
4-panel images of Q-VECTOR calculations(gauswt=25deg) every 12h 7/16/88 - 7/31/88.
4-panel images of Q-VECTOR calculations(gauswt=15deg) for 3 layers every 12h 7/16/88 - 7/31/88.
4-panel images of upper/lower QVEC div and Velocity potential(gauswt=15deg) every 12h 7/16/88 - 7/31/88.
4-panel images of upper level QVEC divergence(gauswt=15deg) at several levs every 12h 7/24/88 - 7/30/88.
Images of 400-200hPa layer-avg QVEC divergence(gauswt=15deg) every 12h 7/24/88 - 7/30/88.(larger map)
4-panel images of upper level QVEC divergence(gauswt=15deg) at several levs every 12h 7/24/88 - 7/30/88(larger map).
Loop of 200hpa relvort+wind overlayed w/contours of upper level QVEC divergence(gauswt=15deg) every 6h 7/24/88 - 7/28/88.
Loop of 200hpa Velocity potenital and IR overlayed w/contours of 200mb windspeed every 12h 6/20/88 - 7/25/88.
Animation of Relative vorticity,wind and CLAUS IR at 1000,850,700,500,150hPa. Averaged from 00UTC Jul 16th to 00UTC Jul23 1988
Animation of Divergence,wind and CLAUS IR at 1000,850,700,500,150hPa. Averaged from 00UTC Jul 16th to 00UTC Jul23 1988
Animation of Temp,wind and CLAUS IR at 1000,850,700,500,150hPa. Averaged from 00UTC Jul 16th to 00UTC Jul23 1988
Animation of RH,wind and CLAUS IR at 1000,850,700,500,150hPa. Averaged from 00UTC Jul 16th to 00UTC Jul23 1988
Animation of RH(40,60,80),wind and CLAUS IR at 1000,850,700,500,150hPa. Averaged from 00UTC Jul 16th to 00UTC Jul23 1988
Animation of Deformation,wind and CLAUS IR at 1000,850,700,500,150hPa. Averaged from 00UTC Jul 16th to 00UTC Jul23 1988
Animation of Percentage of time brightness < 210,220,230K. Averaged from 00UTC Jul 16th to 00UTC Jul23 1988
br>
Animation of Relative vorticity,wind and CLAUS IR at 1000,850,700,500,150hPa. Averaged from 18UTC Jul 25th to 18UTC Jul28 1988
Animation of Divergence,wind and CLAUS IR at 1000,850,700,500,150hPa. Averaged from 18UTC Jul 25th to 18UTC Jul28 1988
Animation of Temp,wind and CLAUS IR at 1000,850,700,500,150hPa. Averaged from 18UTC Jul 25th to 18UTC Jul28 1988
Animation of RH(40,60,80),wind and CLAUS IR at 1000,850,700,500,150hPa. Averaged from 18UTC Jul 25th to 18UTC Jul28 1988
Animation of Deformation,wind and CLAUS IR at 1000,850,700,500,150hPa. Averaged from 18UTC Jul 25th to 18UTC Jul28 1988
Animation of Percentage of time brightness < 210,220,230K. Averaged from 18UTC Jul 25th to 18UTC Jul28 1988
br>
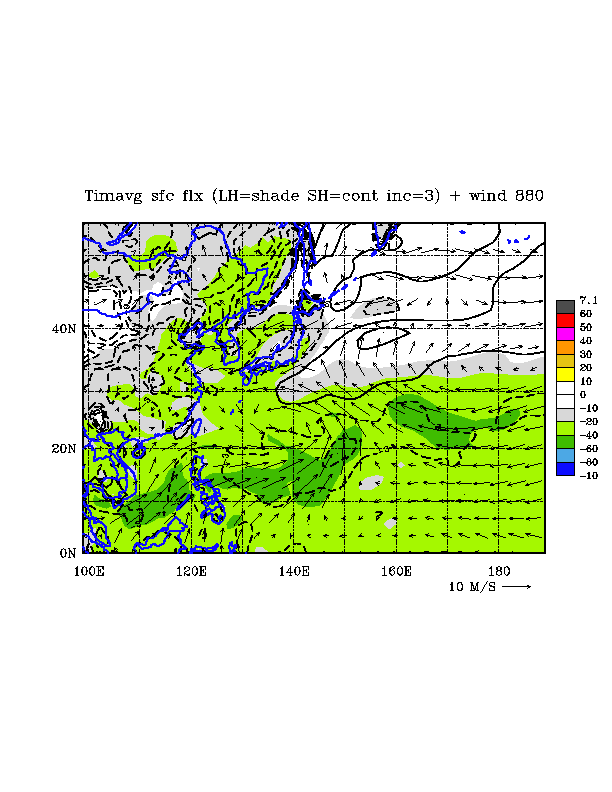
Plot of sfc fluxes and wind(neg vals = upward flux). Averaged from 18UTC Jul 25th to 18UTC Jul28 1988
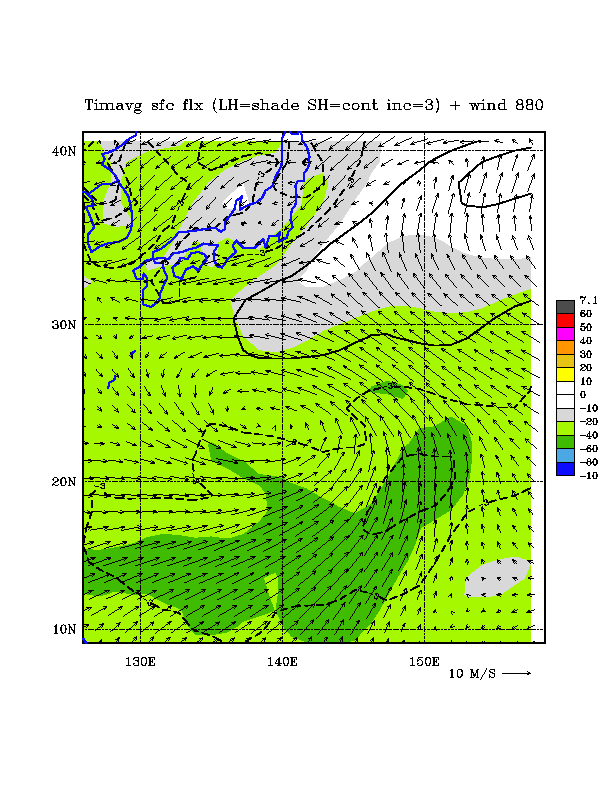
Plot of sfc fluxes and wind(neg vals = upward flux). Averaged from 18UTC Jul 25th to 18UTC Jul28 1988 Blown up region
Animation of Surface PMSL and winds with height gyre location estimates. From Jul 24 Jul 29 1988
Animation of 1000hPa heights and winds with vort and height gyre location estimates. From Jul 24 Jul 29 1988
Animation of 850hPa heights and winds with vort and height gyre location estimates. From Jul 24 Jul 29 1988
Animation of 500hPa heights and winds with vort and height gyre location estimates. From Jul 24 Jul 29 1988
Track of West Gyre from various estimates. From Jul 23 Jul 29 1988
Animation of South/North vertical xsec of Zonal wind for West center. Every 6h from Jul 23-30 1988.
Animation of South/North vertical xsec of Temperature for West center. Every 6h from Jul 23-30 1988.
Animation of South/North vertical xsec of Height for West center. Every 6h from Jul 23-30 1988.
Animation of South/North vertical xsec of Rel Humidity for West center. Every 6h from Jul 23-30 1988.
Animation of West/East vertical xsec of Meridional wind for West center. Every 6h from Jul 23-30 1988.
Animation of West/East vertical xsec of Temperature for West center. Every 6h from Jul 23-30 1988.
Animation of West/East vertical xsec of height for West center. Every 6h from Jul 23-30 1988.
Animation of West/East vertical xsec of Rel Humidity for West center. Every 6h from Jul 23-30 1988.
Animation of South/North vertical xsec of Zonal wind for East center. Every 6h from Jul 23-30 1988.
Animation of South/North vertical xsec of Temperature for East center. Every 6h from Jul 23-30 1988.
Animation of South/North vertical xsec of Height for East center. Every 6h from Jul 23-30 1988.
Animation of South/North vertical xsec of Rel Humidity for East center. Every 6h from Jul 23-30 1988.
Animation of West/East vertical xsec of Meridional wind for East center. Every 6h from Jul 23-30 1988.
Animation of West/East vertical xsec of Temperature for East center. Every 6h from Jul 23-30 1988.
Animation of West/East vertical xsec of height for East center. Every 6h from Jul 23-30 1988.
Animation of West/East vertical xsec of Rel Humidity for East center. Every 6h from Jul 23-30 1988.
Cylindrical Plan Animations
Animation of Plan plot of 850hPa Radial wind for West center. Every 6h from Jul 23-30 1988.
Animation of Plan plot of 850hPa Tangential wind for West center. Every 6h from Jul 23-30 1988.
Animation of Plan plot of 850hPa Relative Vorticity for West center. Every 6h from Jul 23-30 1988.
Animation of Plan plot of SFC Radial wind for West center. Every 6h from Jul 23-30 1988.
Animation of Plan plot of SFC Tangential wind for West center. Every 6h from Jul 23-30 1988.
Animation of Plan plot of SFC Relative Vorticity for West center. Every 6h from Jul 23-30 1988.
Animation of Plan plot of 850hPa Temperature for West center. Every 6h from Jul 26-30 1988.
Animation of Plan plot of 700hPa Temperature for West center. Every 6h from Jul 26-30 1988.
Animation of Plan plot of 500hPa Temperature for West center. Every 6h from Jul 26-30 1988.
Animation of Plan plot of 200hPa Temperature for West center. Every 6h from Jul 26-30 1988.
Animation of Plan plot of 850hPa Radial wind for East center. Every 6h from Jul 23-30 1988.
Animation of Plan plot of 850hPa Tangential wind for East center. Every 6h from Jul 23-30 1988.
Animation of Plan plot of 850hPa Relative Vorticity for East center. Every 6h from Jul 23-30 1988.
Large Scale Hovmoellers
Longitude Hovmoeller of 200hPa Zonal wind averaged over various latitude bands. Every 12h from Jun 15 - Aug 15 1988.
Longitude Hovmoeller of 200hPa Meridional wind averaged over various latitude bands. Every 12h from Jun 15 - Aug 15 1988.
Longitude Hovmoeller of 200hPa height averaged over various latitude bands. Every 12h from Jun 15 - Aug 15 1988.
Gyre centered Hovmoellers
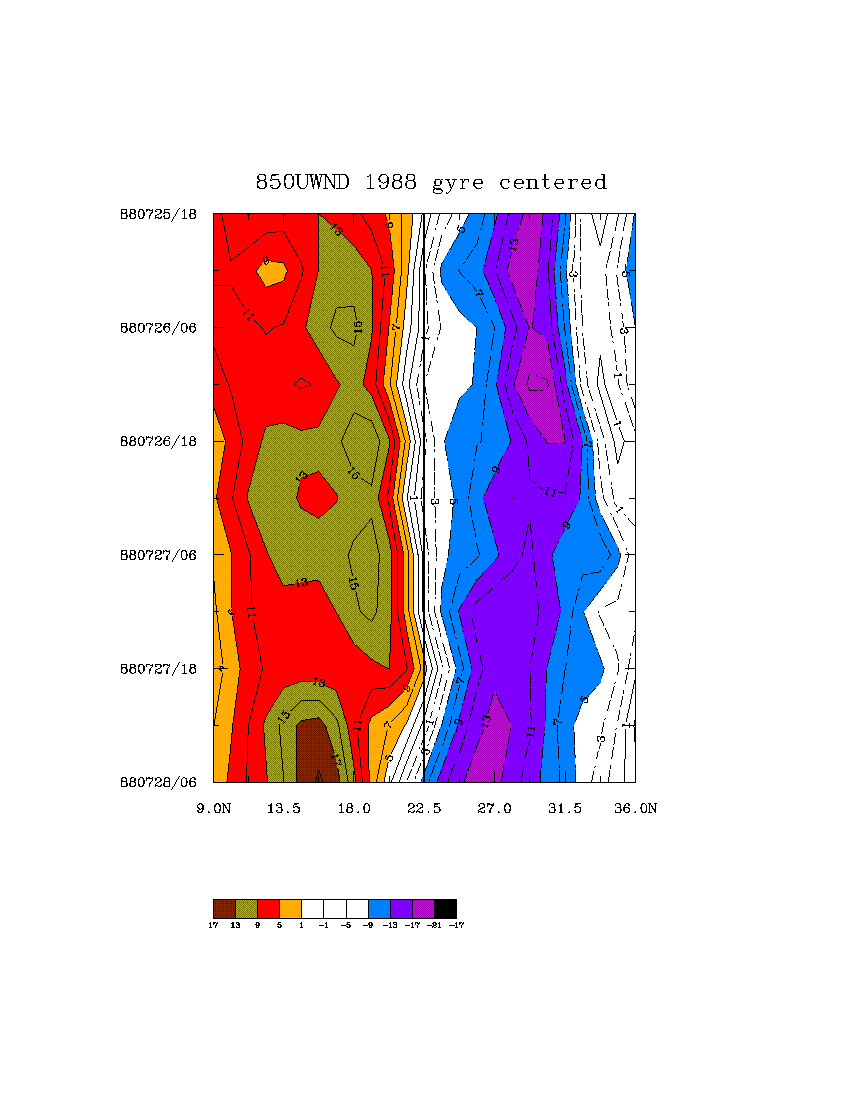
Latitude Hovmoeller of 850hPa Zonal wind centered on gyre lon. Every 6h from Jul 25-29 1988.
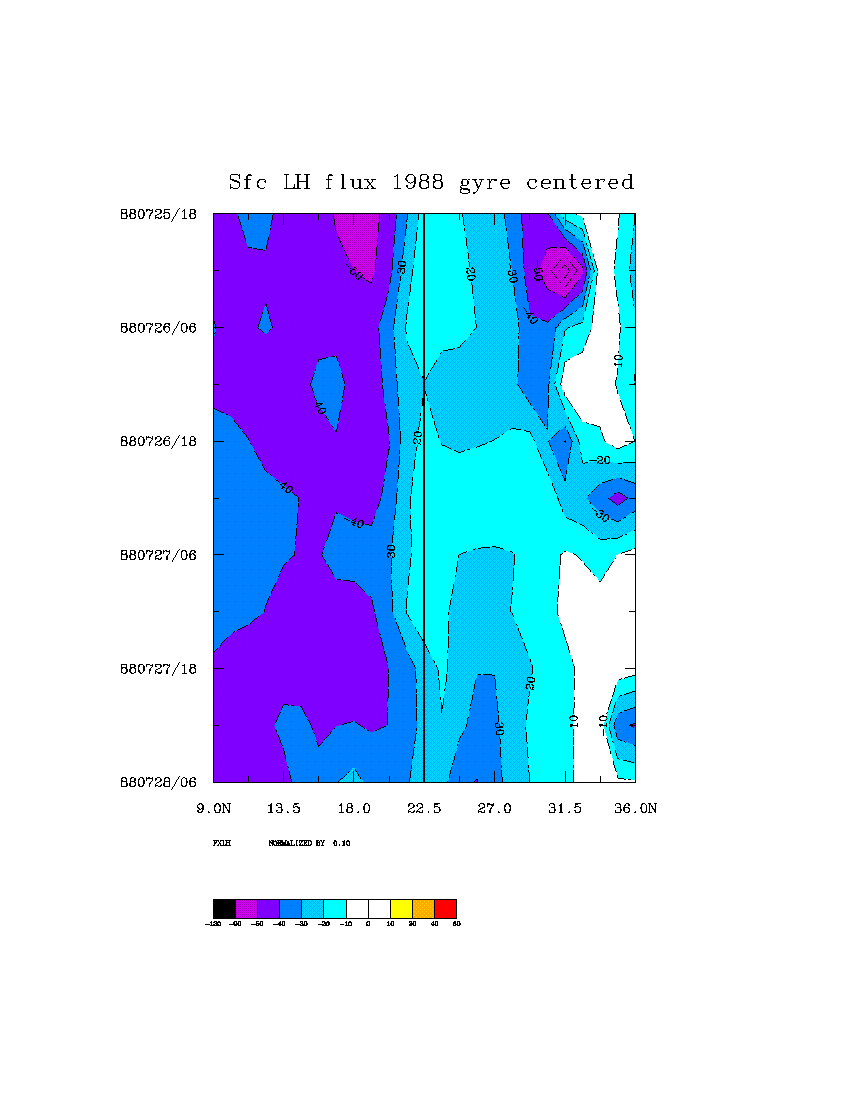
Latitude Hovmoeller of Sfc Latent Heat fluxcentered on gyre lon. Every 6h from Jul 25-29 1988.
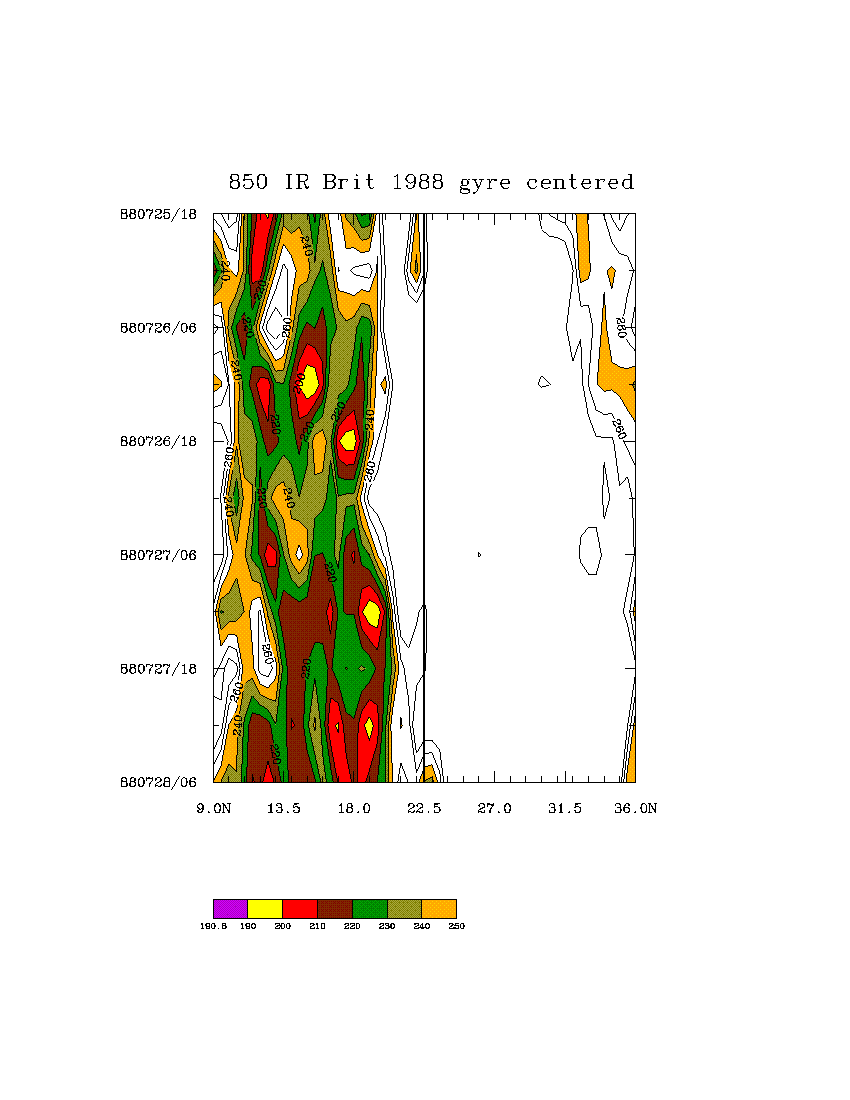
Latitude Hovmoeller of IR brightness temp centered on gyre lon. Every 6h from Jul 25-29 1988.
Gyre centered anomaly fields
from Jordan mean Hurrseason sounding
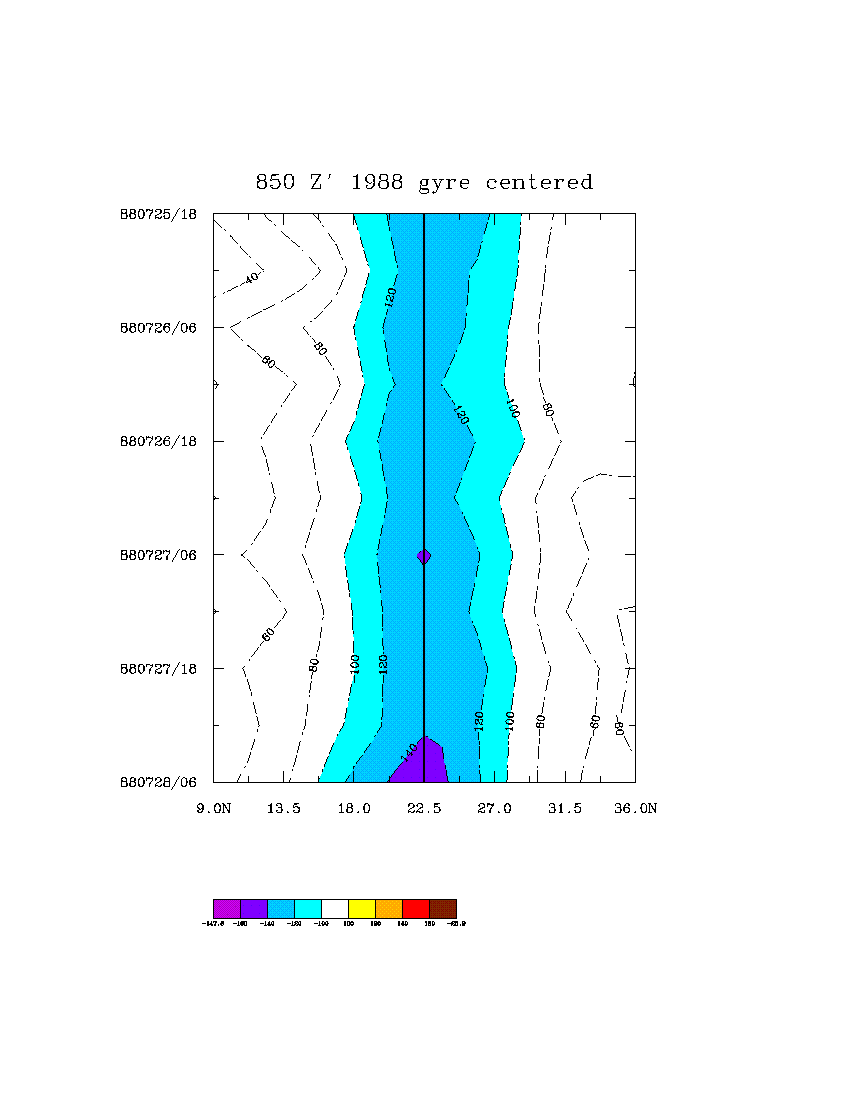
Latitude Hovmoeller of 850hPa Height anomaly centered on gyre lon. Every 6h from Jul 25-29 1988.
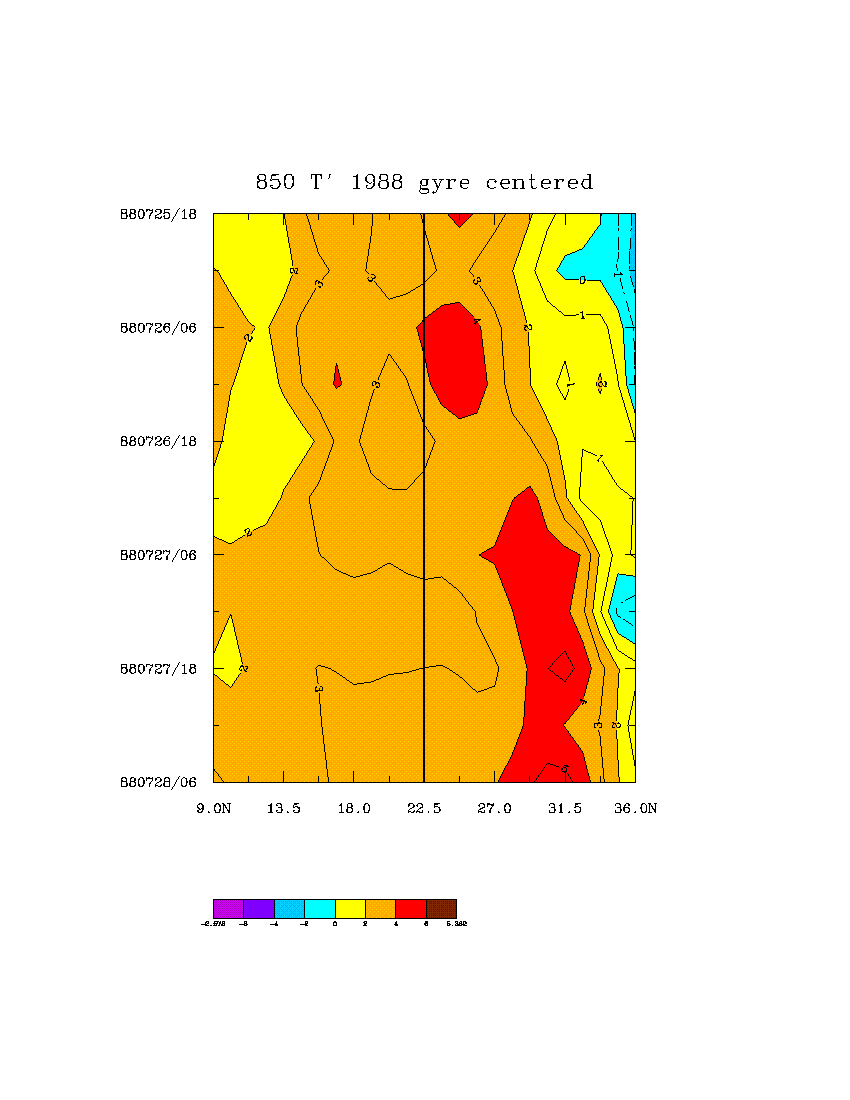
Latitude Hovmoeller of 850hPa Temp anomaly centered on gyre lon. Every 6h from Jul 25-29 1988.
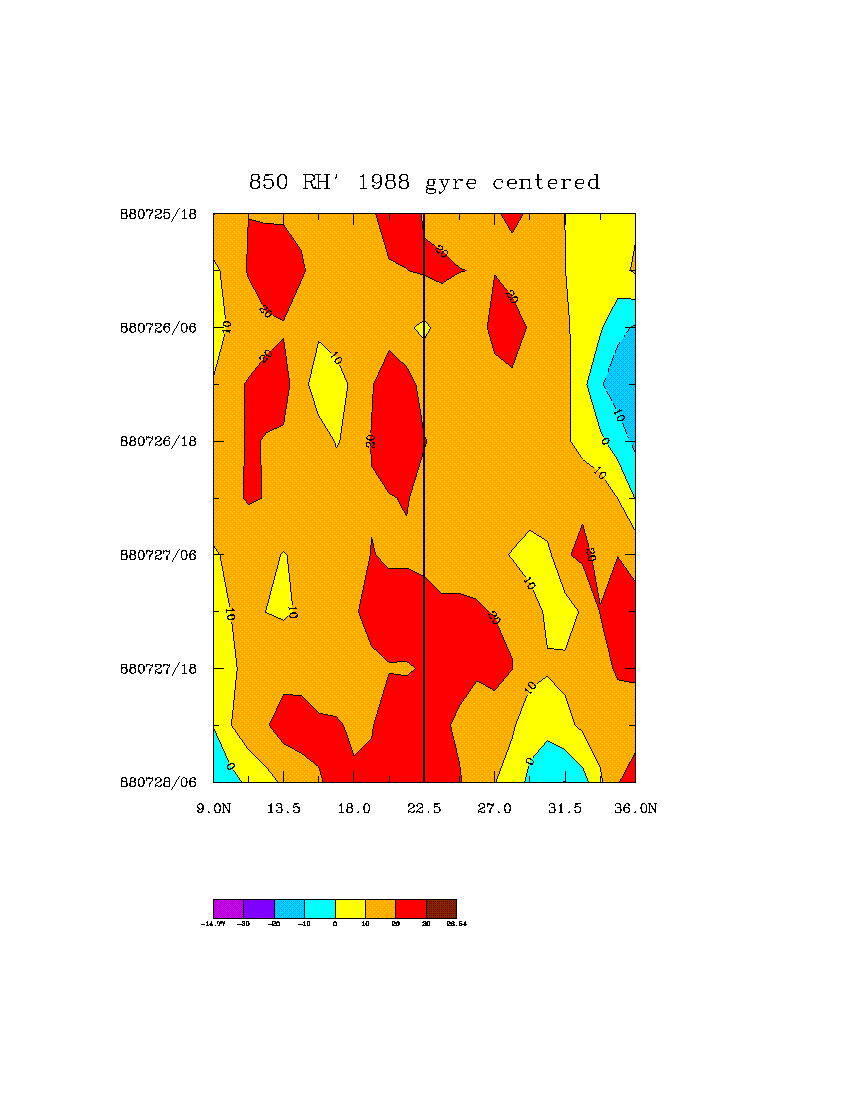
Latitude Hovmoeller of 850hPa Relative Humidity anomaly centered on gyre lon. Every 6h from Jul 25-29 1988.
Animation of South/North vertical xsec of Height anomaly for West center. Every 6h from Jul 25-29 1988.
Animation of South/North vertical xsec of Temp anomaly for West center. Every 6h from Jul 25-29 1988.
Animation of South/North vertical xsec of Rel Humidity anomaly for West center. Every 6h from Jul 25-29 1988.
NOTE: Jordan sounding spec humidity only extends to 450hPa. For profiles of RH anomaly cross sections combined with total RH field above 450hPa clickhere.
Radius-Time plots
R-T plots of azimuthally avg Radial wind for West center for several pressure levs. Every 6h from Jul 23-29 1988.
R-T plots of azimuthally avg tangential wind for West center for several pressure levs. Every 6h from Jul 23-29 1988.
R-T plots of azimuthally avg Eddy Momentum Flux Convergence for West center for several pressure levs. Every 6h from Jul 23-29 1988.
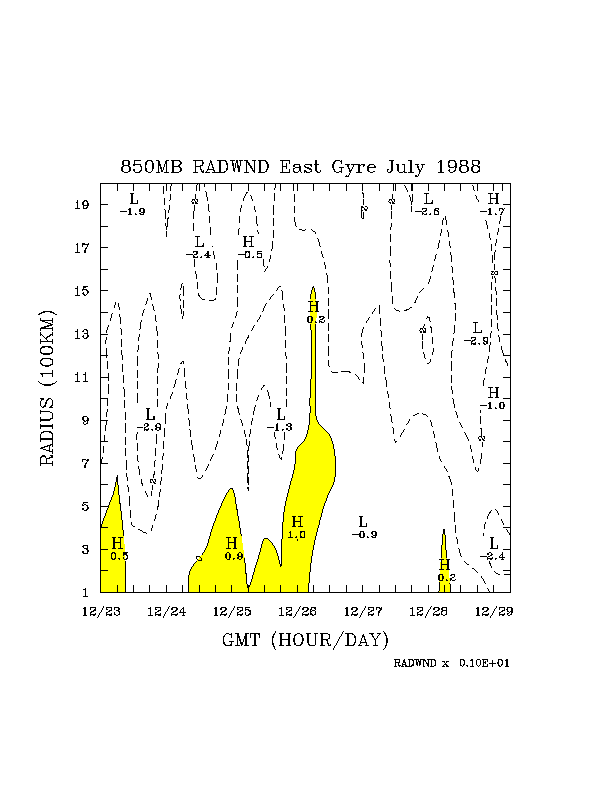
R-T plot of azimuthally avg 850hPa Radial wind for East center. Every 6h from Jul 23-29 1988.
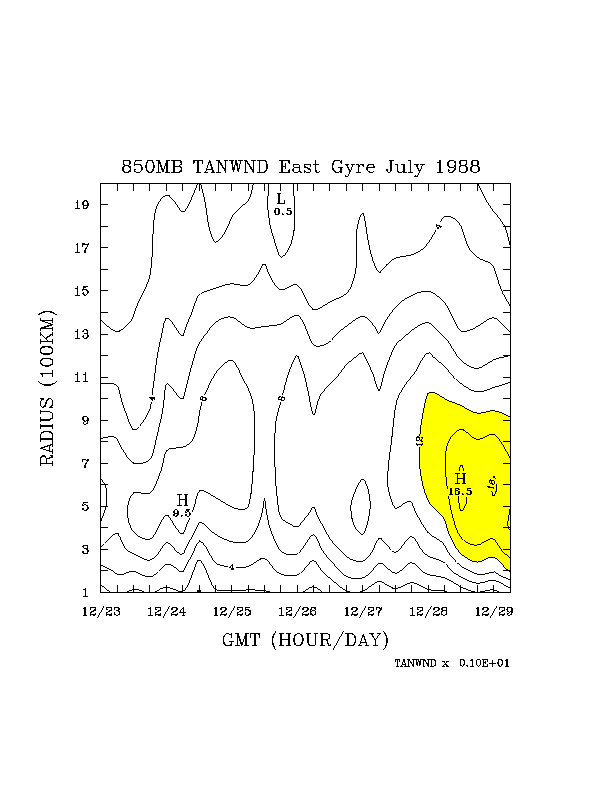
R-T plot of azimuthally avg 850hPa Tangential wind for East center. Every 6h from Jul 23-29 1988.
25day E-Vector and Timavg Plots
Values averaged over 3 25day periods
6/06-6/30 7/01-7/25 7/26-8/19
Animation of 200hPa wind.
Animation of 850hPa wind .
Animation of 200hPa E-Vectors and Zonal wind.
Animation of 200hPa E-Vectors and E-Vec divergence.
New Calcs 2012
Animation of sfc wind and thetae 8/24/00 - 8/29/12UTC.
Animation of sfc wind and latent heat flux 8/27/00 - 8/27/1800UTC.
Animation of 900-1200km avg 850hPa circulation at each gridpt 8/24/00 - 8/29/12UTC.
Other Images
Molinari.et.al presentation at AMS conference in San Antonio Jan 2007..
Return to wpac page.