|
Possible Impacts of Wind Farms
on Local Land Surface Temperature |
||||
|
|
||||
|
|
·
Press Release o Nature o
NASA o
NSF o UAlbany
o
BBC o Discover o
ENN o
Reuters
o
Science o
United
Press International (UPI) o Liming Zhou, Yuhong Tian, Somnath Baidya Roy, Chris Thorncroft, Lance F. Bosart and
Yuanlong Hu, Impacts of wind farms on land surface
temperature, Nature Climate Change,
DOI: 10.1038/NCLIMATE1505, Published online on 29 April 2012 The authors would like to provide answers
to several frequently asked questions about this research. What is the major
finding of this research? This study presents the first observational evidence of
wind farm impacts on land surface temperature with spatial detail using
satellite data. What is land
surface temperature? Land surface temperature is how hot the “surface” of
the Earth would feel to the touch in a particular location. From a
satellite’s point of view, the “surface” is whatever it sees when it looks
through the atmosphere to the ground. It could be snow and ice, the grass on
a lawn, the roof of a building, or the leaves in the canopy of a forest.
Thus, land surface temperature is not the same as the air temperature that is
included in the daily weather report. Note that the land surface temperature
has a larger day-night variation than the surface air temperature. (source: http://earthobservatory.nasa.gov/GlobalMaps/view.php?d1=MOD11C1_M_LSTDA) Why do operating
wind turbines enhance turbulence and vertical mixing? Turbulence is small-scale, chaotic almost-random air
movement. The spinning rotors of the wind turbines generate turbulence in
their wakes – just like the wake from a boat in the water. Wakes from wind
turbines can spread a long distance downwind of the turbines. Due to the
turbulent nature of the wakes, vertical mixing of lower and upper level air
also increases in regions downwind of wind farms. Why do the operating wind turbines warm nighttime
temperature? This warming
effect is most likely caused by the turbulence in turbine wakes acting like
fans to pull down warmer near surface air from higher altitudes at night.
Typically nighttime has a stable atmosphere with a warm layer overlying a
cool layer. Enhanced vertical mixing mixes warm air down and cold air up,
leading to a warming near the surface at night. Daytime often has an unstable
atmosphere with cool air lying over warmer air. Turbulent wakes mix cool air
down and warm air up, producing a cooling near the surface during the day.
However, daytime mixing is already very large due to solar heating. Hence,
the turbine-enhanced turbulent mixing may play a smaller role during the
daytime. Why do you
attribute the warming
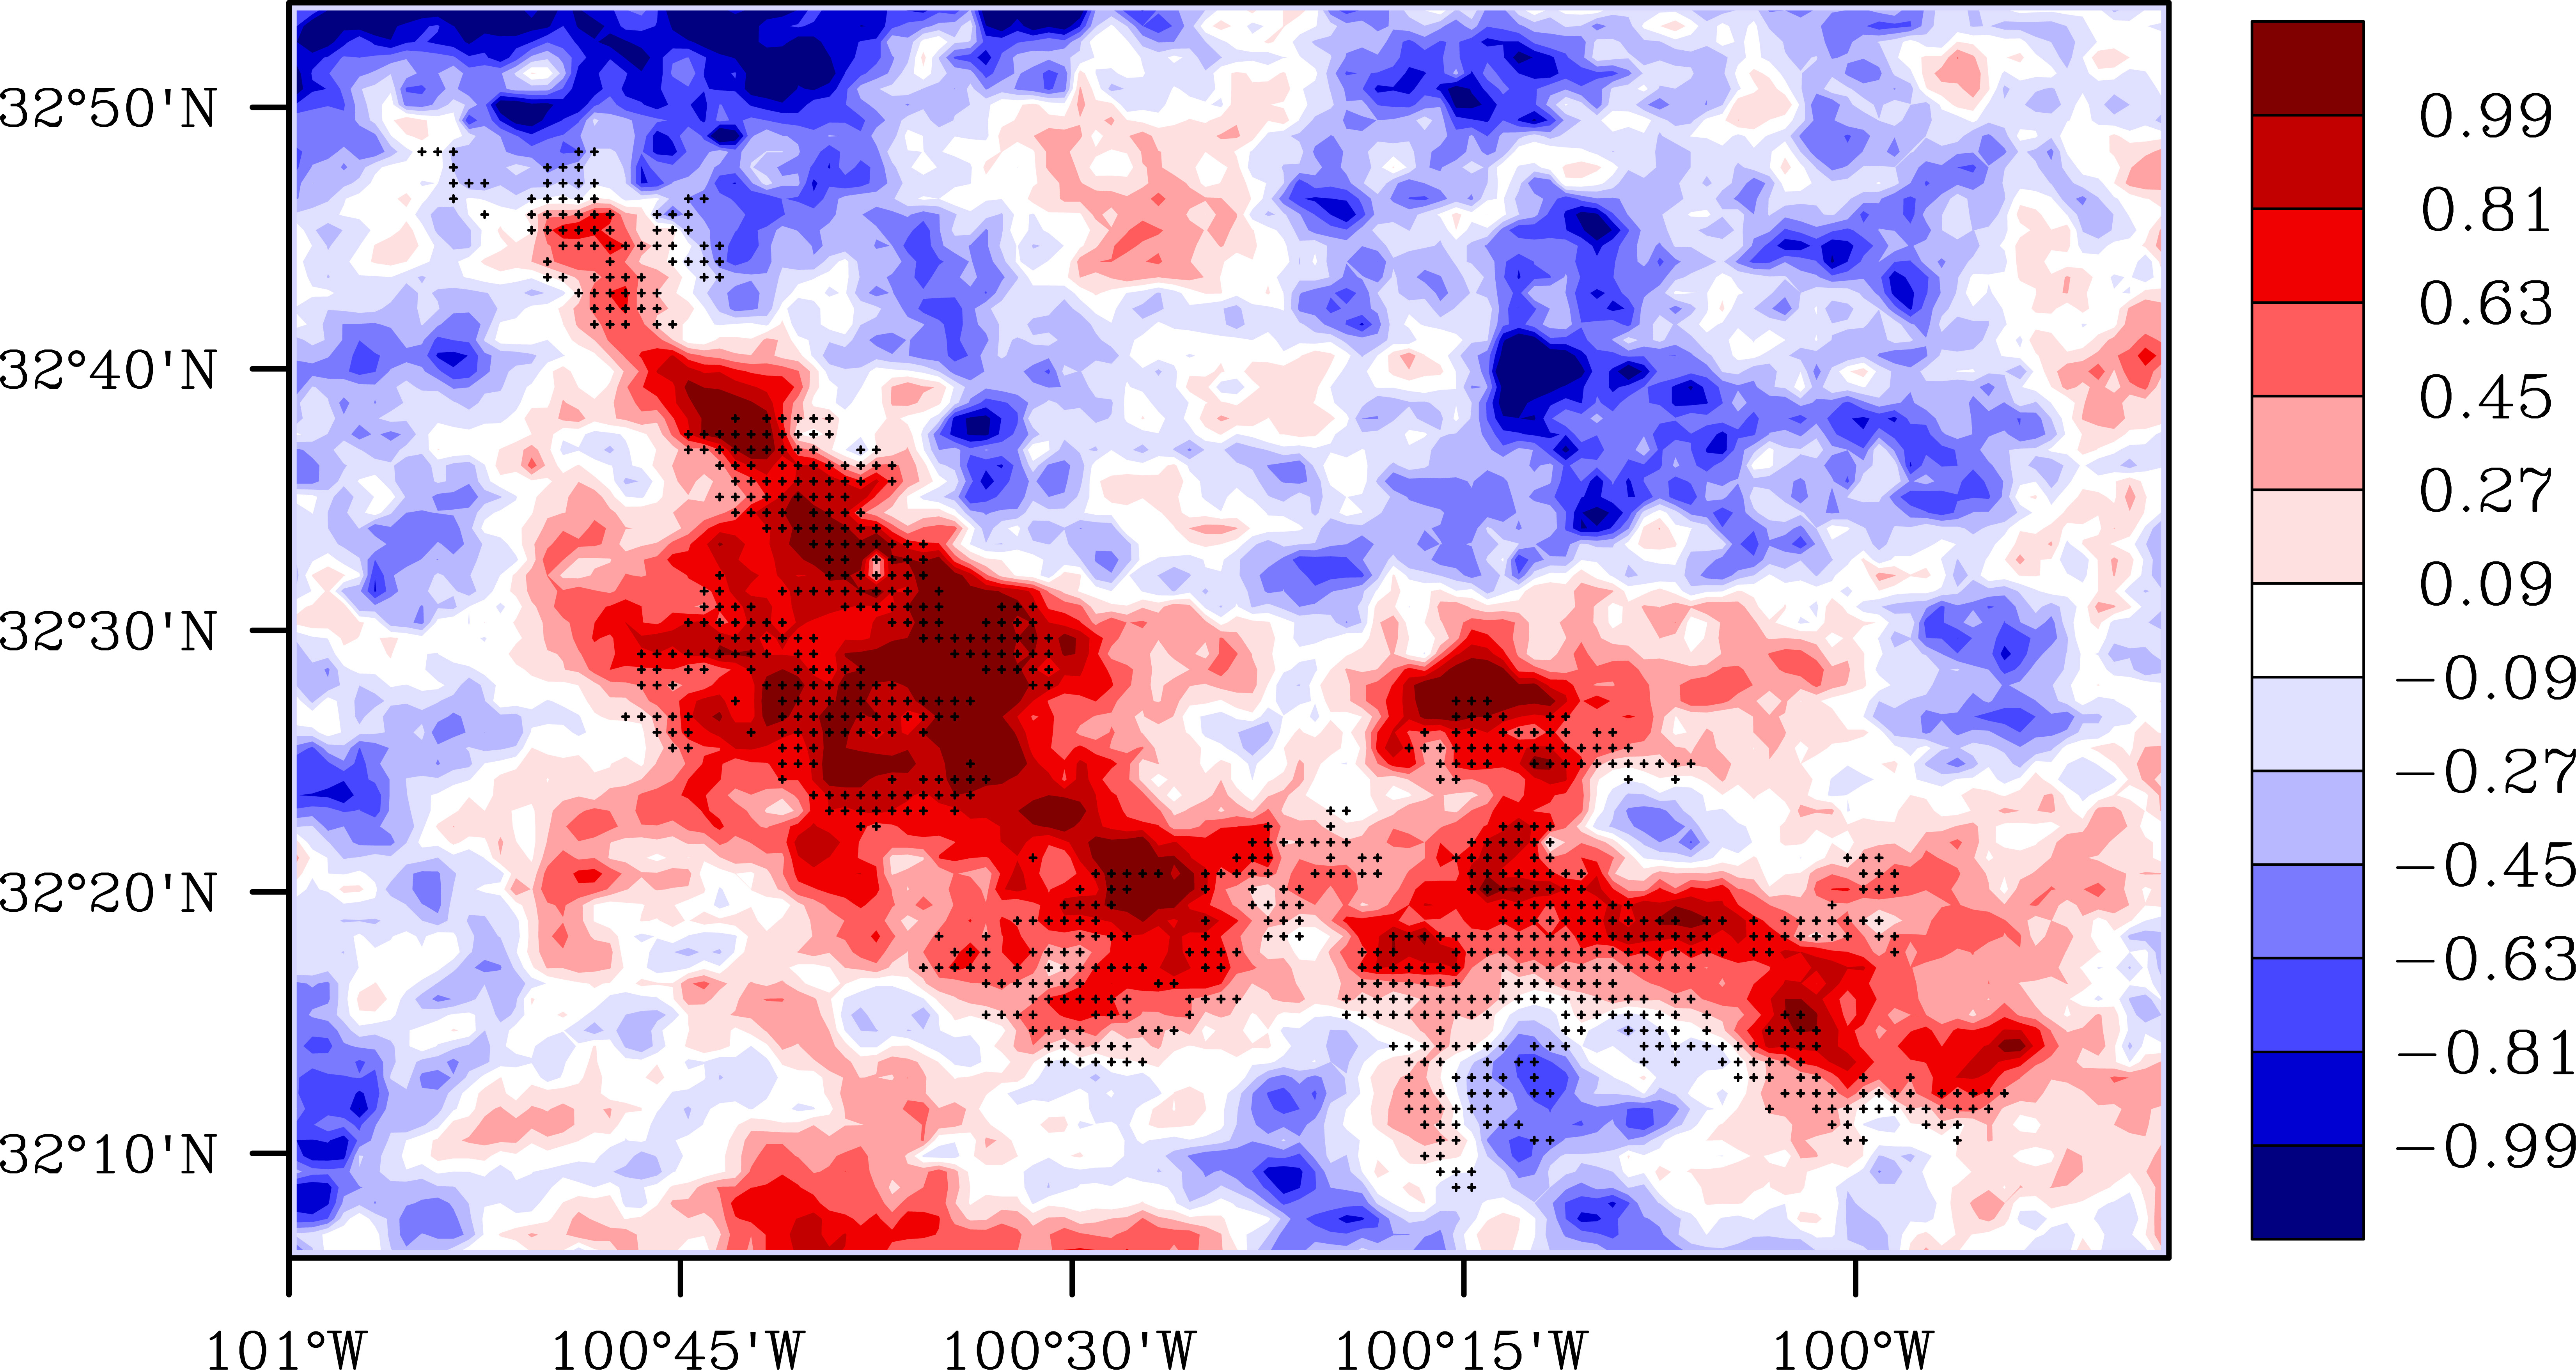
primarily to wind farms? Because (a)
the spatial pattern of the warming resembles the geographic distribution of
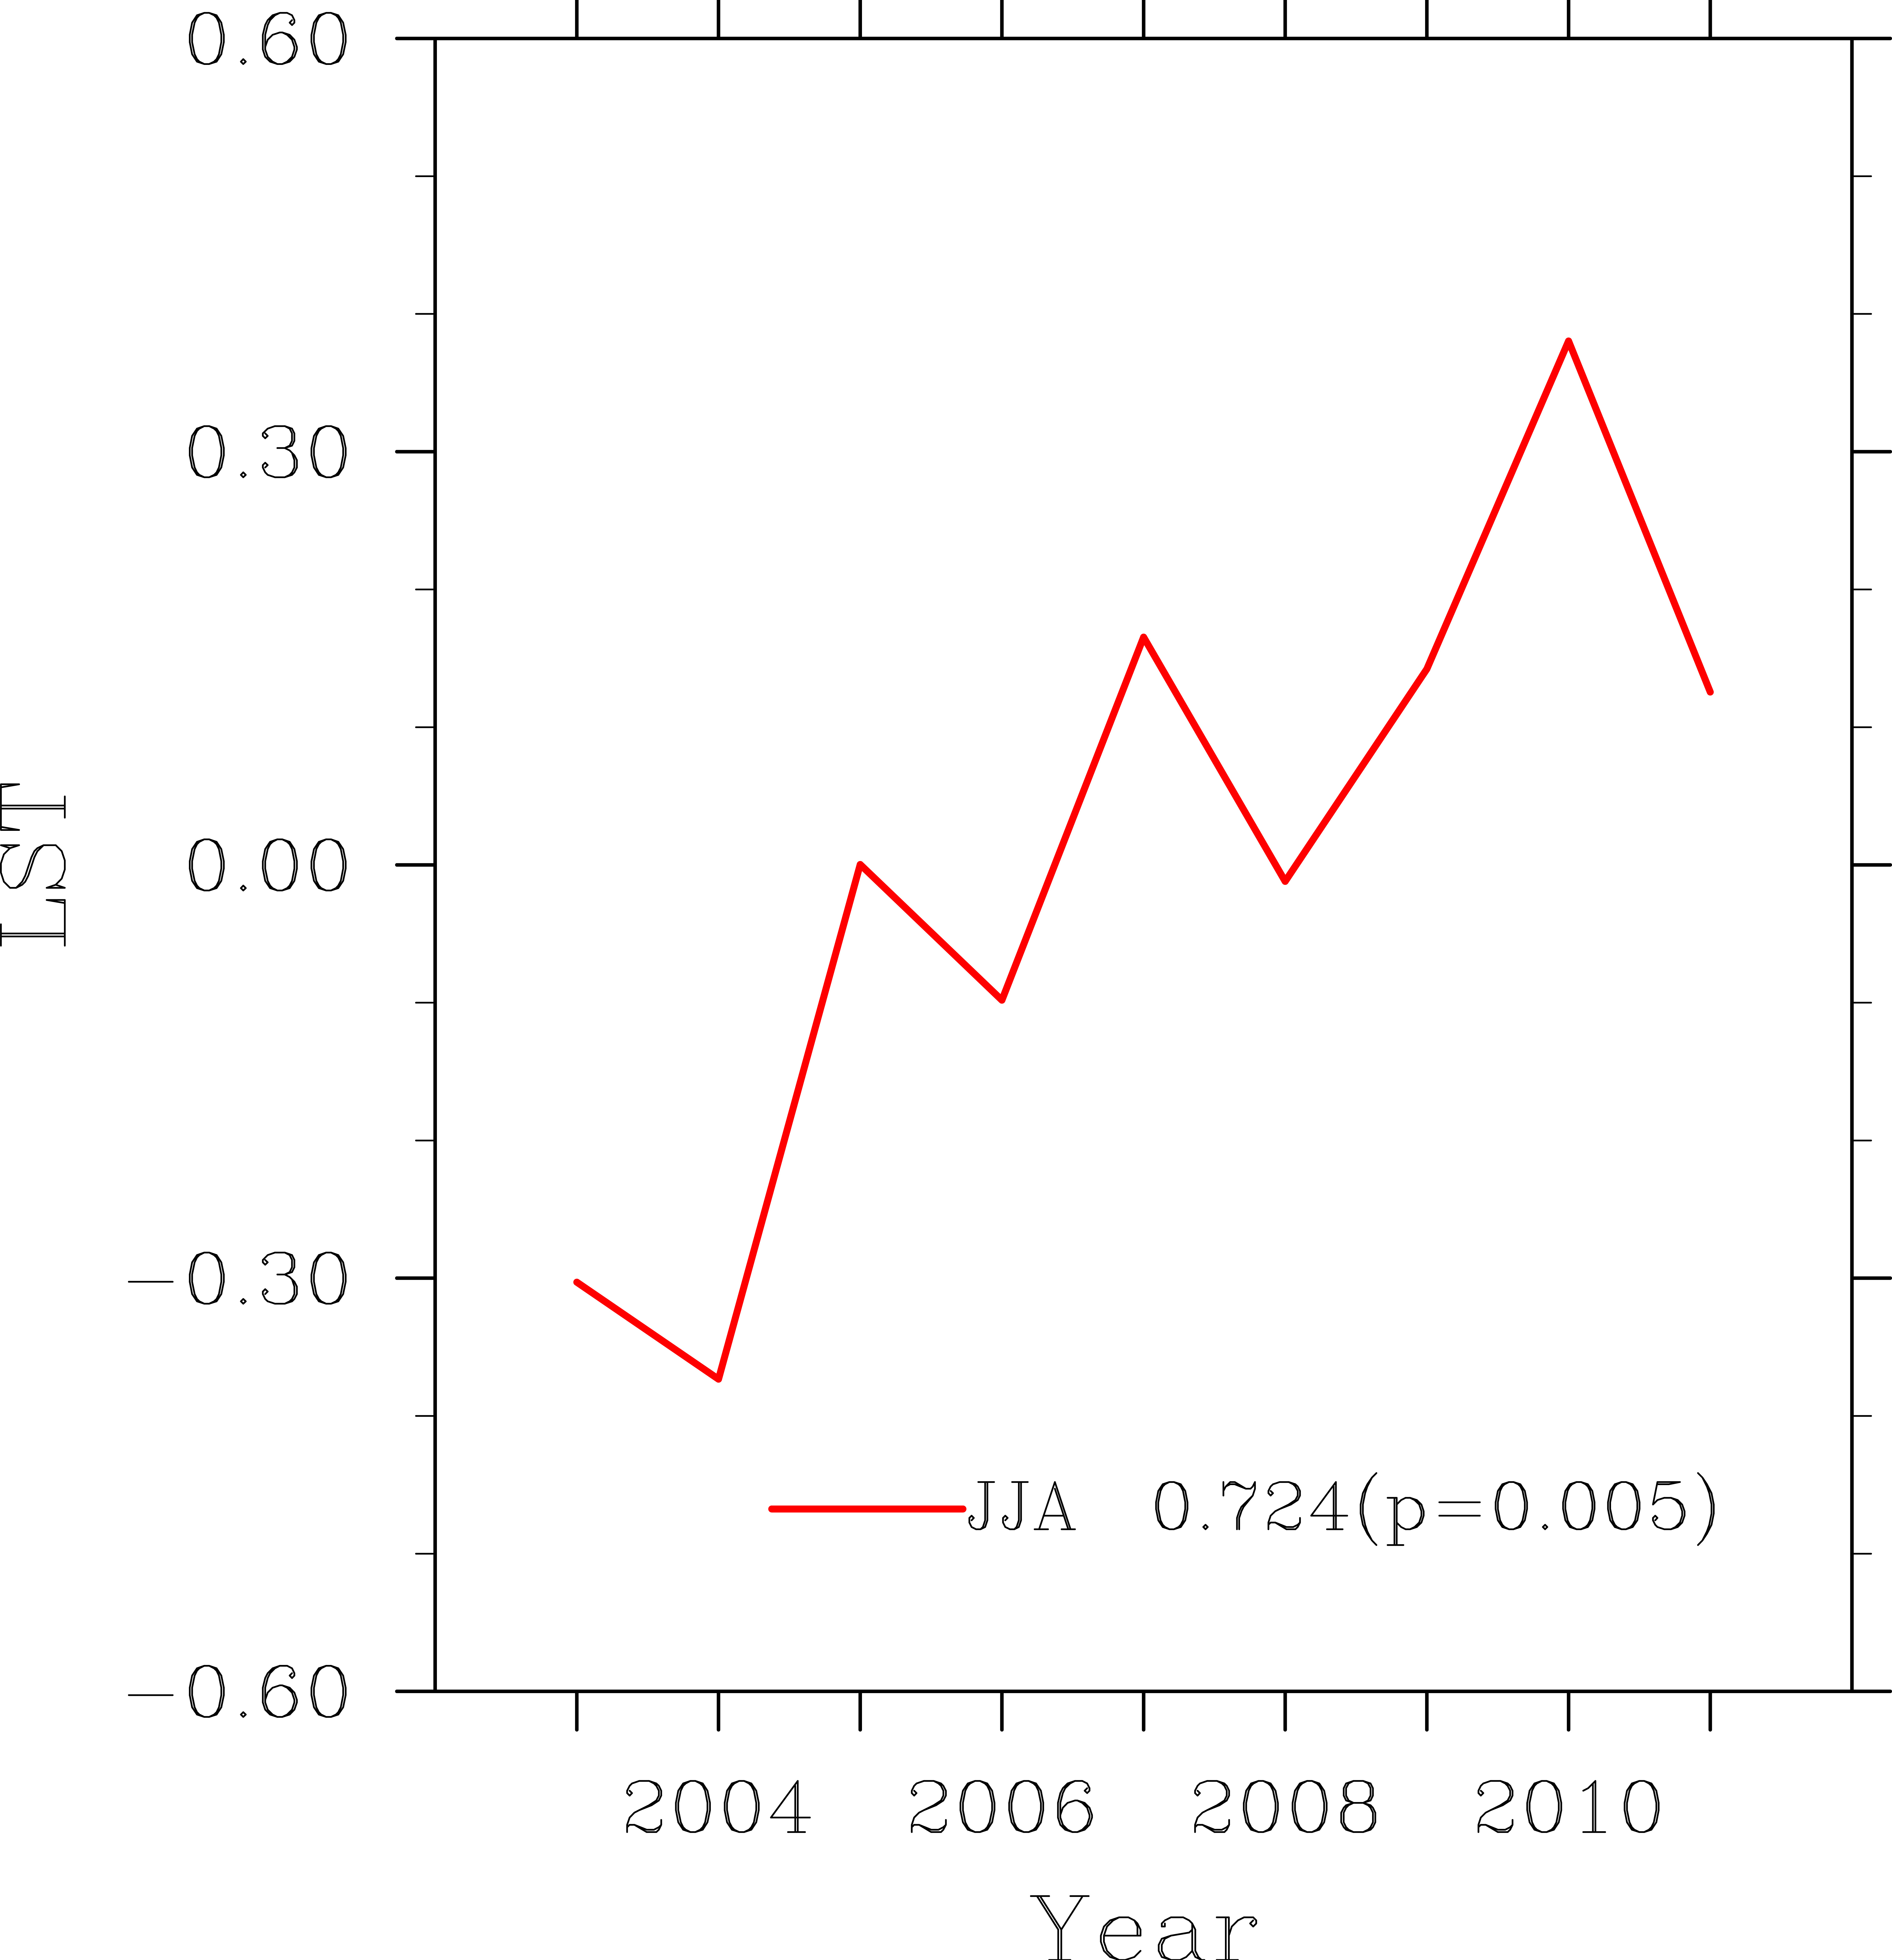
wind turbines and (b) the
year-to-year land surface temperature over wind farms shows a persistent upward trend from
2003 to 2011, consistent with the increasing number of operational wind
turbines with time. FAA data shows that the number of wind turbines over the
study region has gone up from 111 in 2003 to 2358 in 2011. How to interpret
the magnitude of the estimated warming effect? We
found a nighttime warming effect over wind farms of up to 0.72 °C per
decade relative to nearby non-wind farm regions for the nine-year period
during which data was collected. It is important to keep the following points in mind when interpreting our
results. First,
the land
surface temperature measures the temperature of the Earth’s surface, which
has a stronger day-night variation than the surface air temperature from
daily weather reports. Therefore, the impacts of wind farms on the surface
air temperature should be within the near-surface boundary layer and smaller
than the land surface temperature signal presented in this paper. Second,
as this analysis is from a short period over a region with rapid growth of
wind farms, we expect our estimates to give higher values than those
estimated in other locations and over longer periods. Third,
we express the warming effect as a linear trend in °C per decade units. This is just one simple way to
quantify the wind farm impacts while reducing the year-to-year data noise.
The estimated warming trend only applies to the study region and to the study
period, and thus should not be extrapolated linearly into other regions
(e.g., globally) or over longer periods (e.g., for another 20 years).
For a given wind farm, the warming effect would likely reach a limit
rather than continue to increase if no new wind turbines are added. Fourth,
satellite data do contain errors and noise due to cloud contamination and
imperfection of retrieval algorithms. Uncertainties also exist in locating wind
turbines as well as their operating times. In addition, other factors may
also modify local land surface temperature. Considering the complexity of
the issue, our results should be interpreted as illustrative rather than
definitive. Finally,
compared to impacts of other human-made land use changes, the estimated
warming over the wind farms is small. The “urban heat-island” effect, for
example, in Austin TX or phoenix in AZ, could be several degrees °C warmer
than the surrounding less developed areas. Overall, the warming effect
reported in this study is local and is small compared to the strong
background year-to-year land surface temperature changes. Very likely, the
wind turbines do not create a net warming of the air and instead only
redistribute the air’s heat near the surface (the turbine itself does not generate any
heat),
which is fundamentally different from the large-scale warming effect caused
by increasing atmospheric concentrations of greenhouse gases due
to the burning of fossil fuels. Possible impacts on weather and climate? Wind energy is among the world’s
fastest growing sources of energy. The U.S. wind industry
has experienced
a remarkably rapid expansion of capacity in
recent years. While converting wind’s kinetic energy into
electricity, wind turbines modify surface-atmosphere exchanges and transfer of
energy, momentum, mass and moisture within the atmosphere. These changes, if
spatially large enough, might have noticeable impacts on local to regional
weather and climate. Given
the present installed capacity and the projected growth in installation of
wind farms across the world, this study draws attention to an important
scientific issue that requires further investigation. We need to better
understand the system with observations and better describe and model the
complex processes involved to predict how wind farms may affect future
weather and climate. What will you do
next? Understanding wind farm-atmosphere
interactions is a critical emerging topic. This article is a first step in
exploring the potential of using satellite data to quantify the possible
impacts of big wind farms on weather and climate. We are now expanding this
approach to other wind farms and building models to understand the physical
processes and mechanisms driving the interactions of wind turbines and the
atmosphere boundary layer near the surface. Any implications
for wind energy industry? We need to realize that the build-up of
CO2 in the atmosphere due to the burning of fossil fuels will have
global impacts, while the warming effect
reported in this study is local and is small. Generating
wind power creates no emissions, uses no water, and is likely green. Wind power is going to be a part of the solution to the
climate change, air pollution and energy security problem. Understanding the
impacts of wind farms is critical for developing efficient adaptation and
management strategies to ensure long-term sustainability of wind power. o Figure
1 o Figure
2 April-30-2012 |
|||