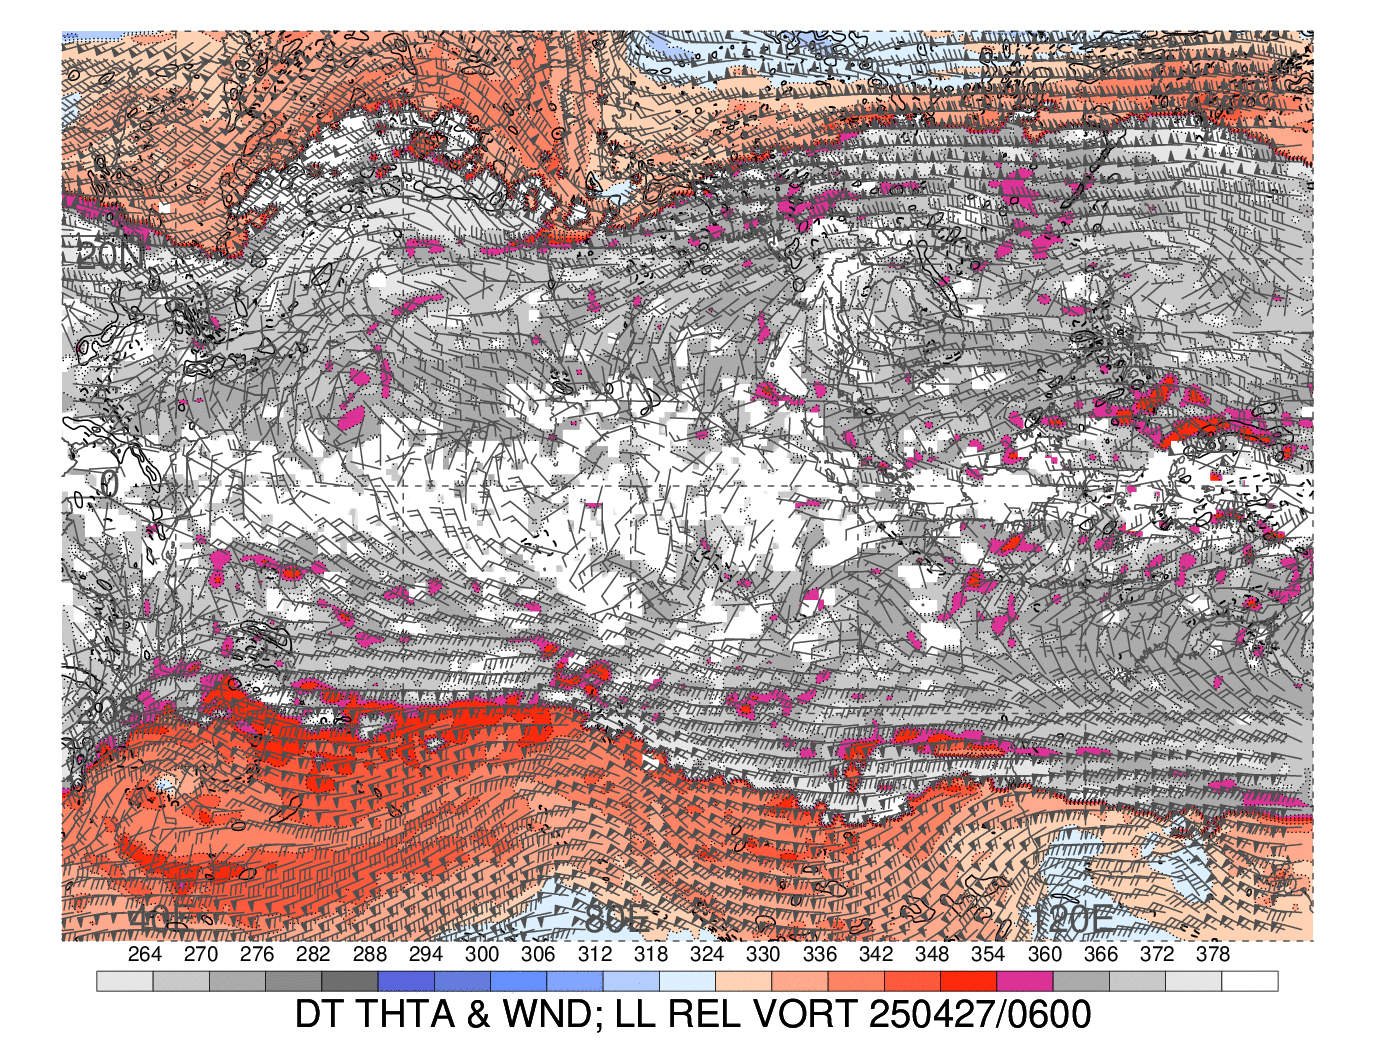
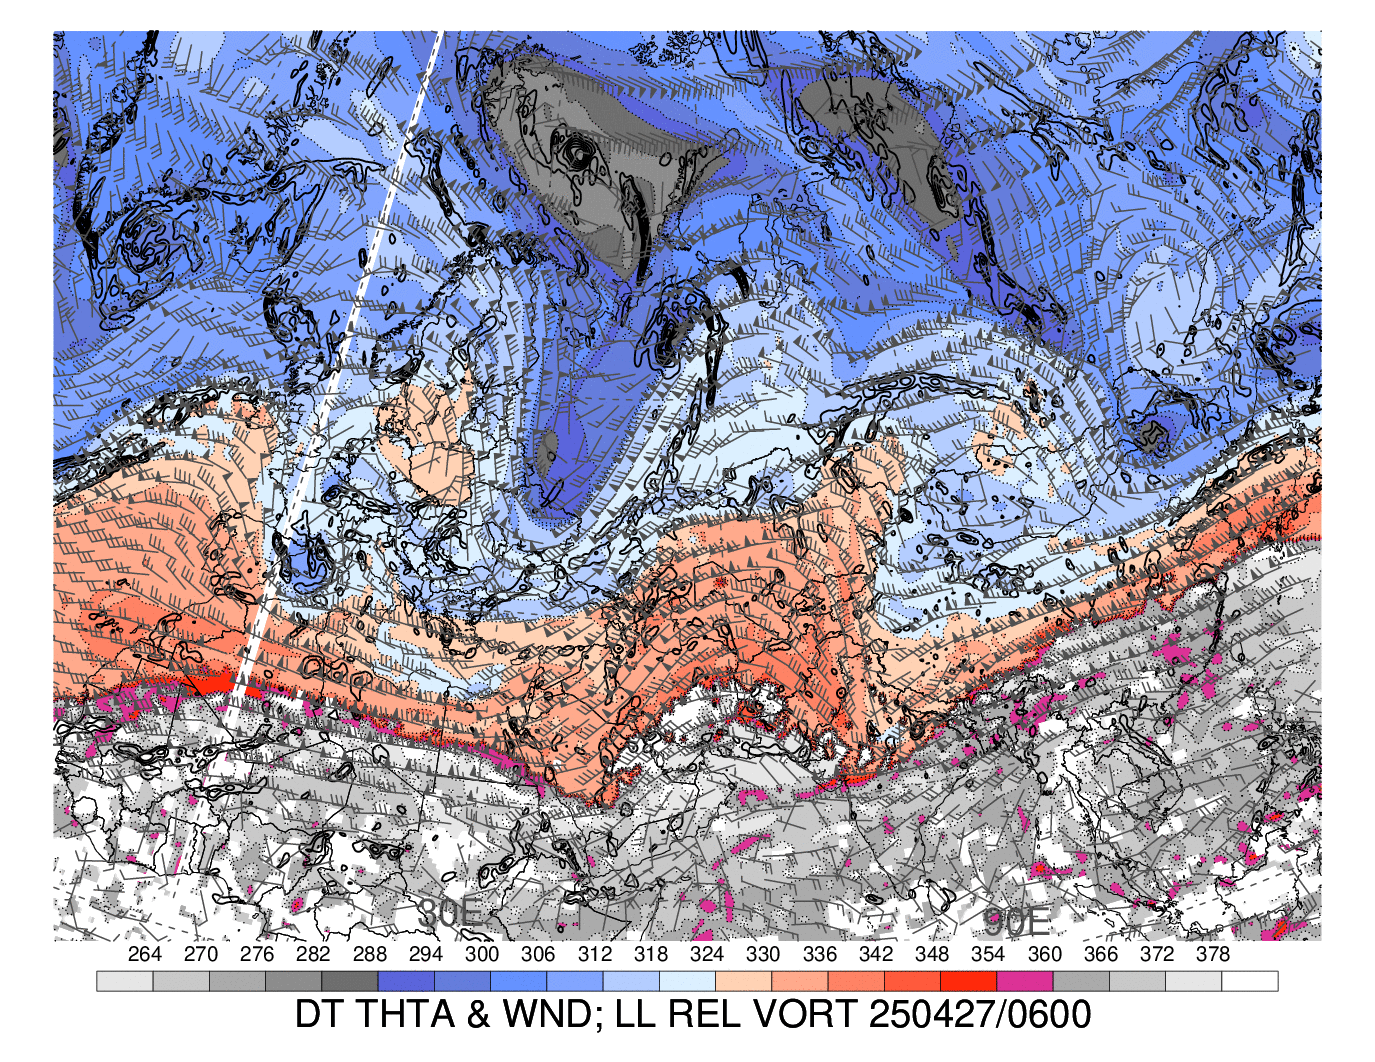
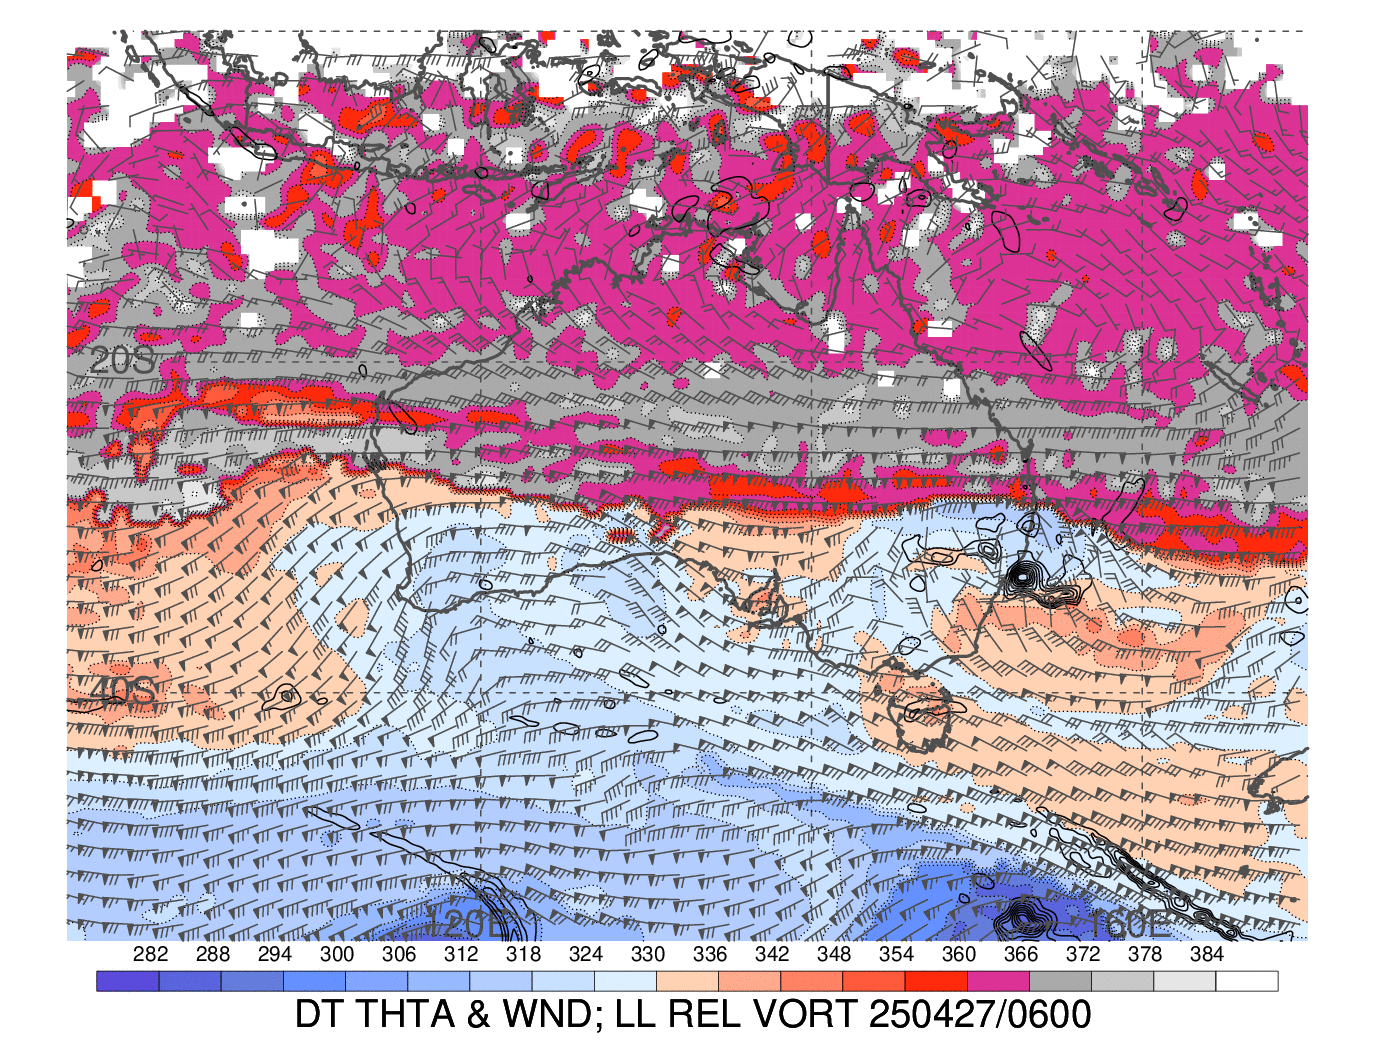
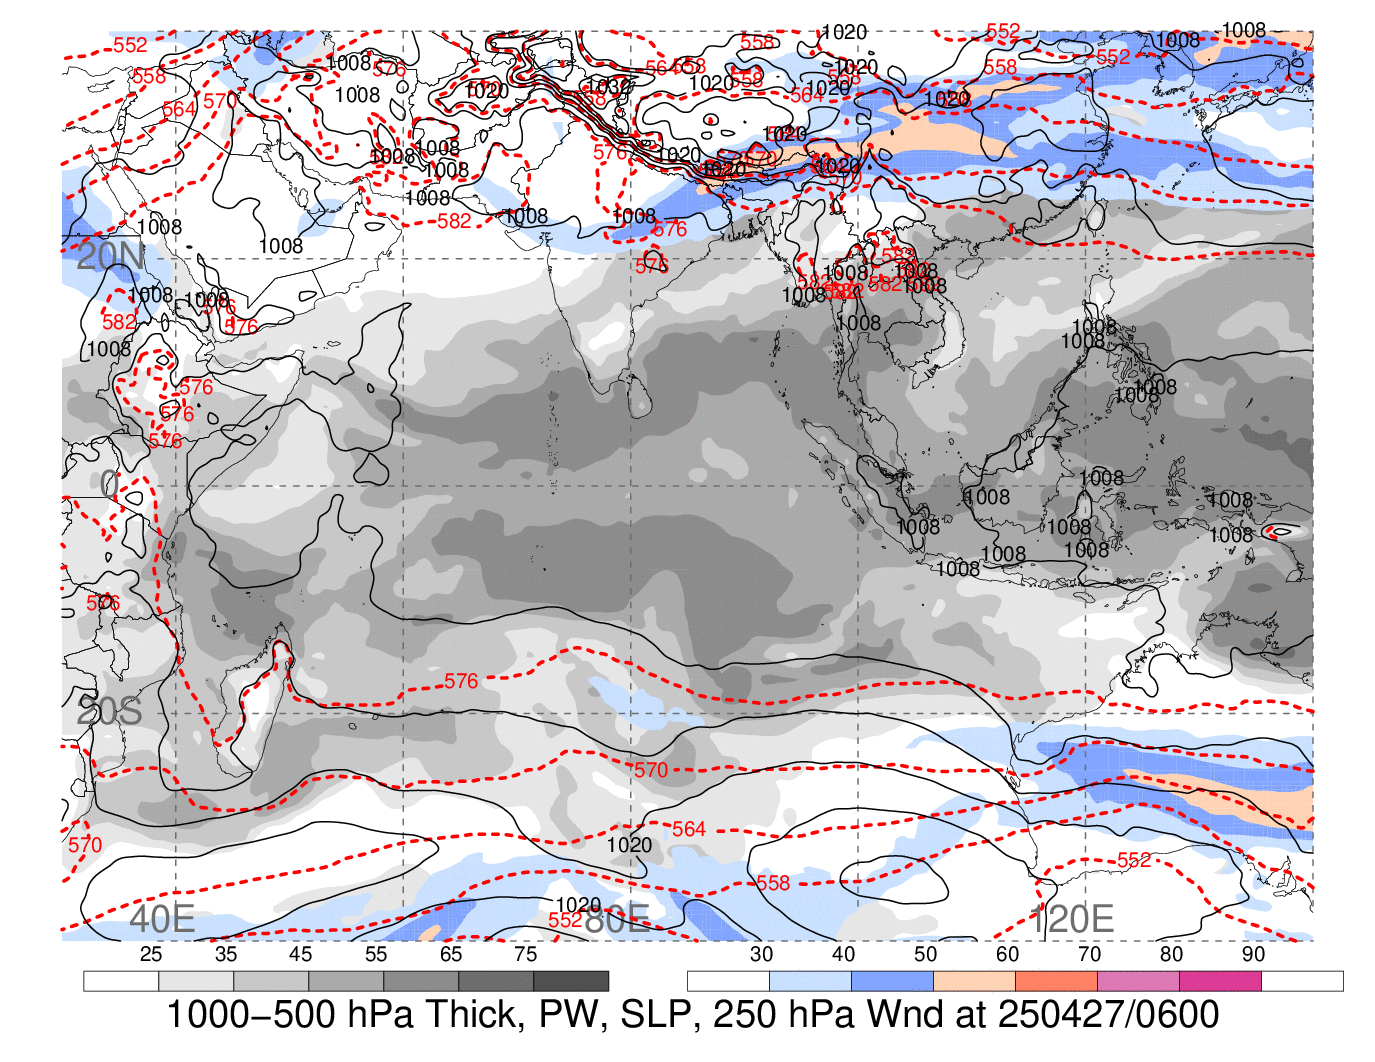
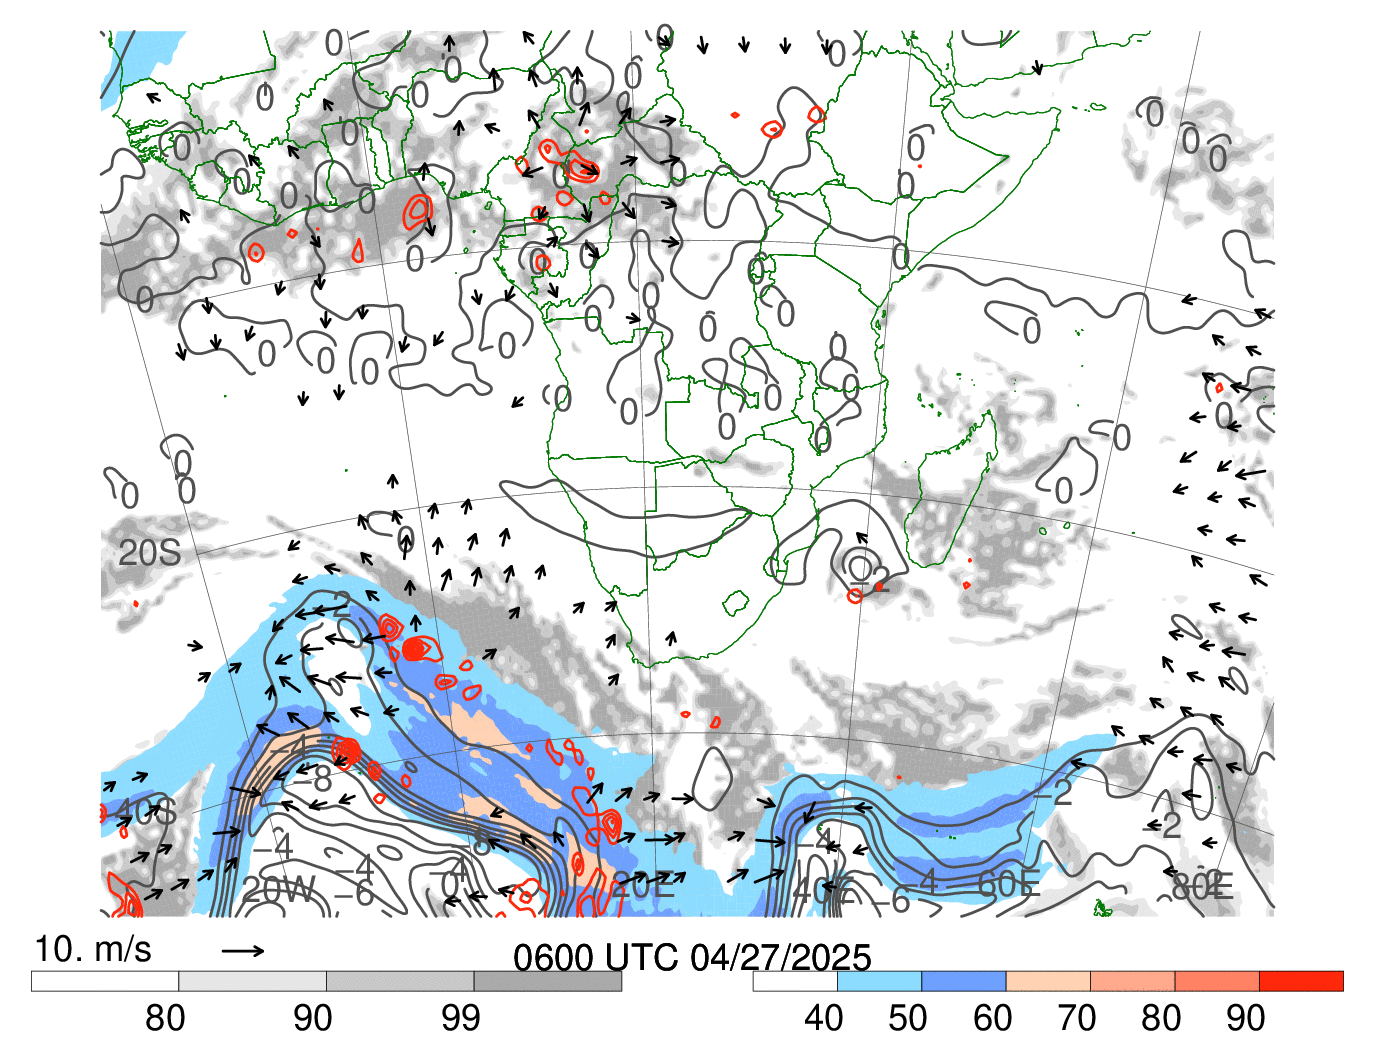
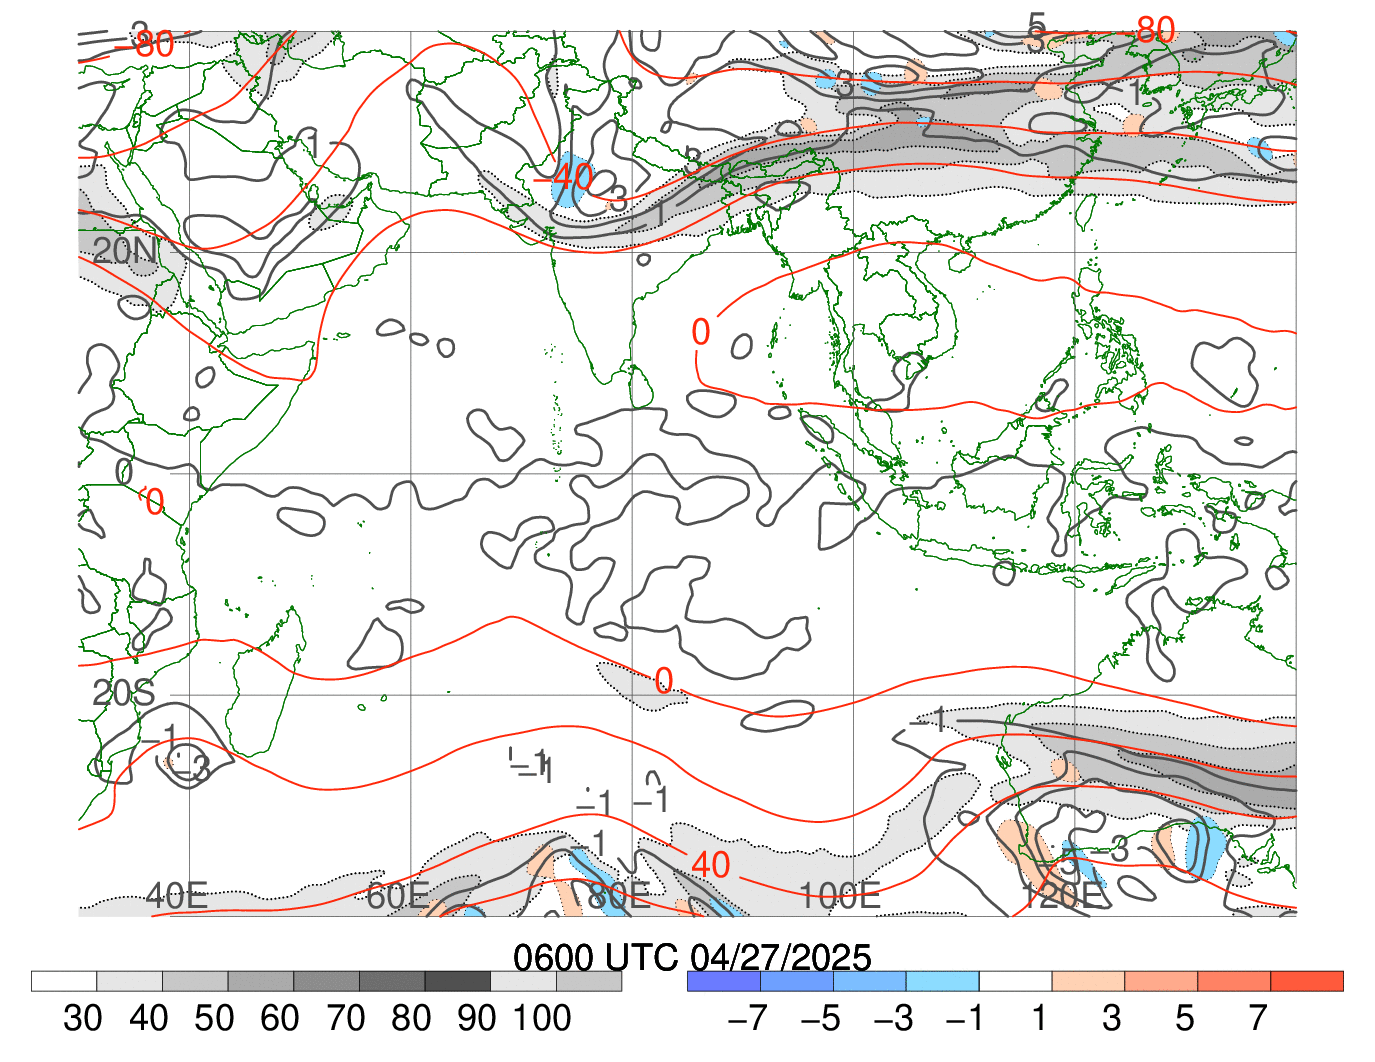
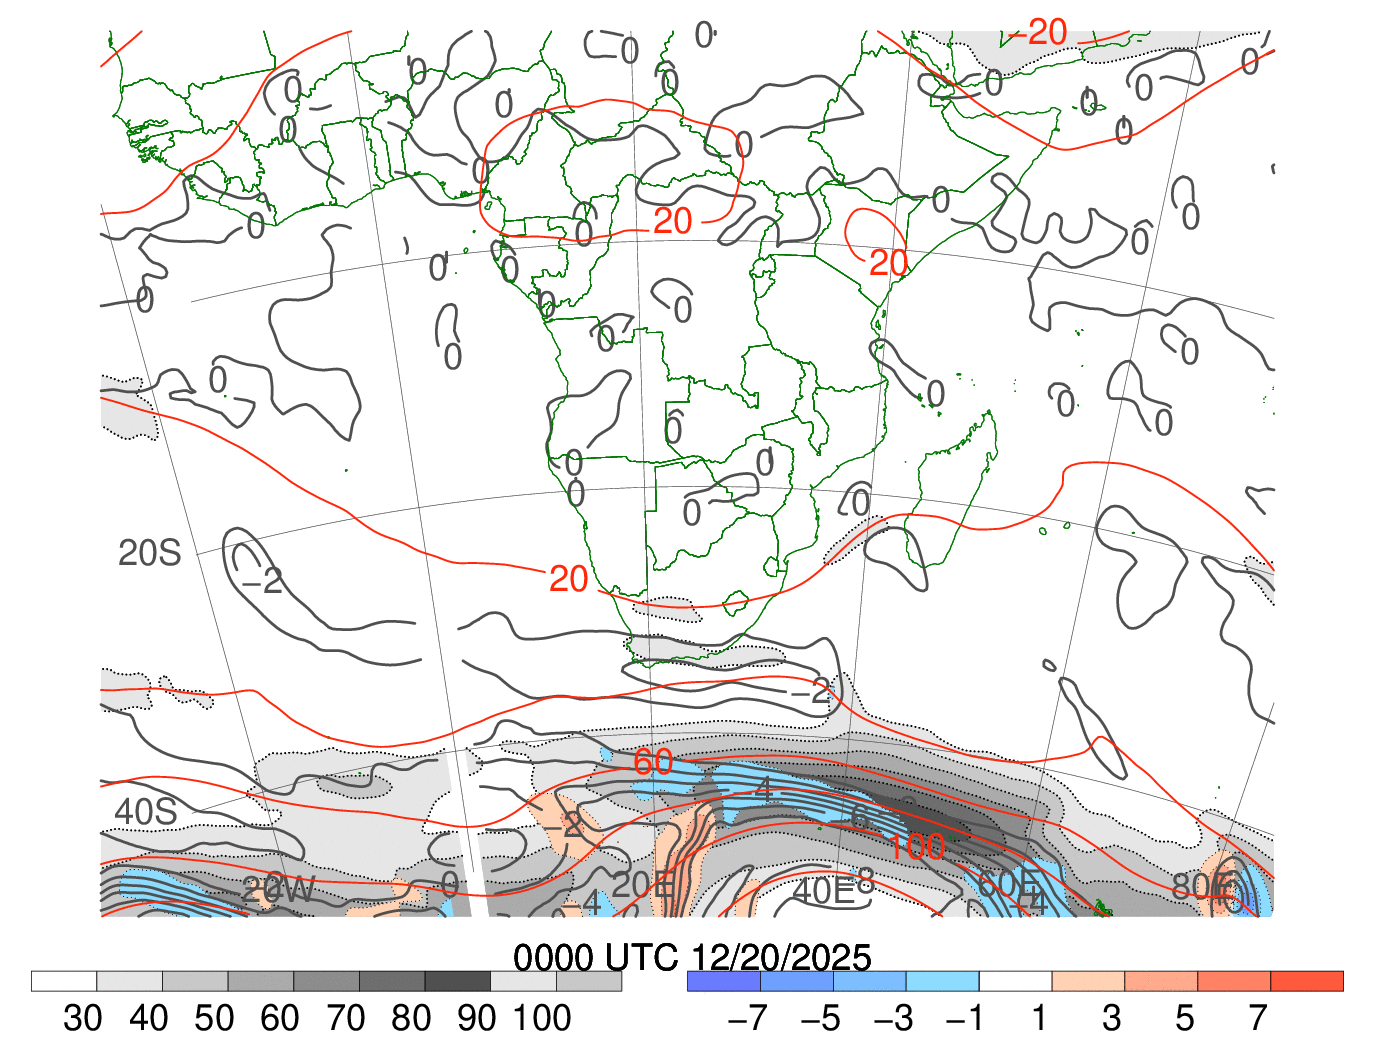
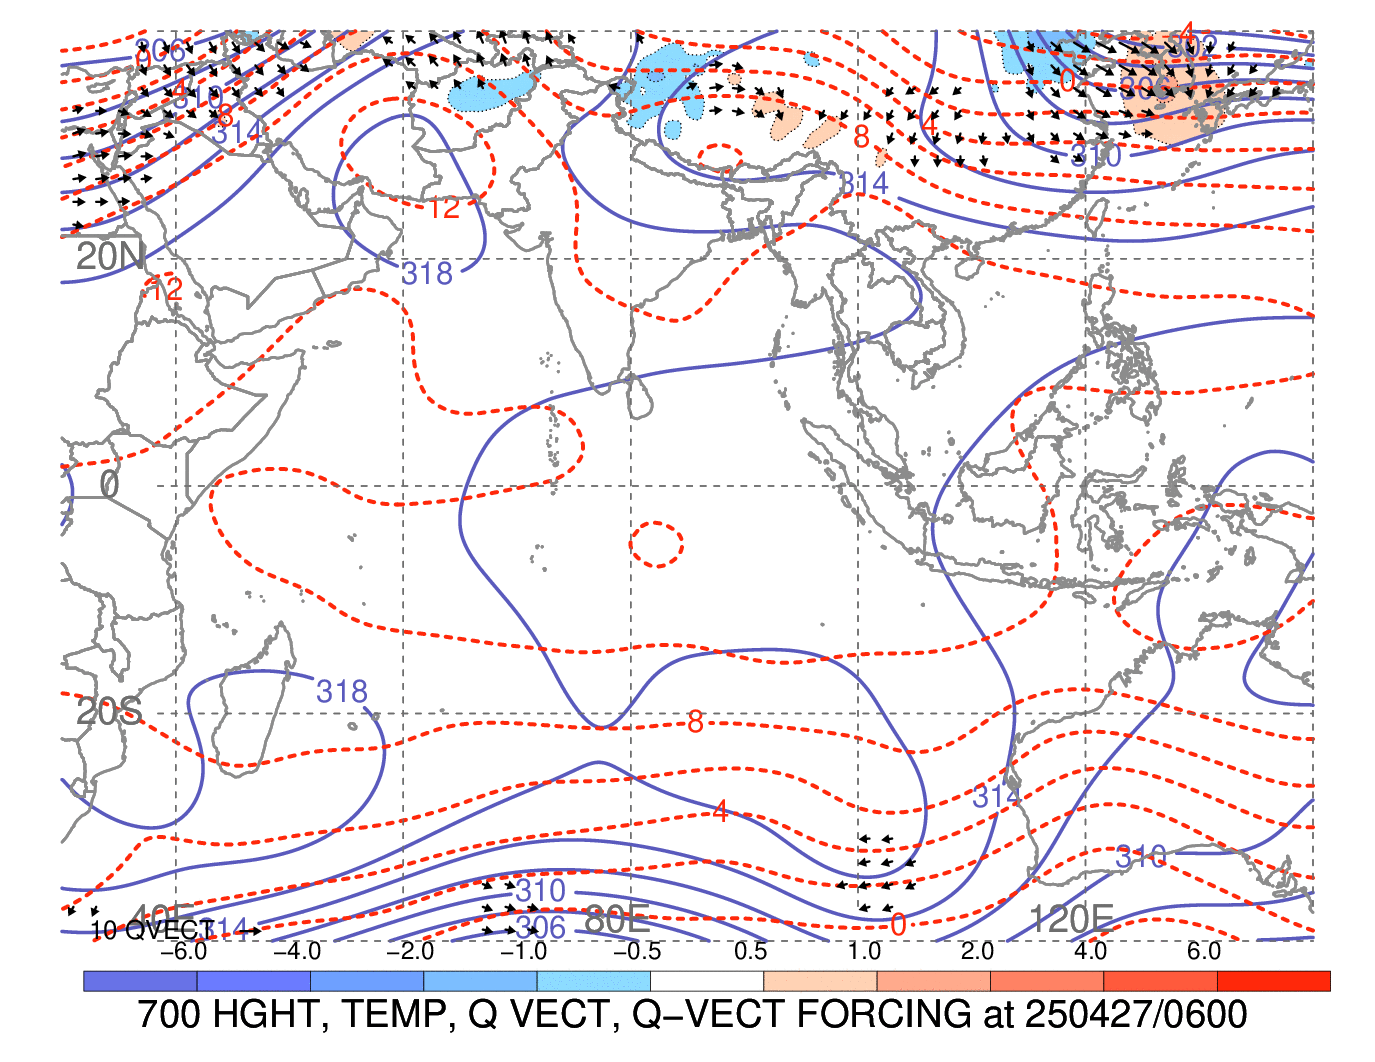
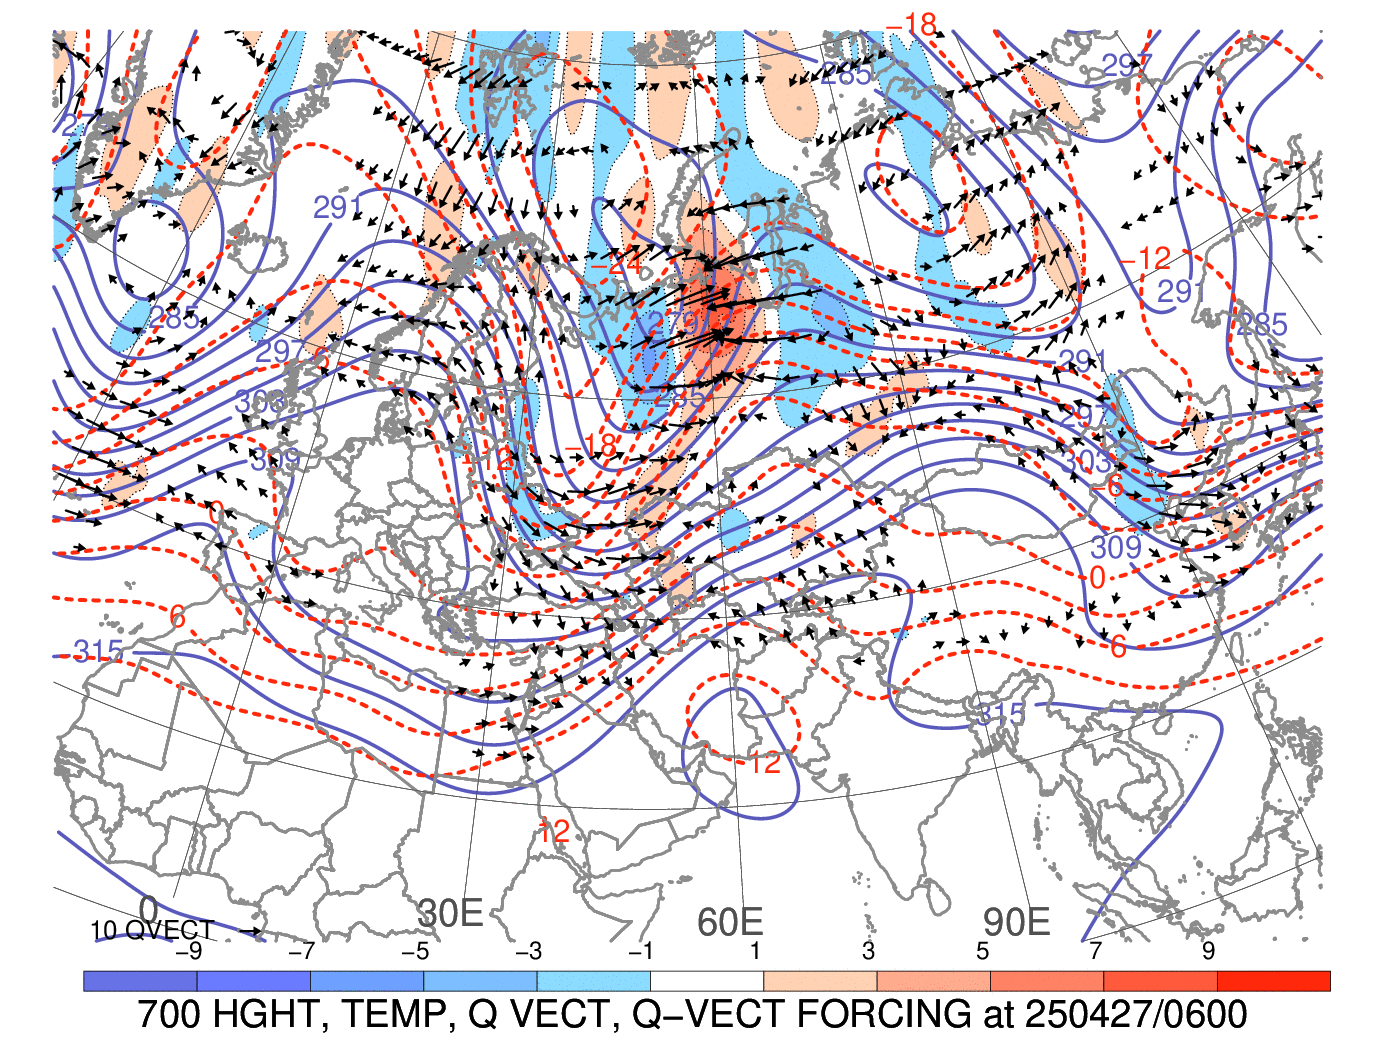
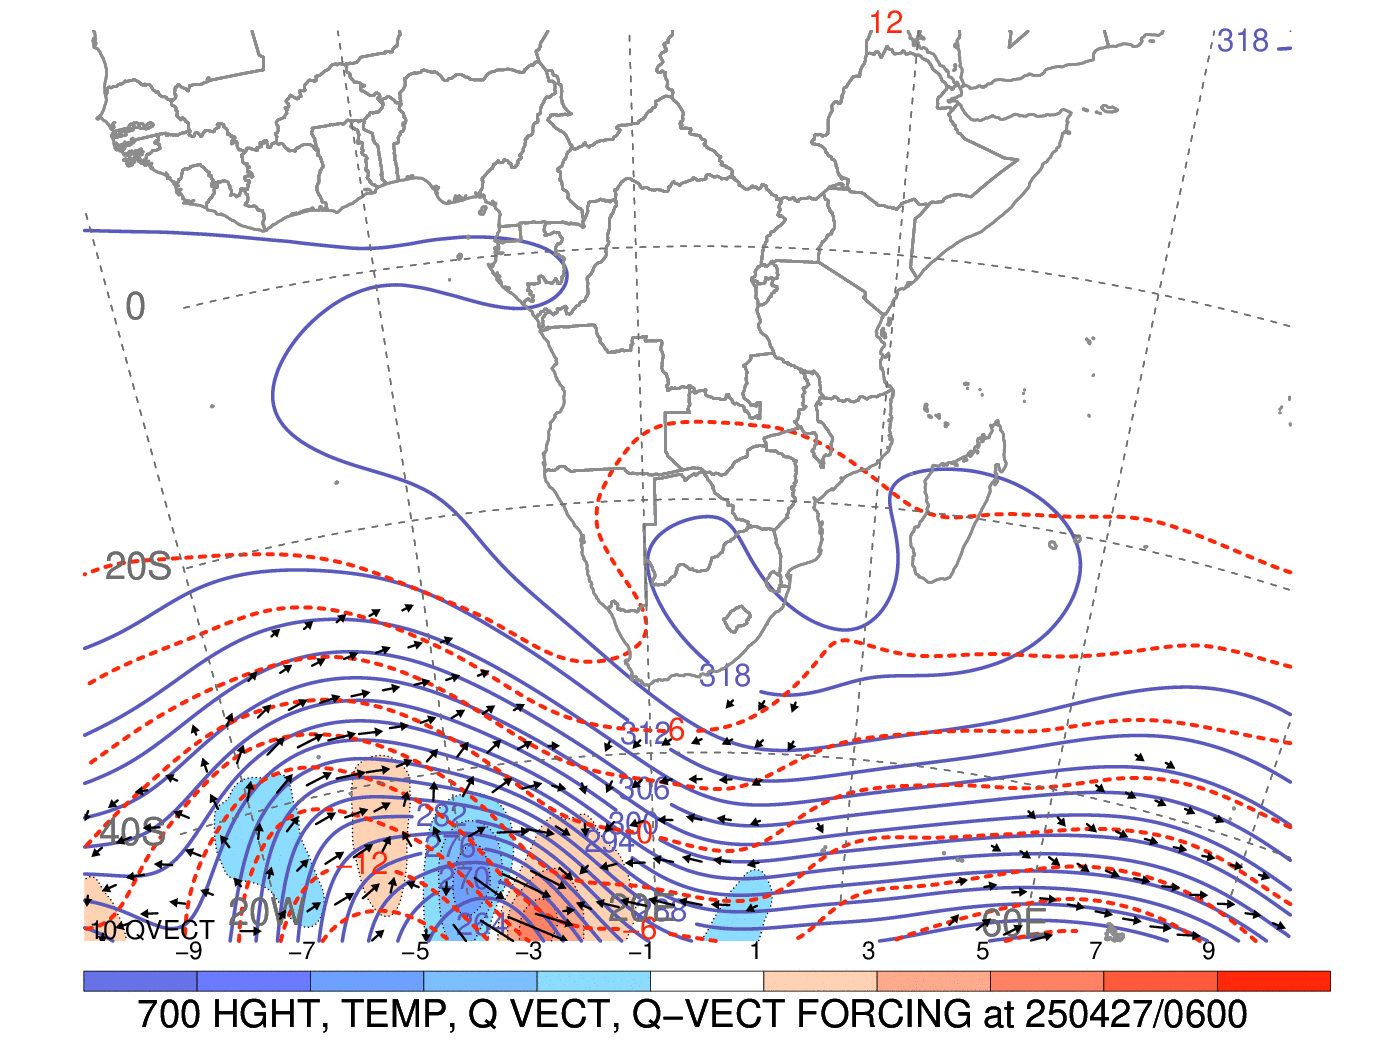
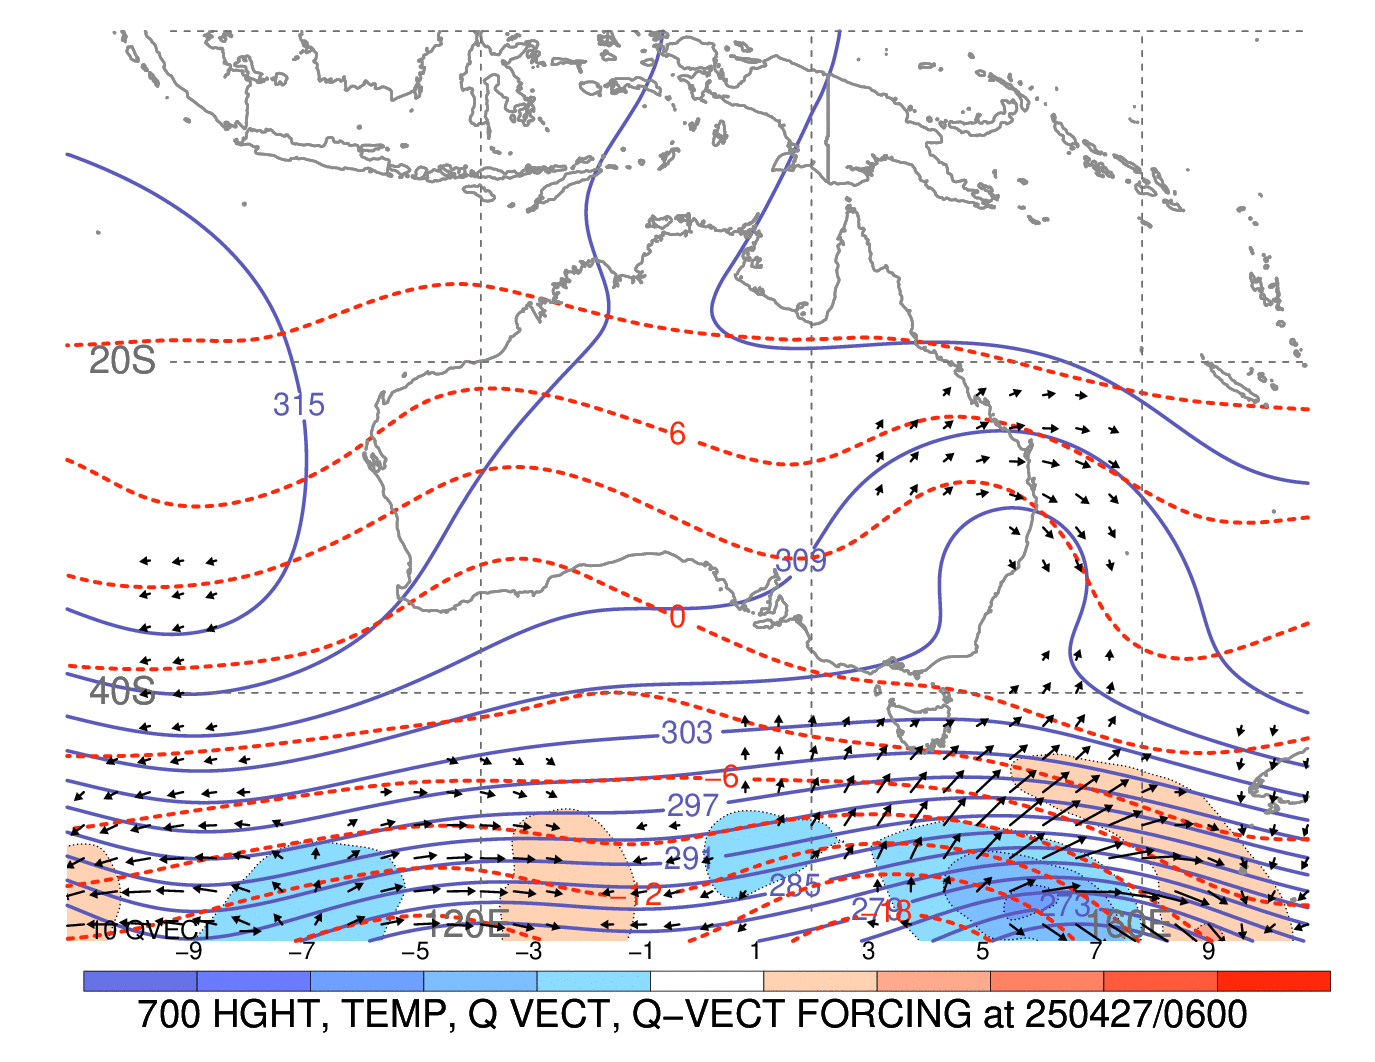
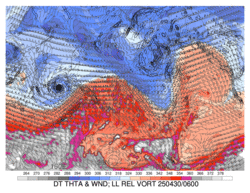
Indian Ocean
Click image for latest 72-h loop
|
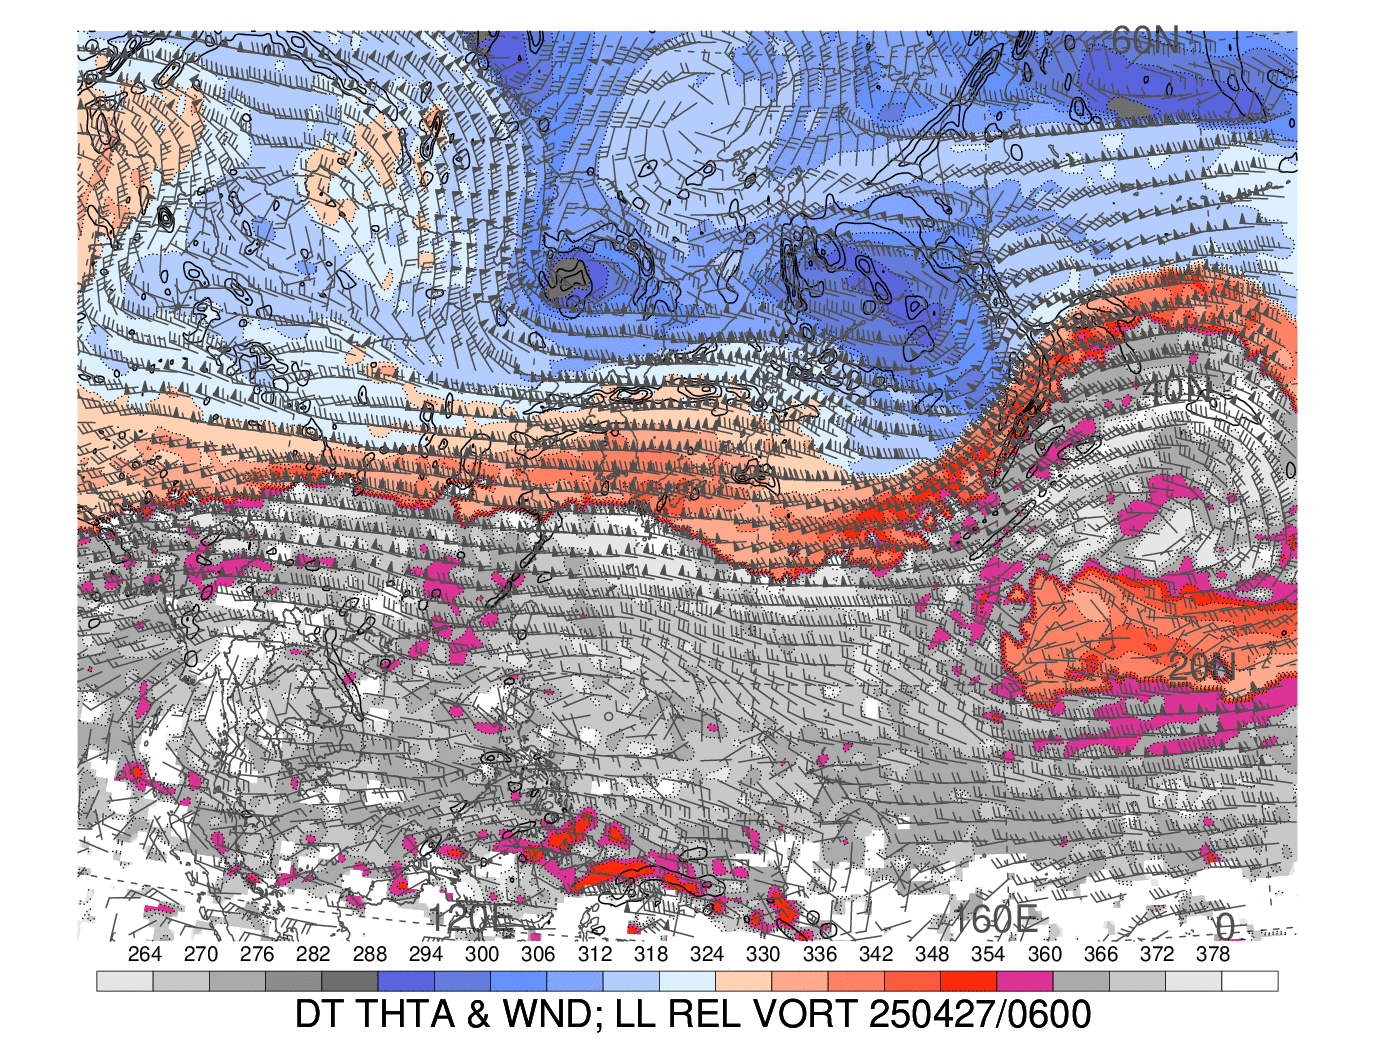
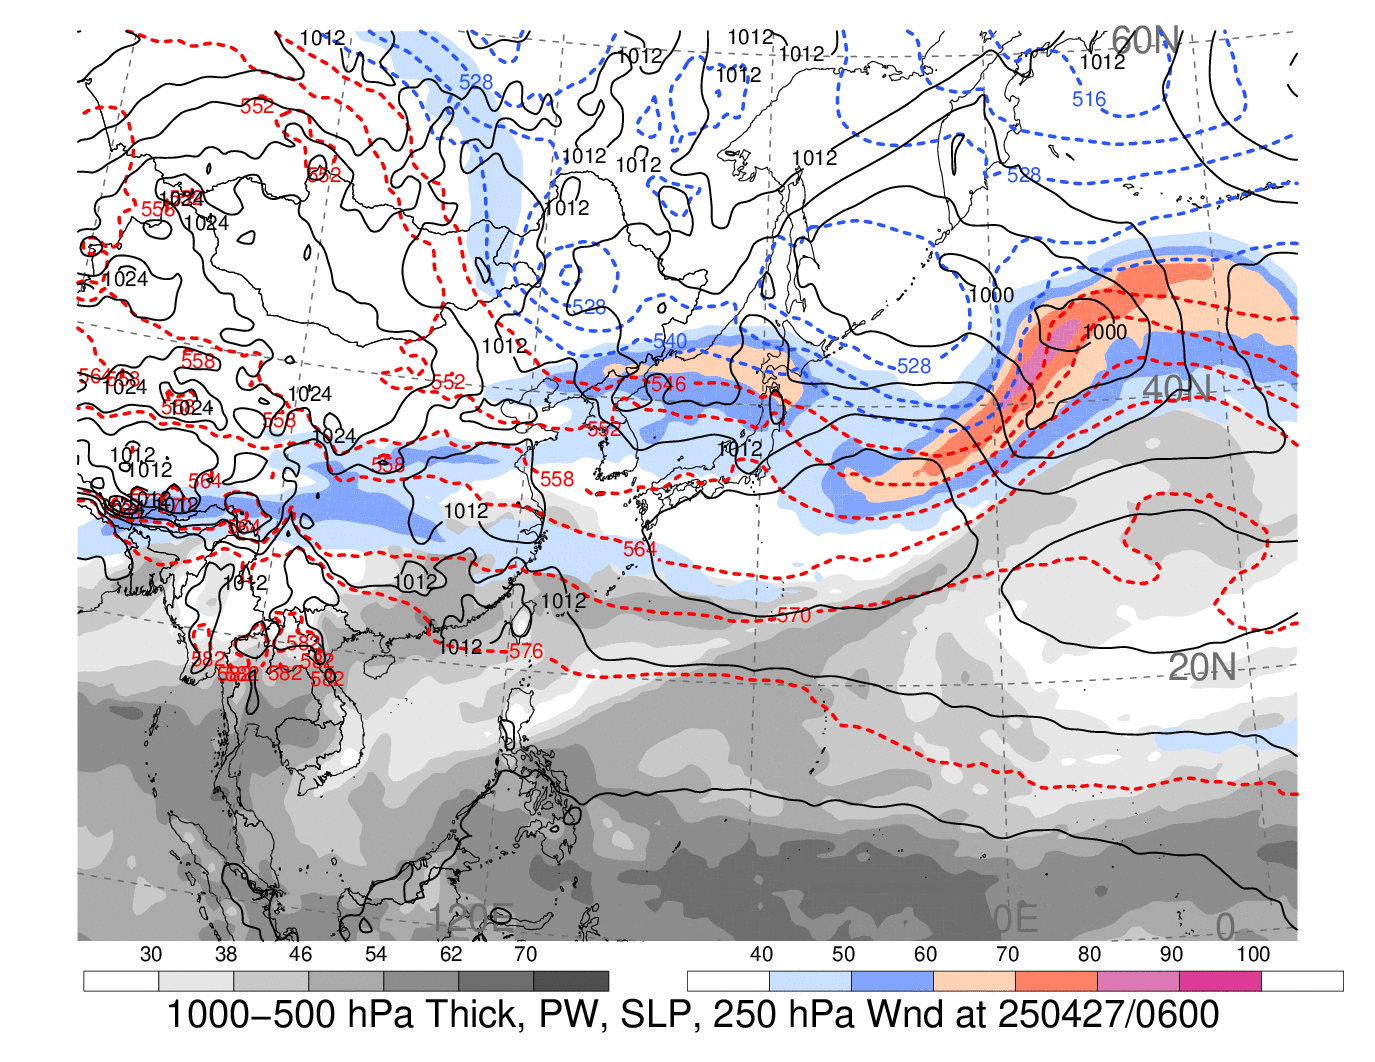
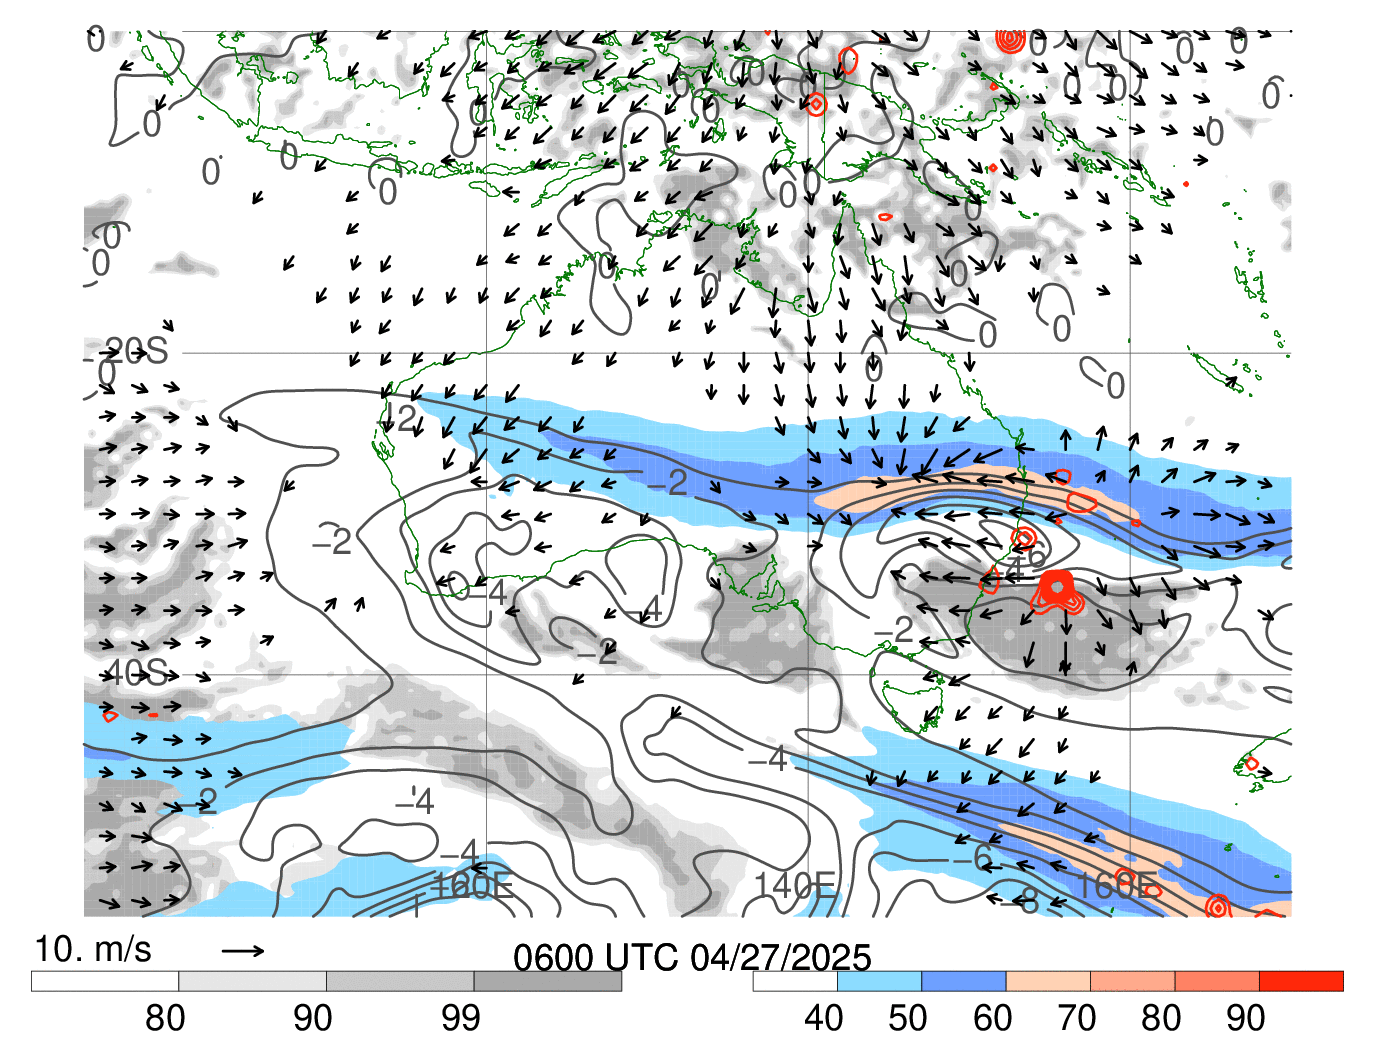
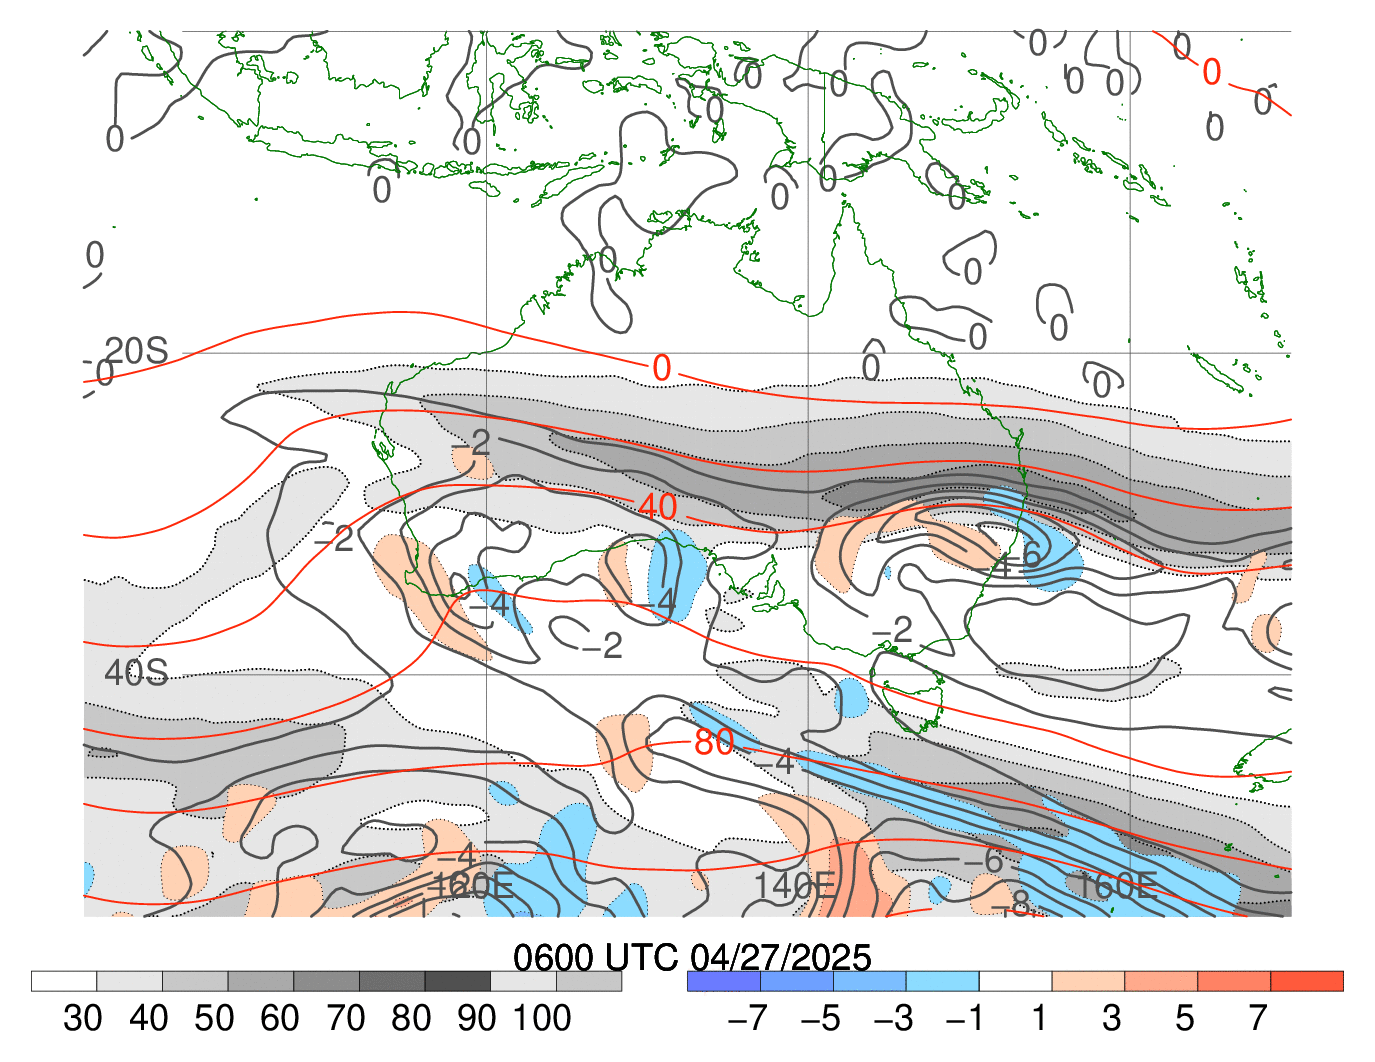
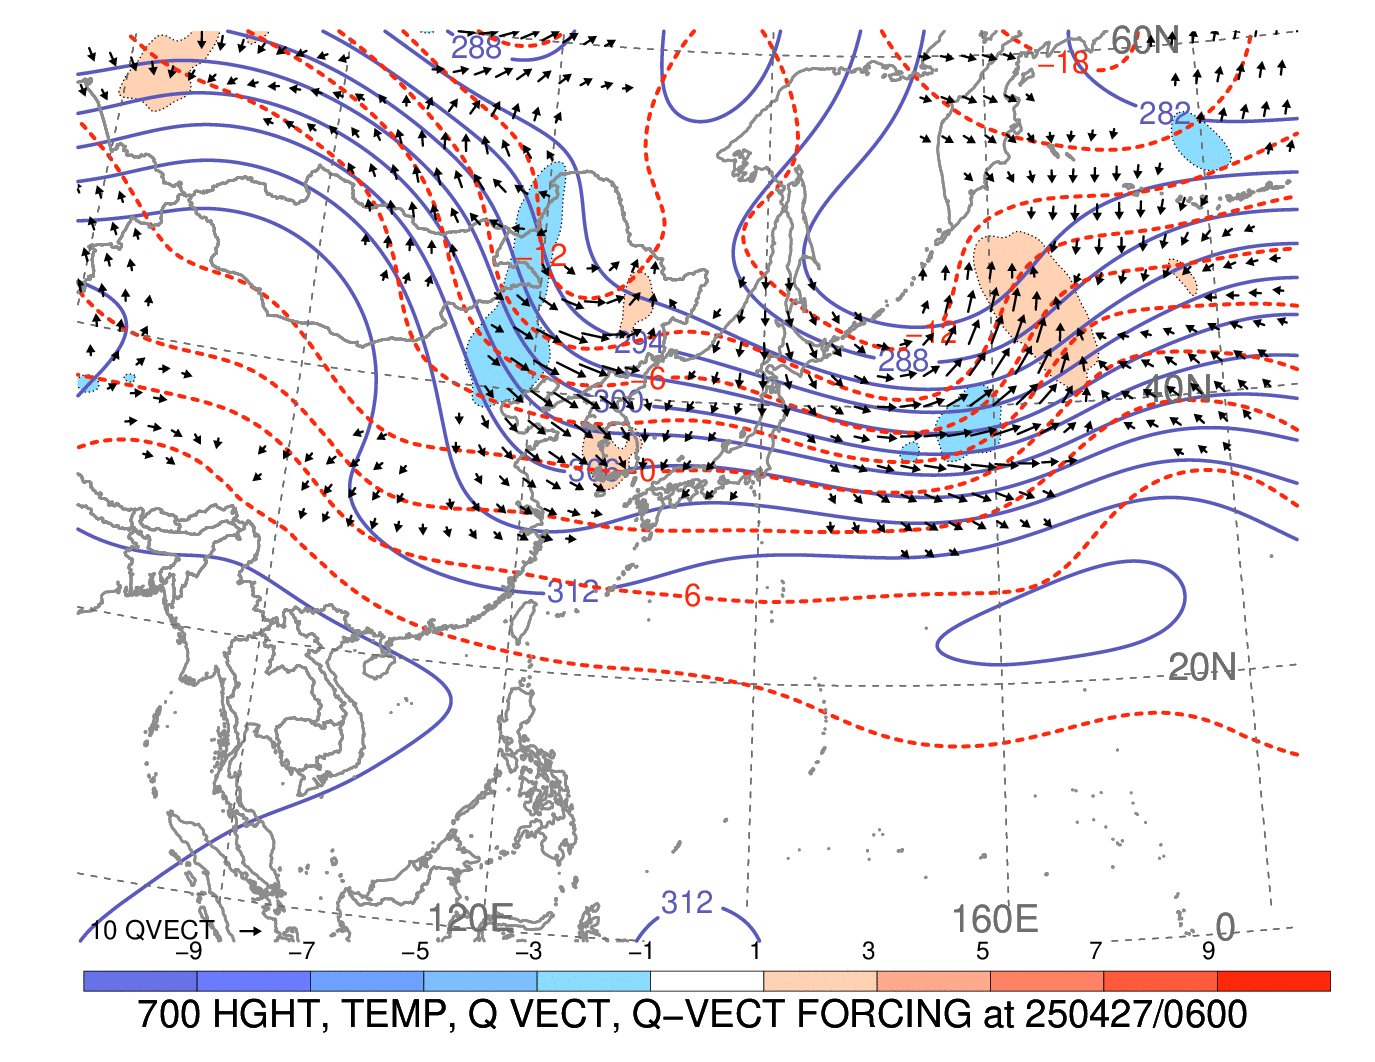
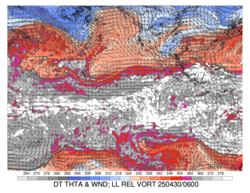
Western North Pacific
Click image for latest 72-h loop
|
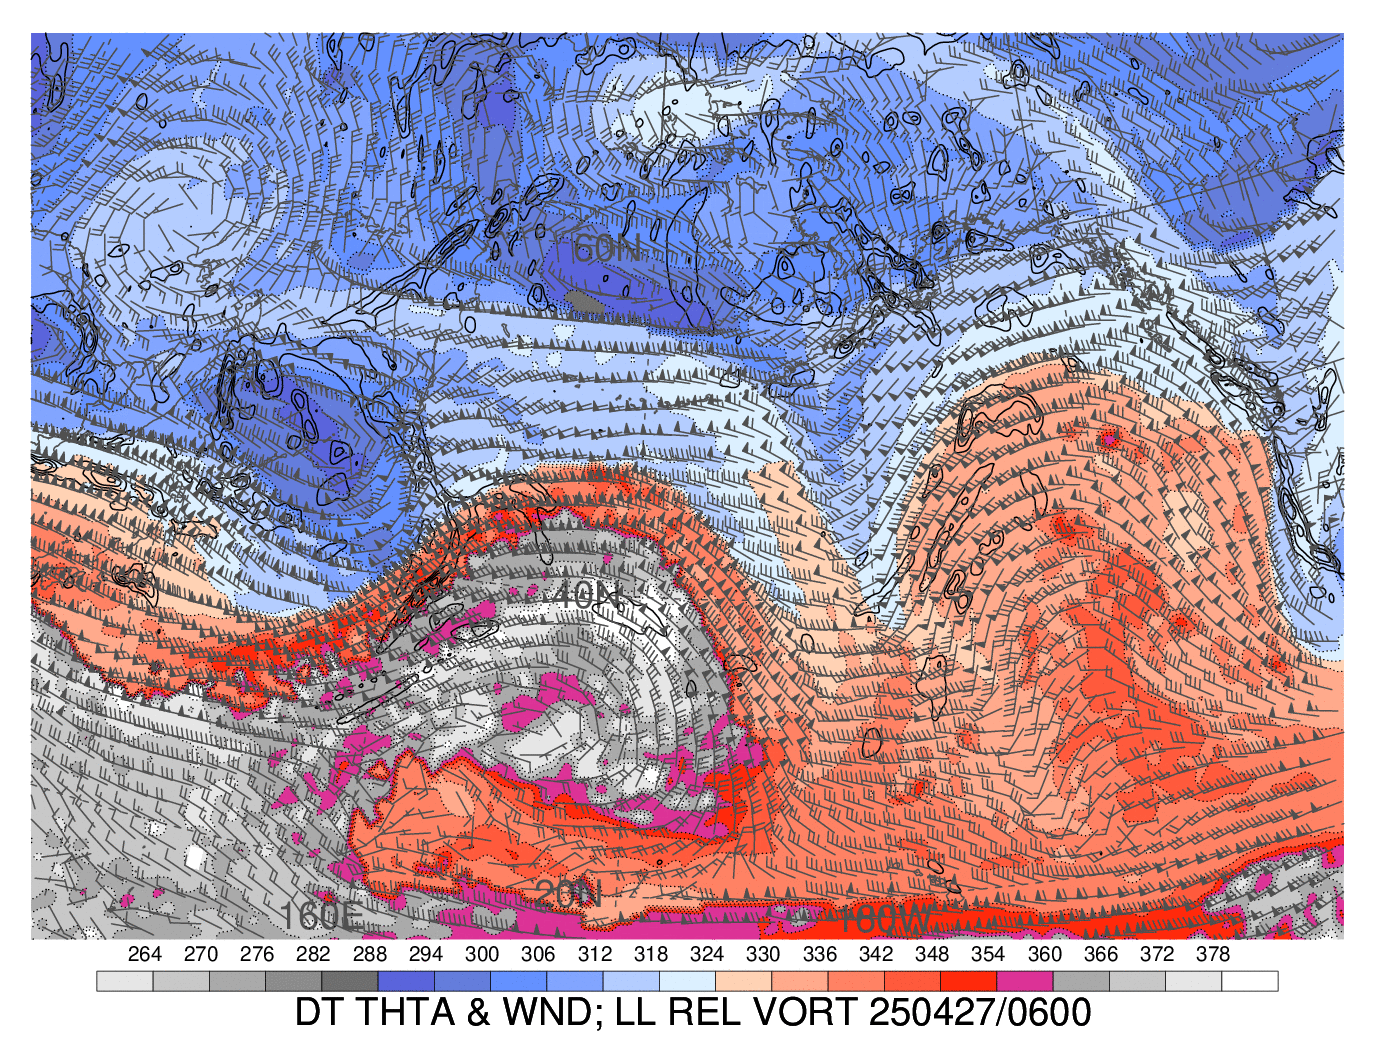
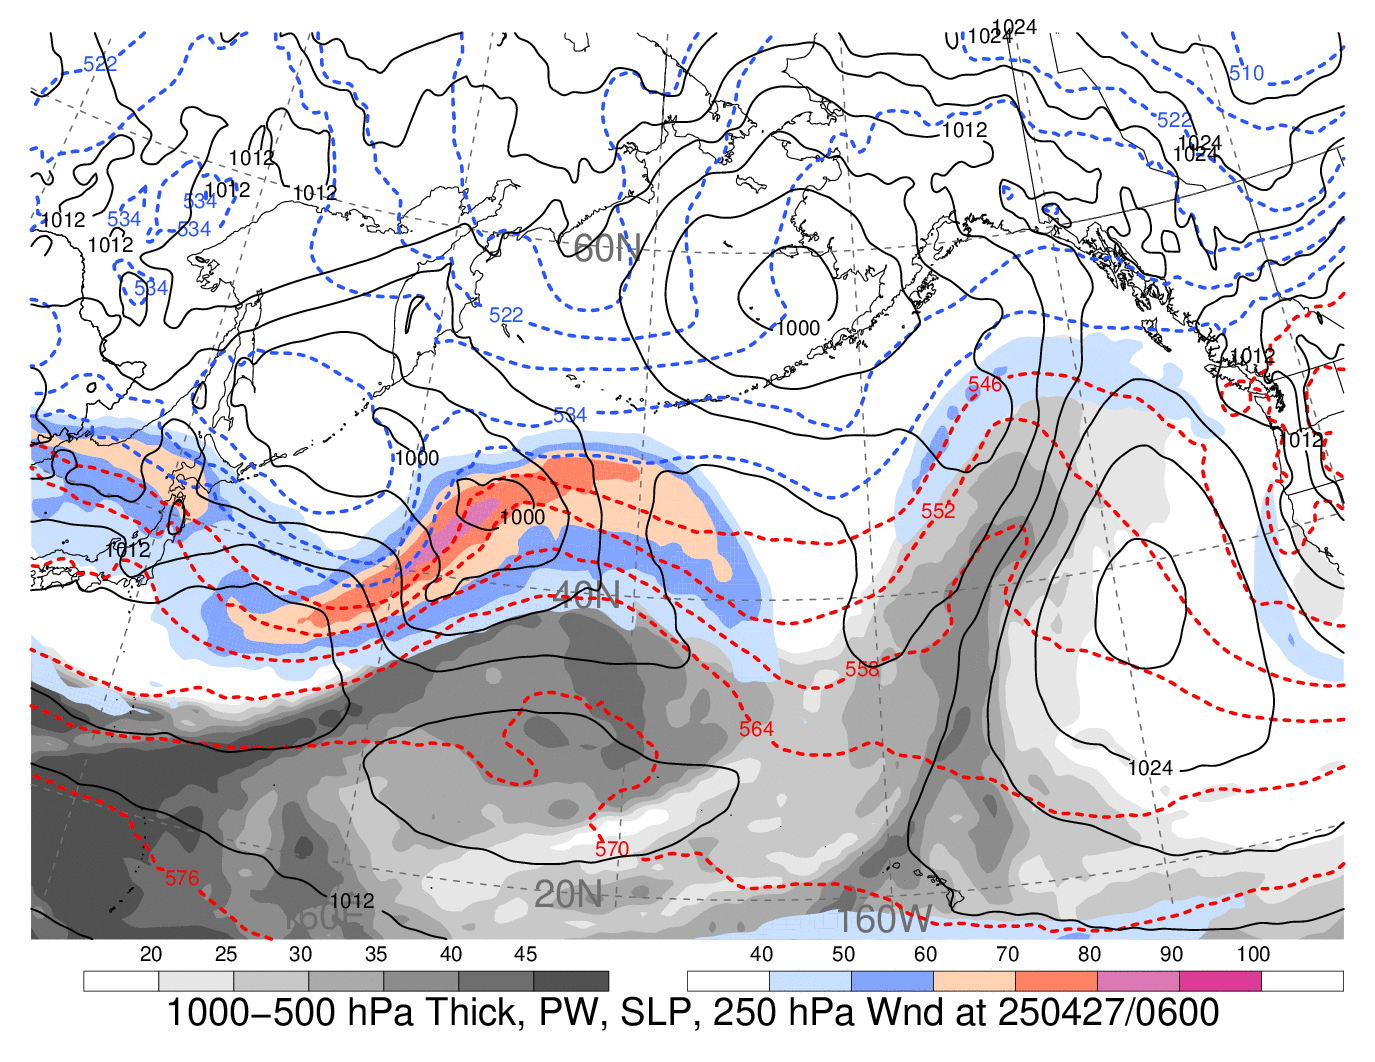
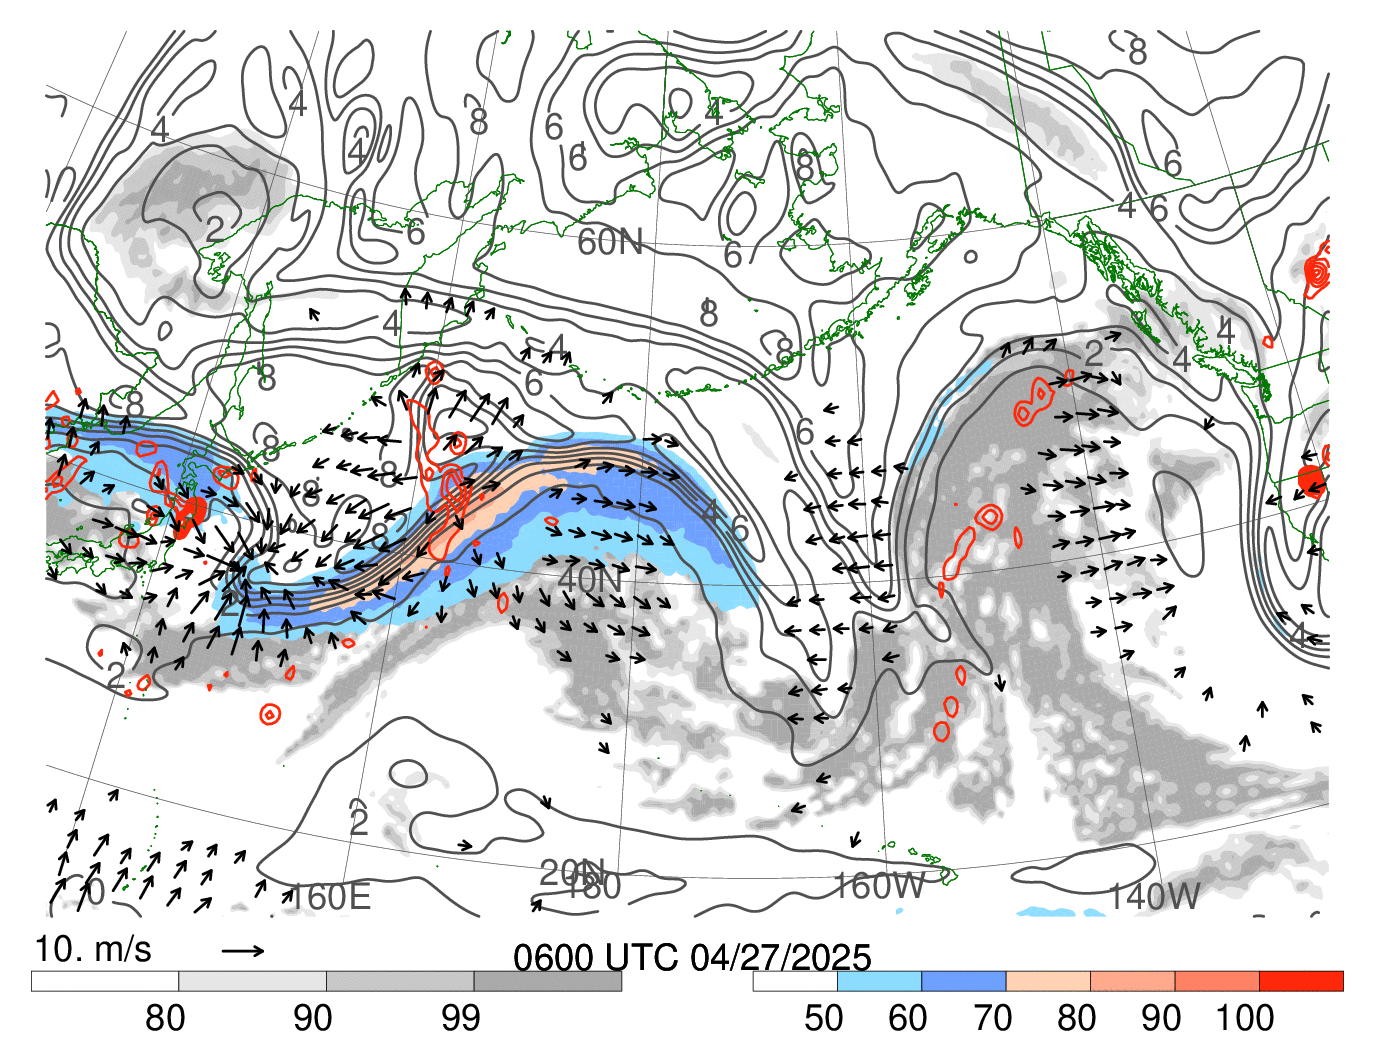
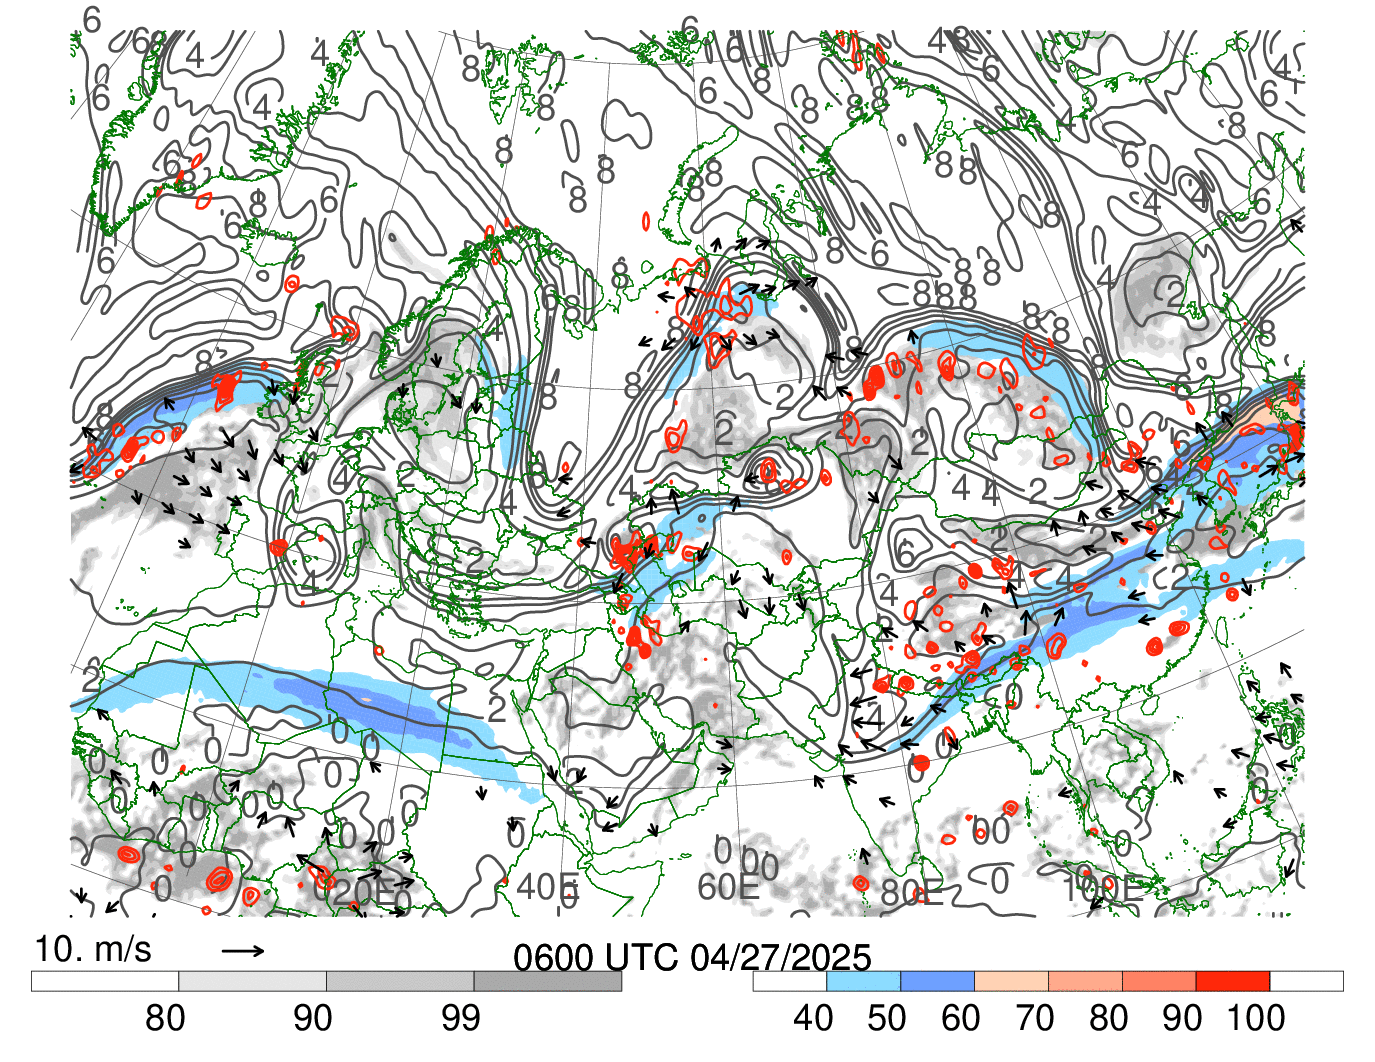
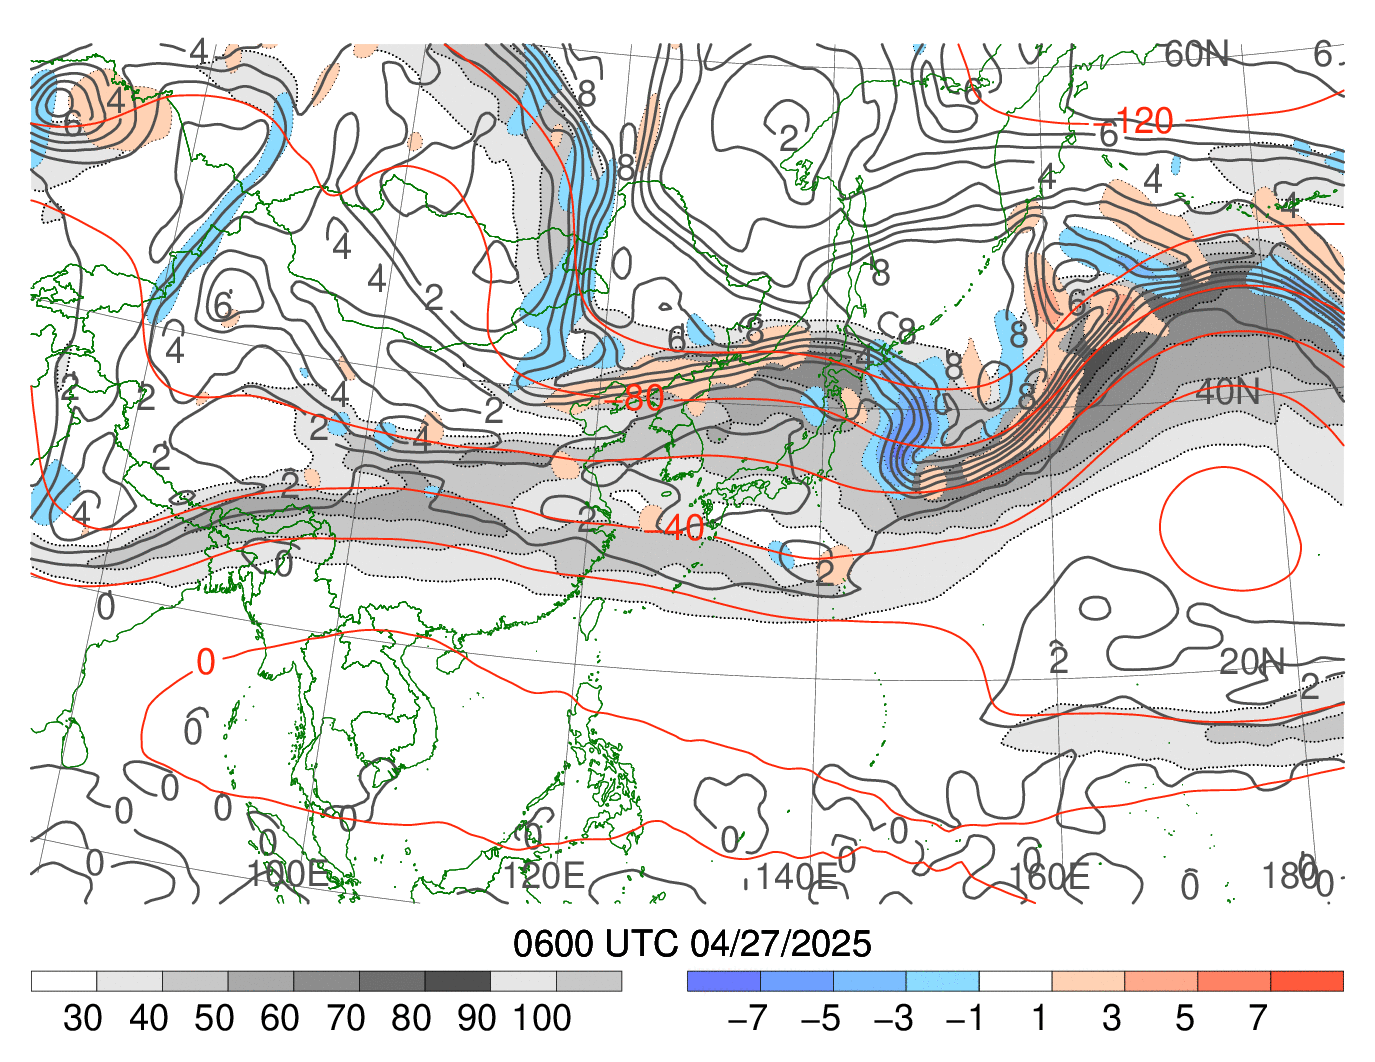
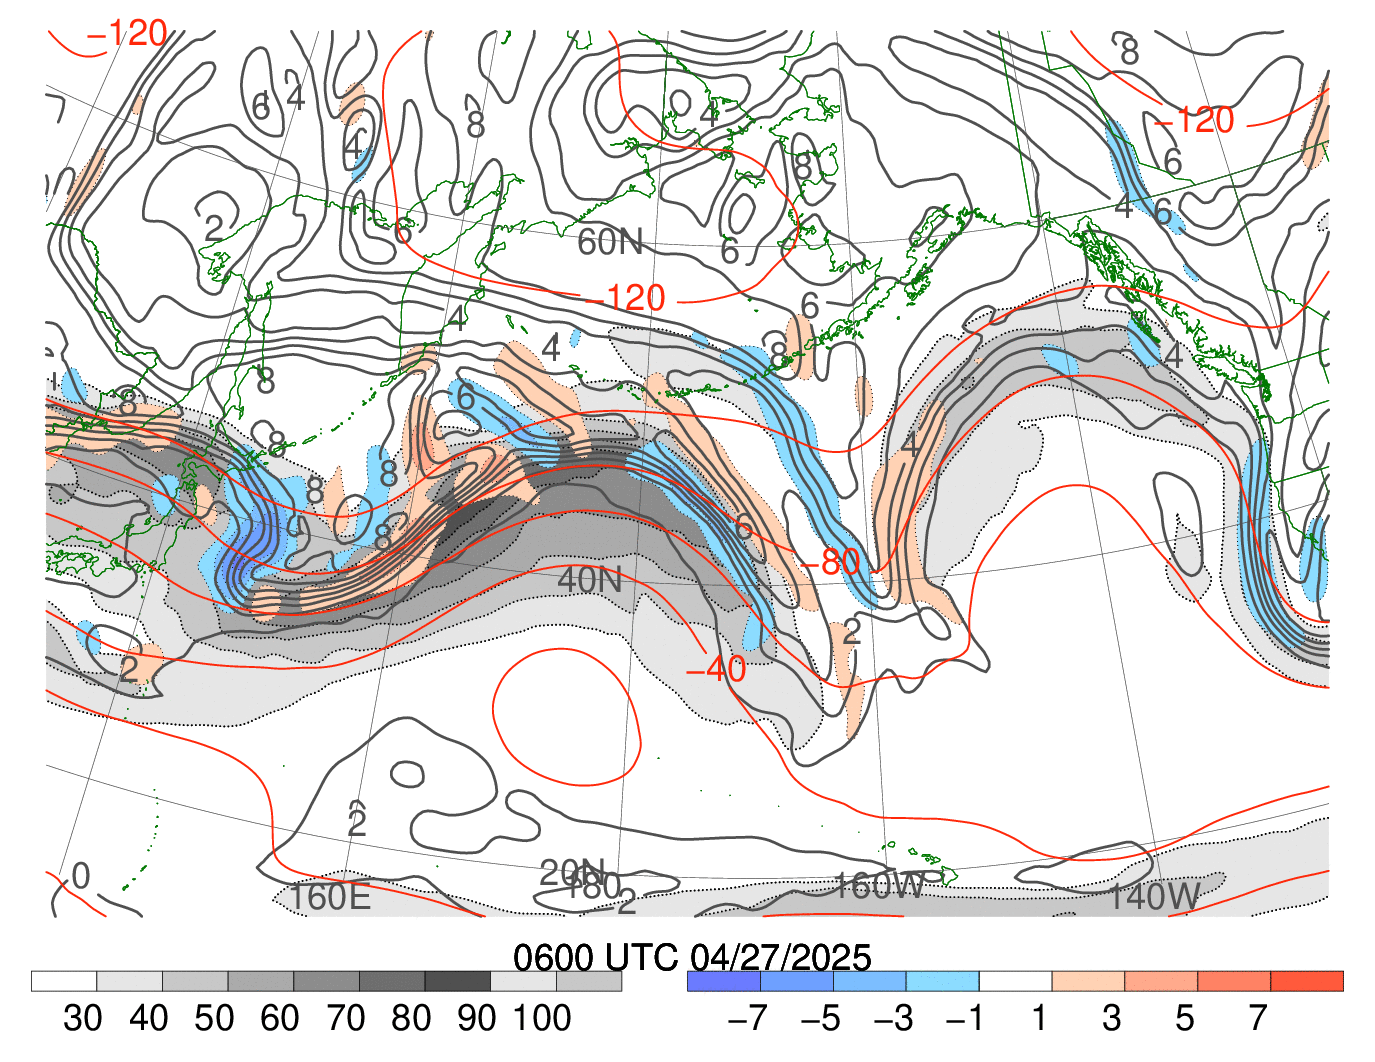
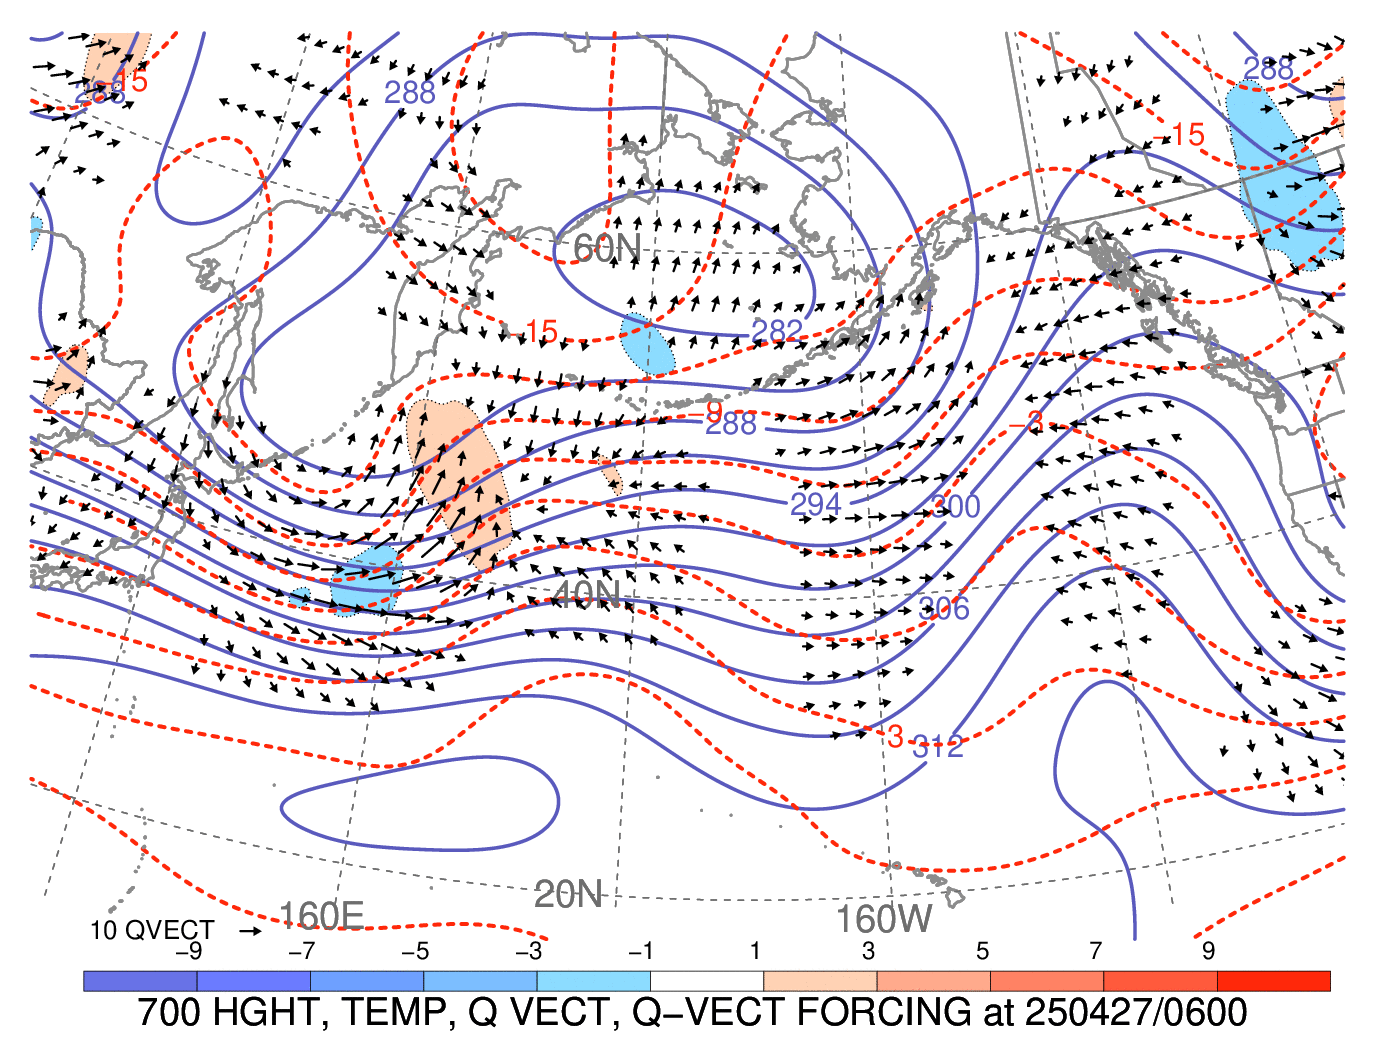
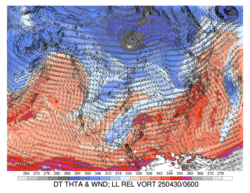
North Pacific
Click image for latest 72-h loop
|
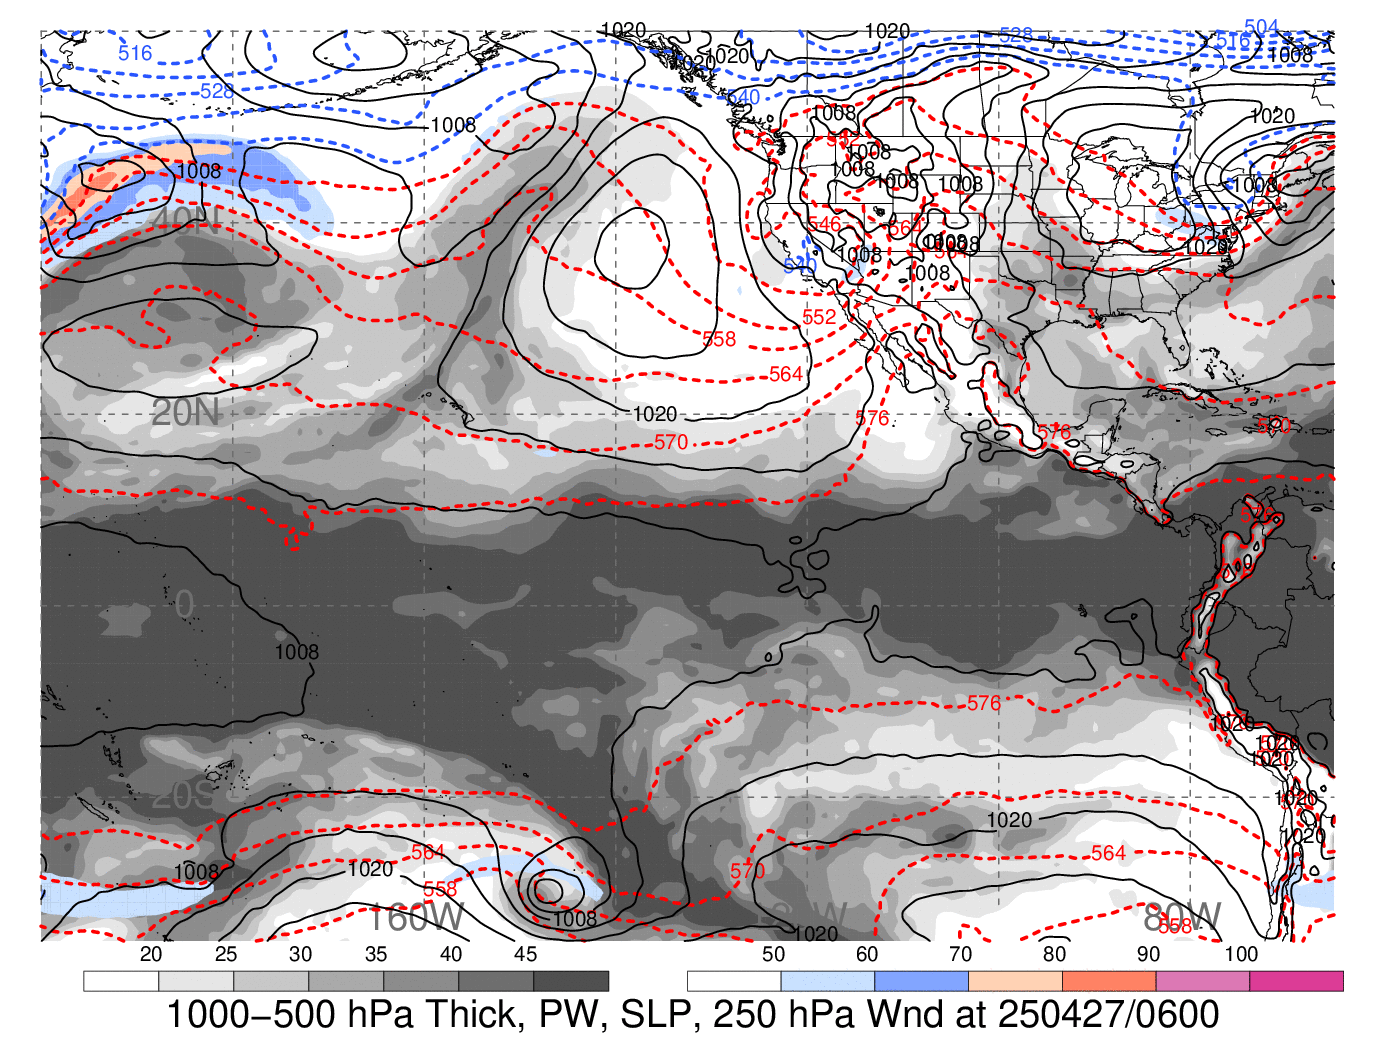
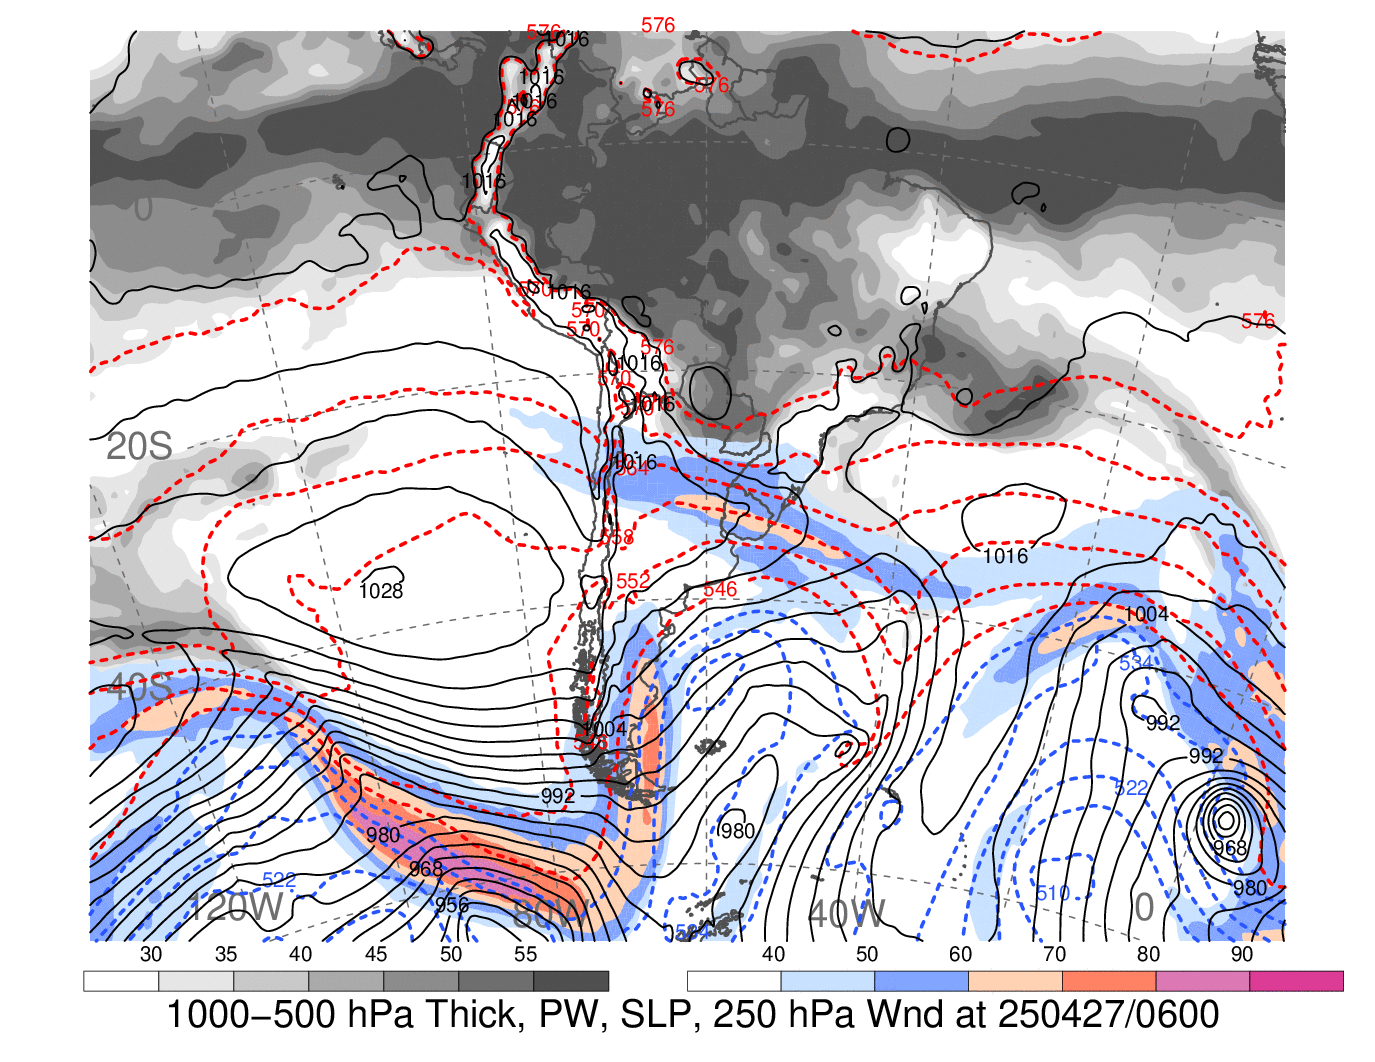
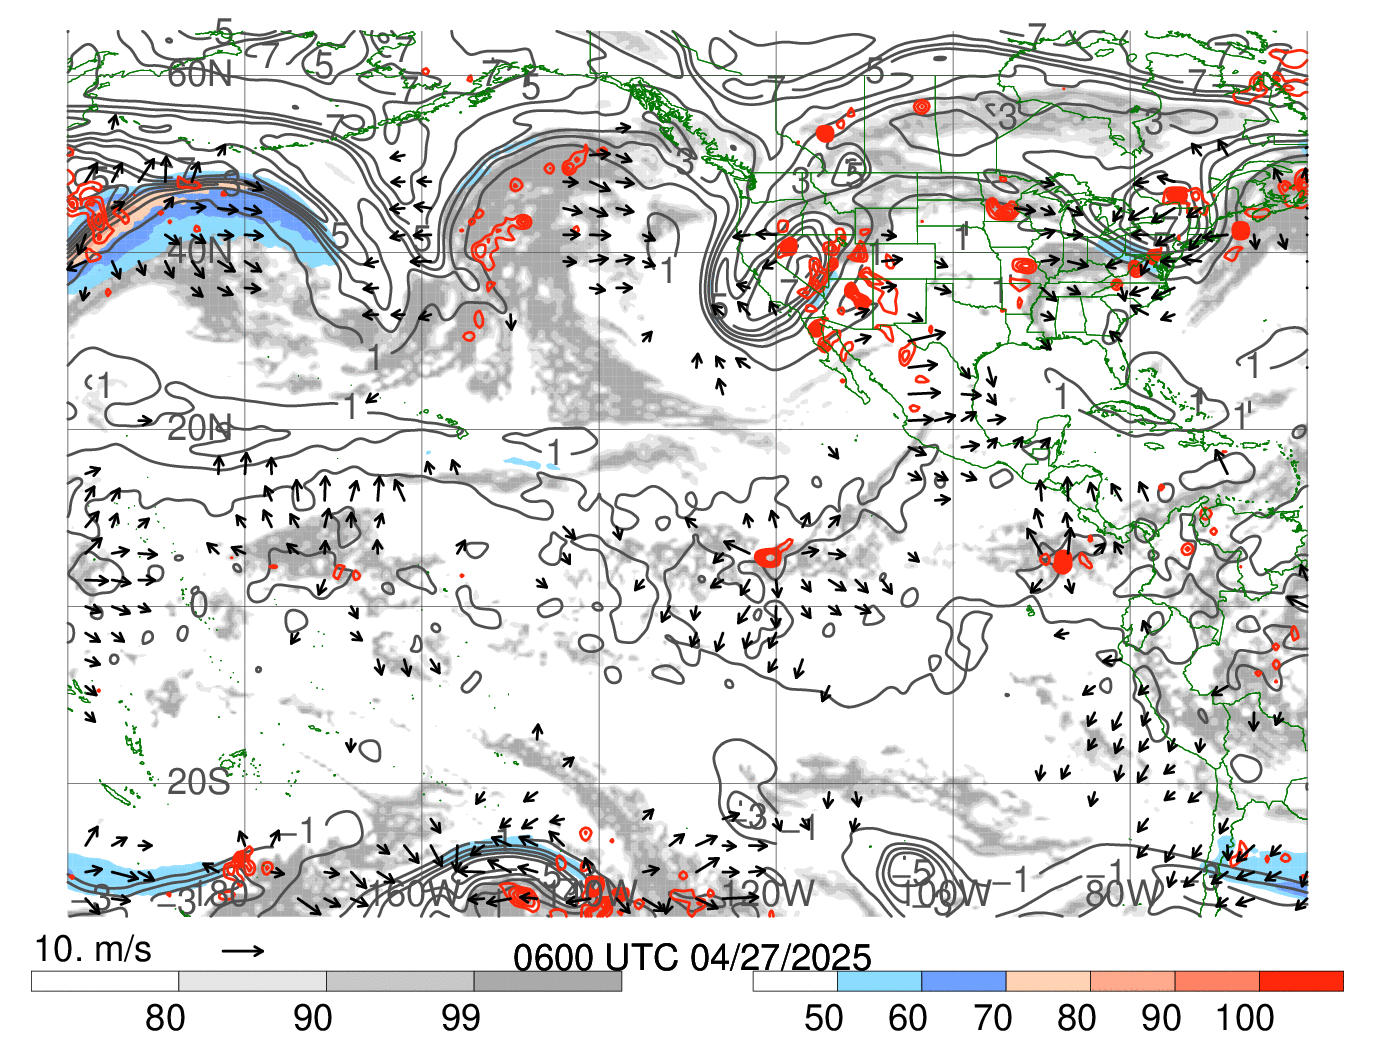
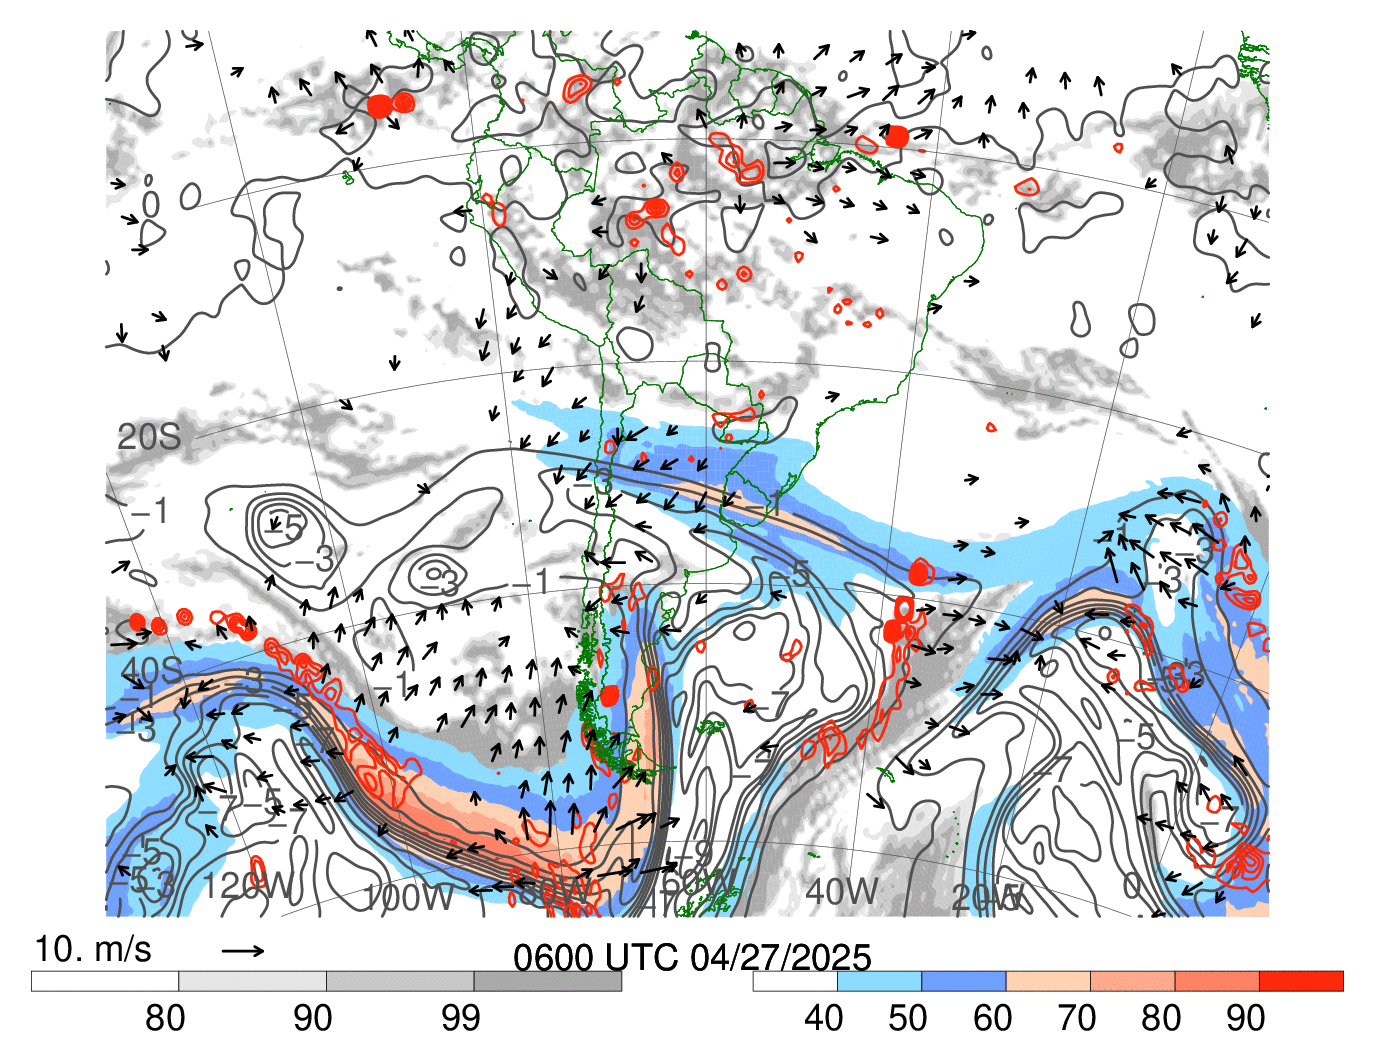
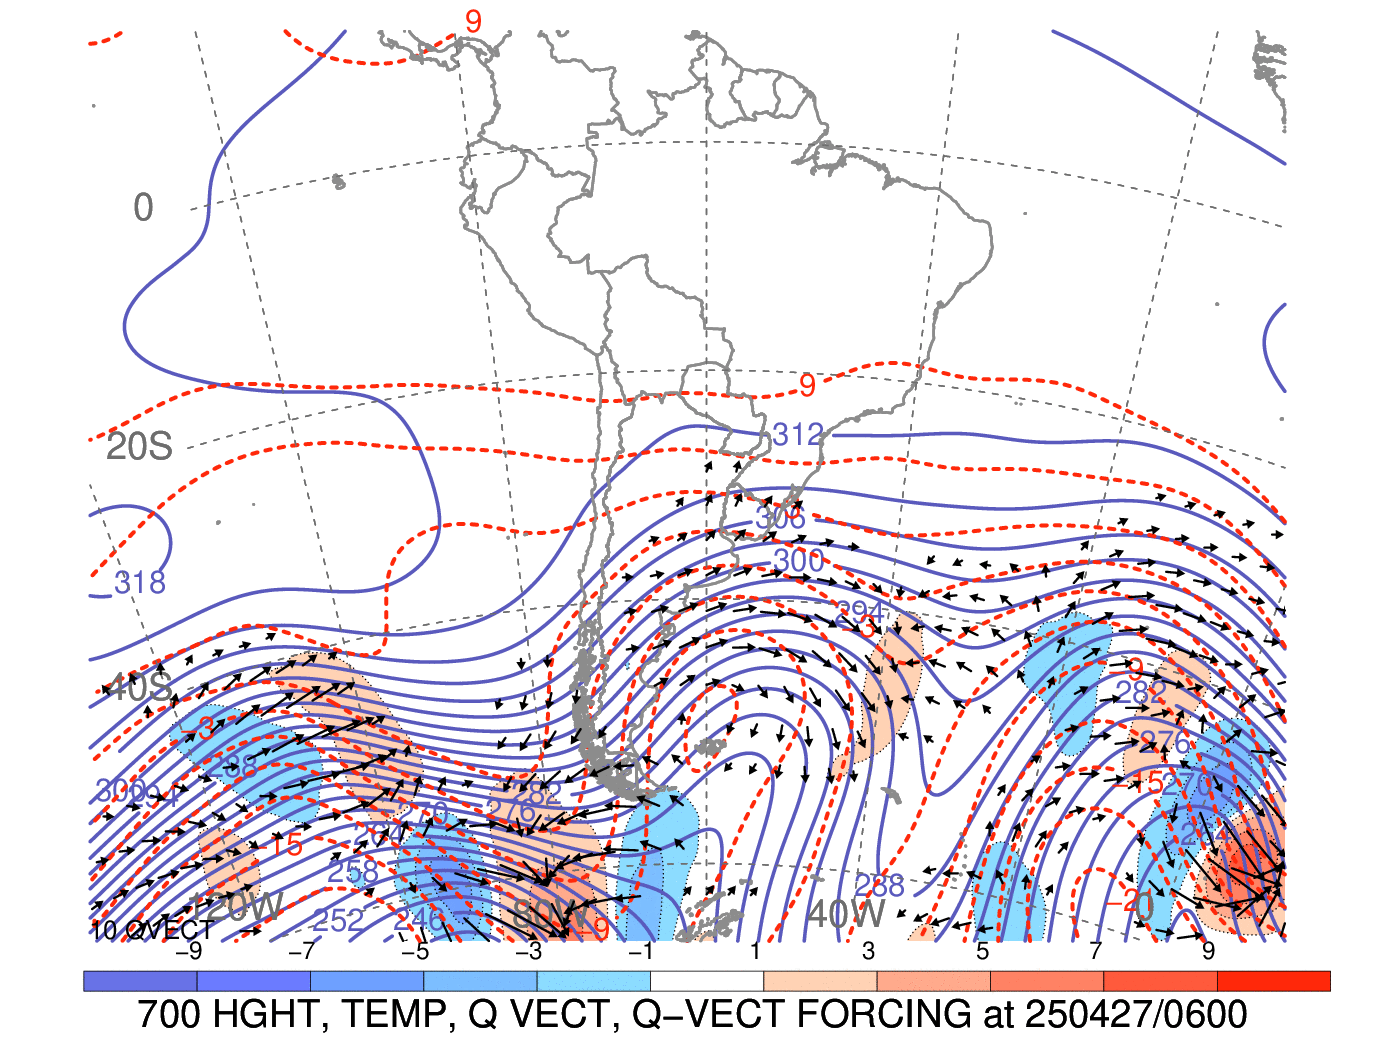
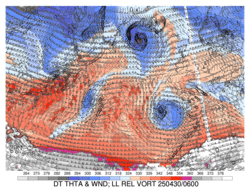
Tropical East Pacific
Click image for latest 72-h loop
|
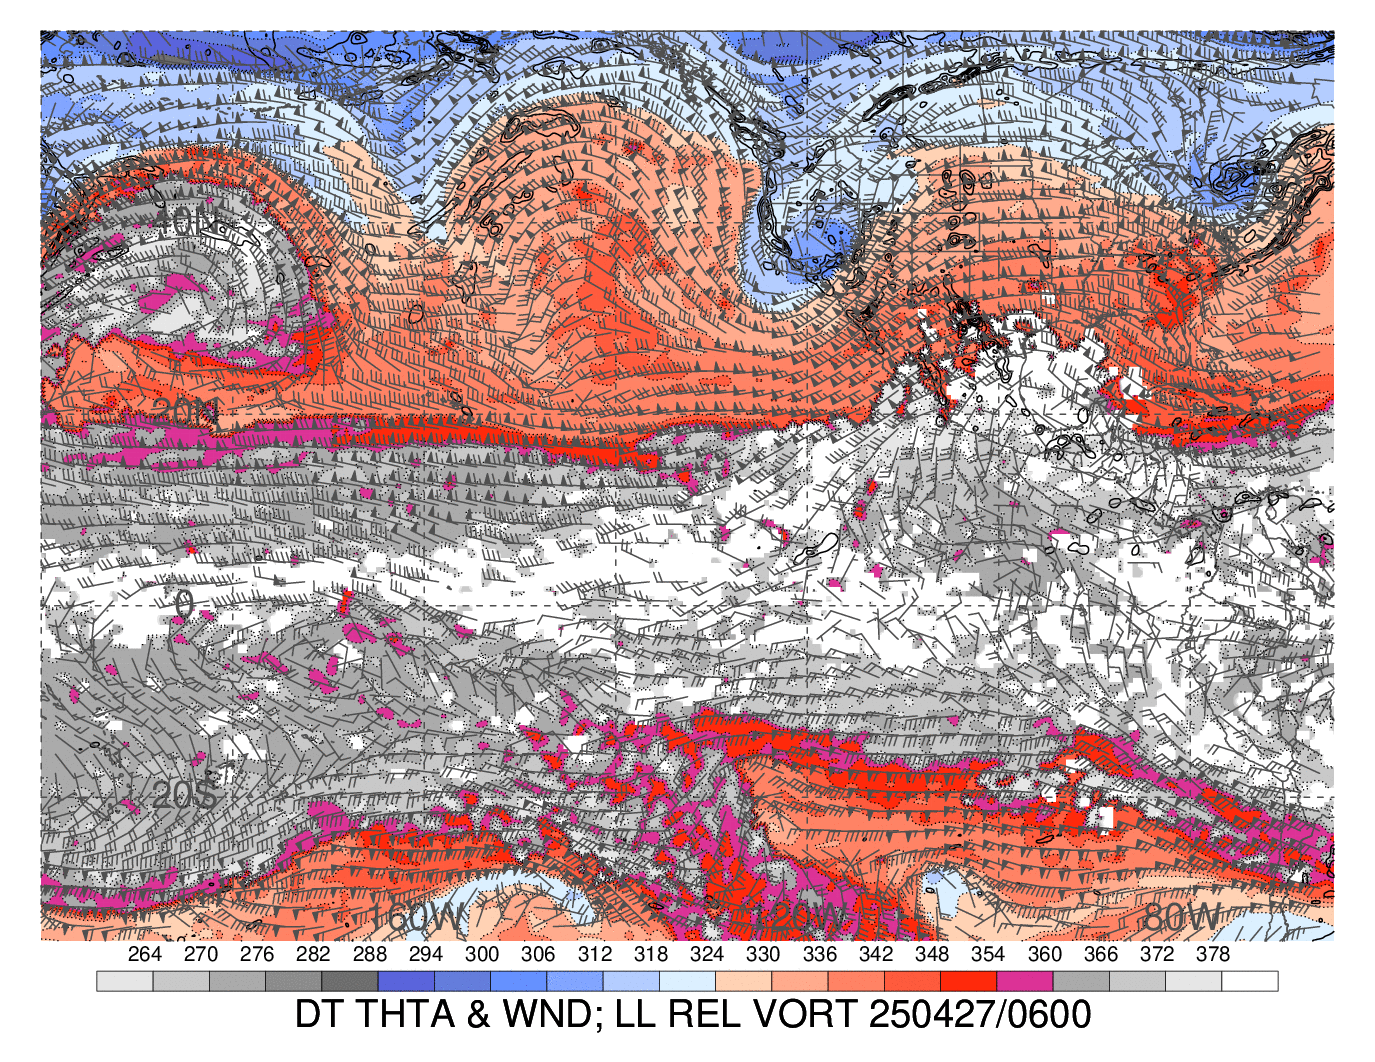
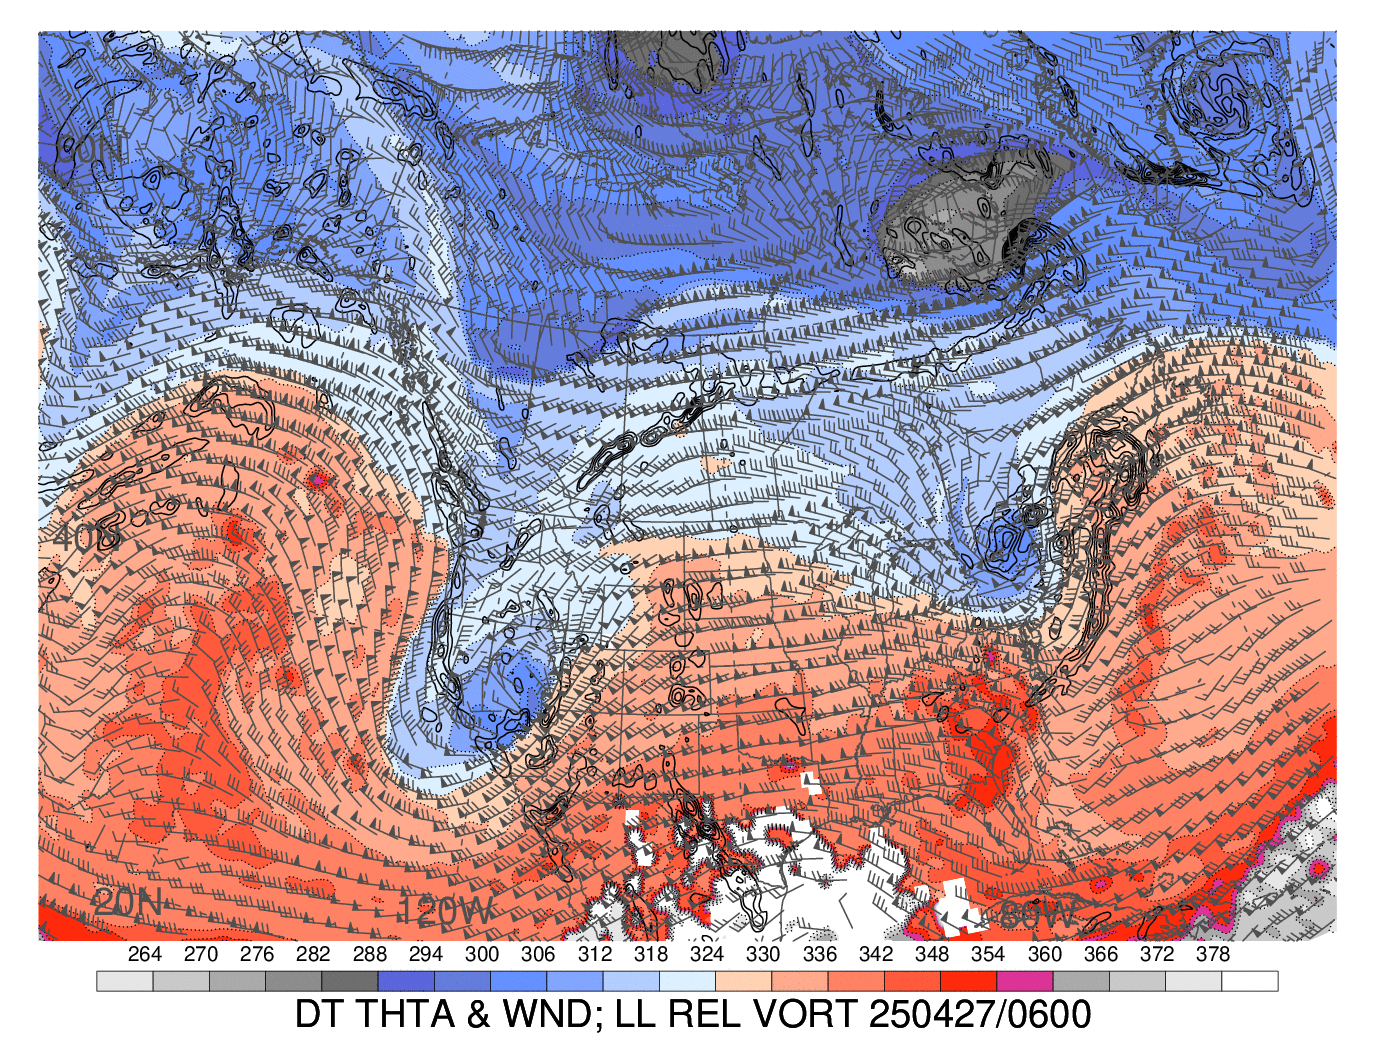
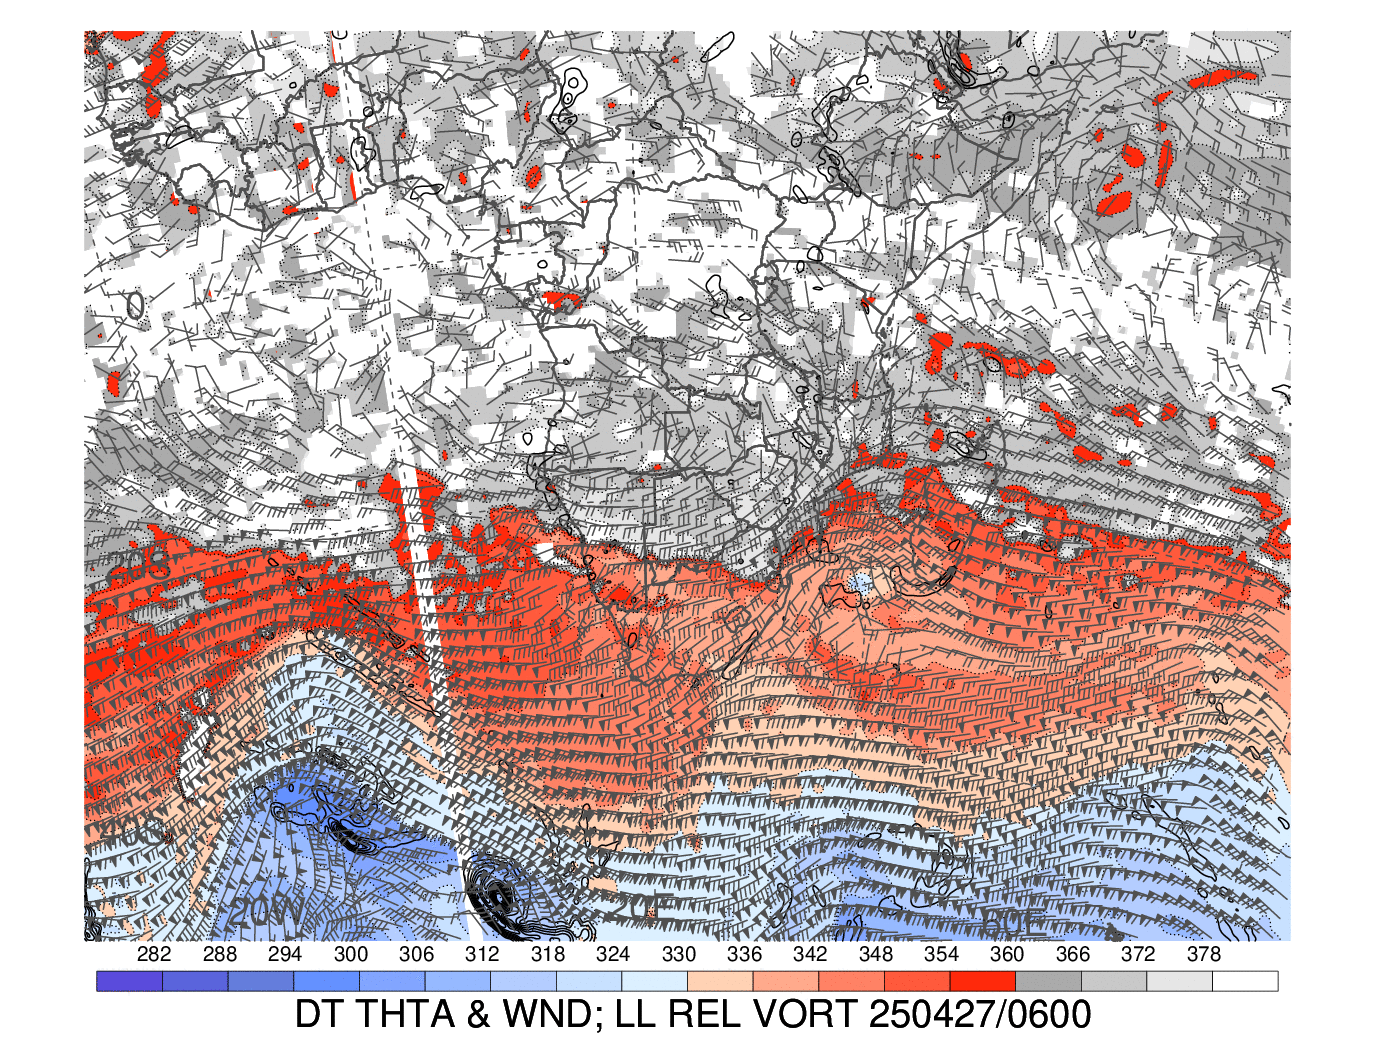
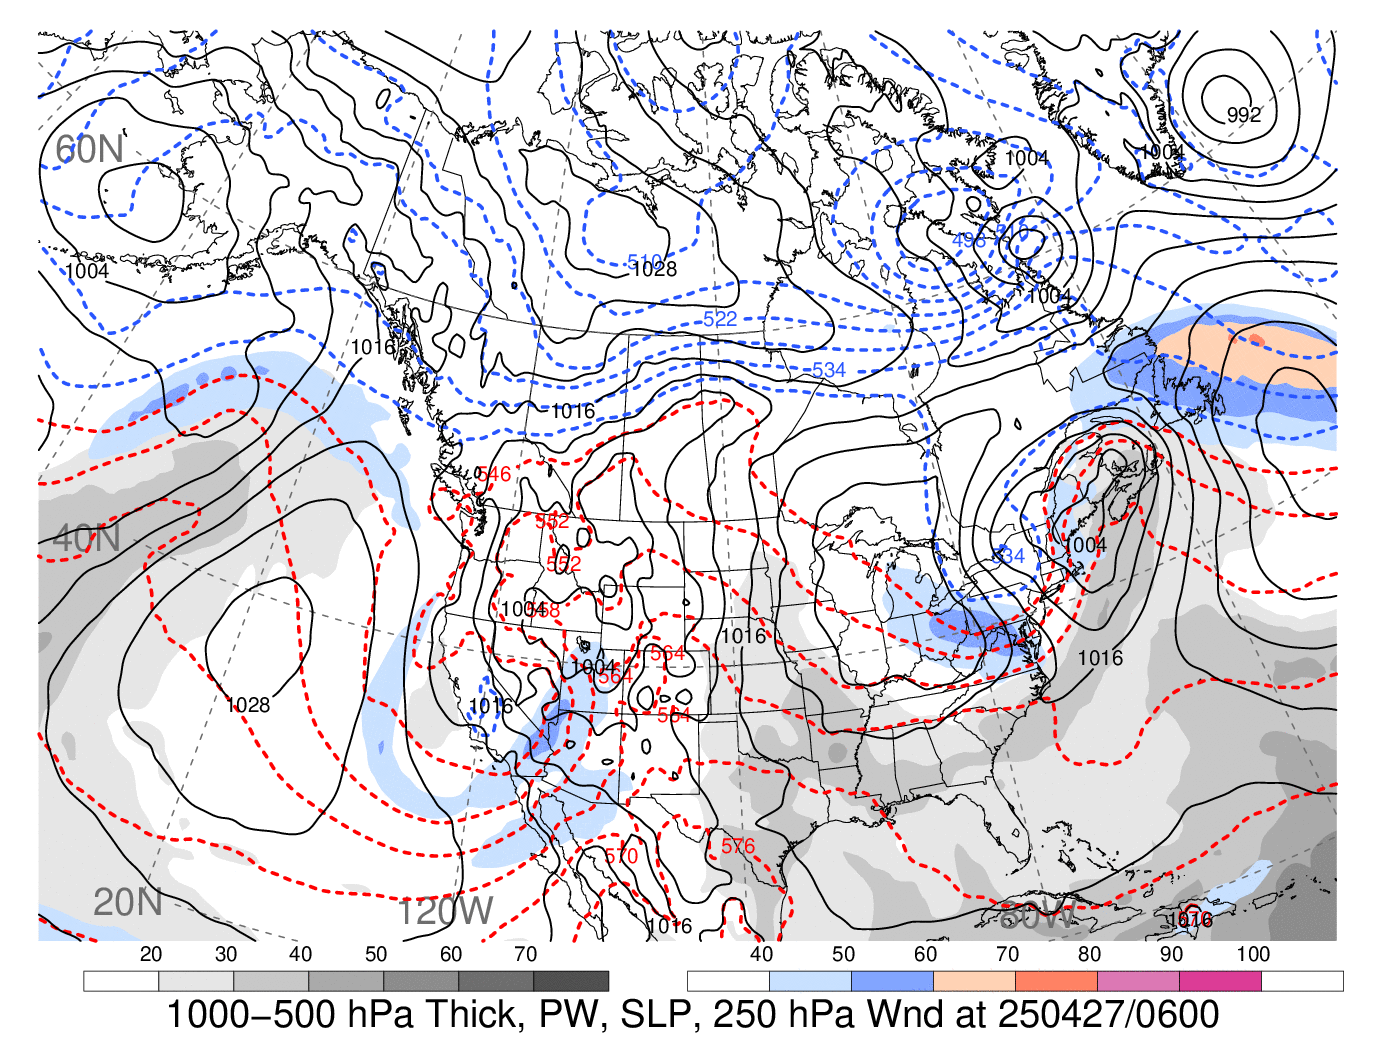
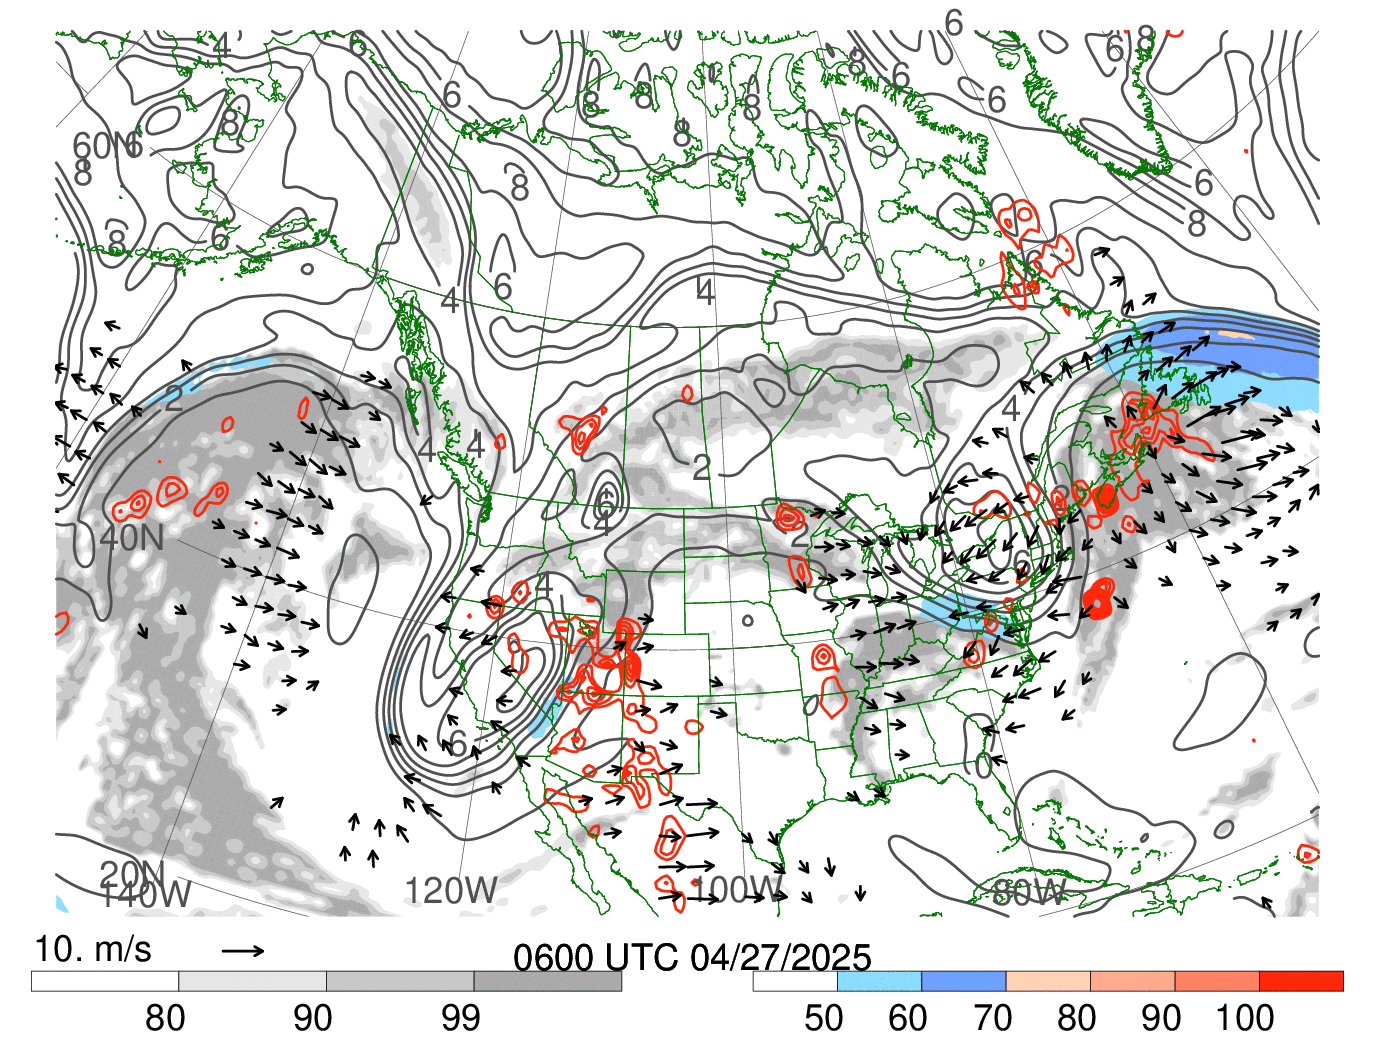
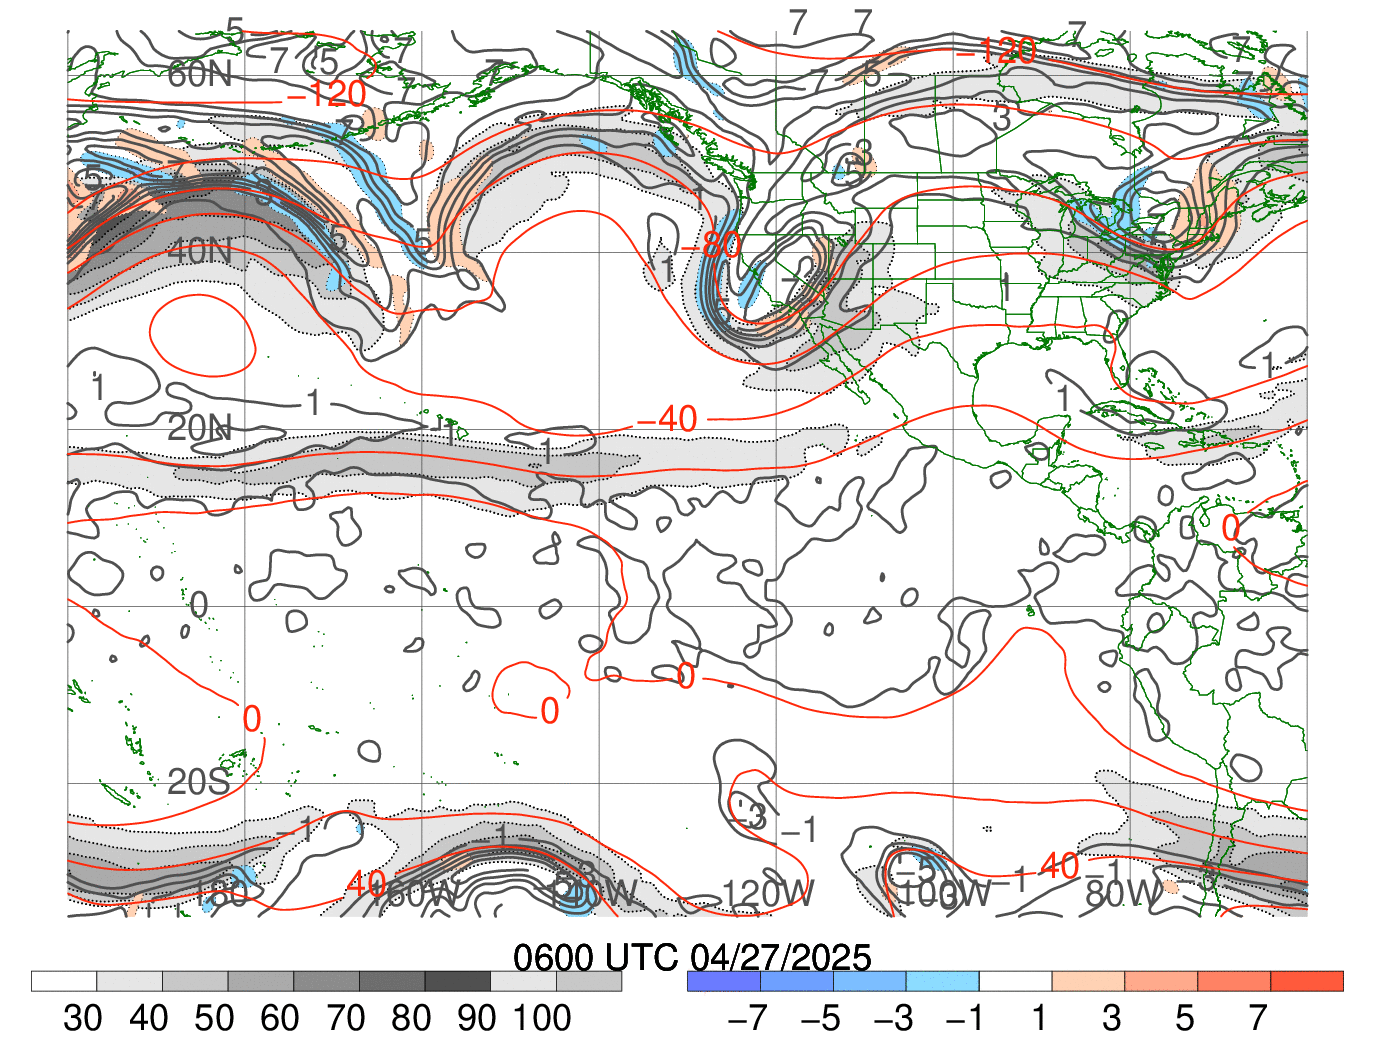
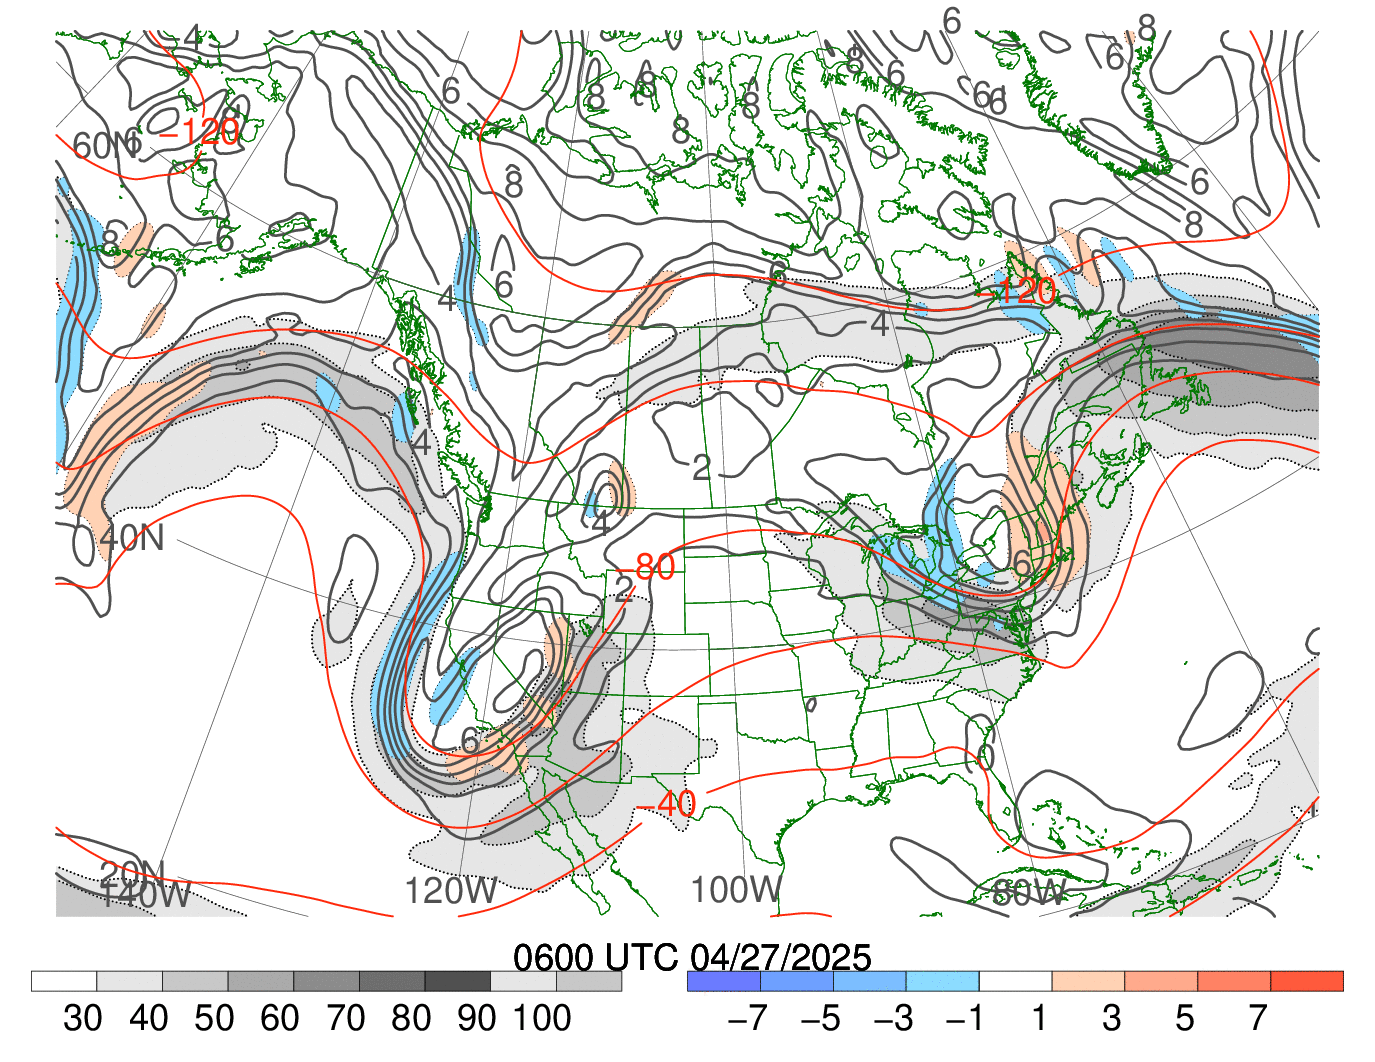
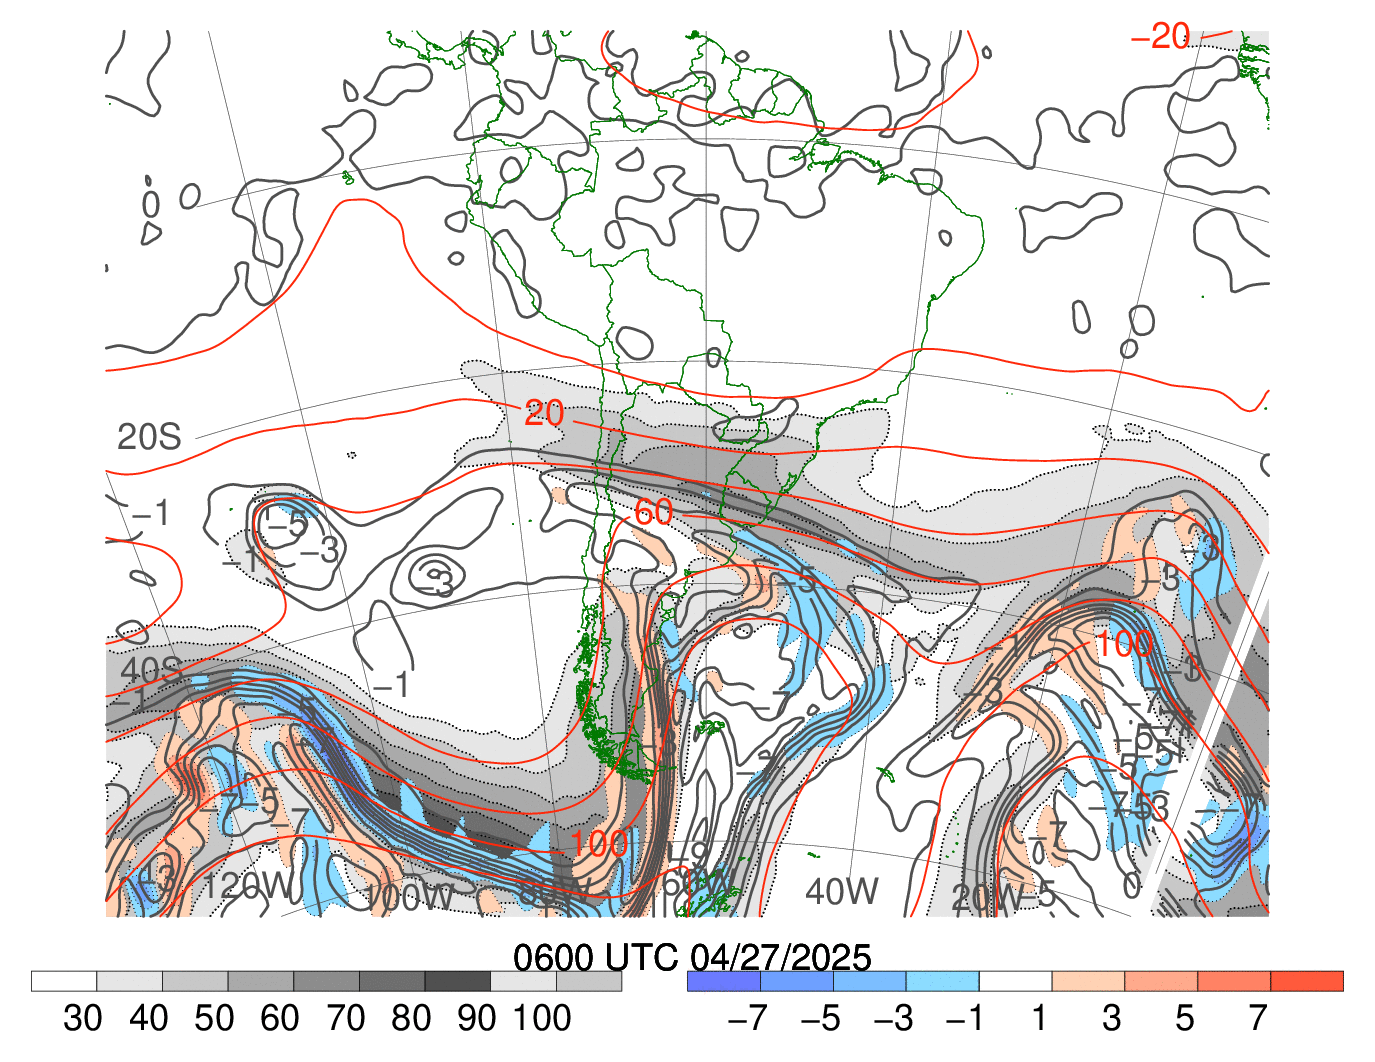
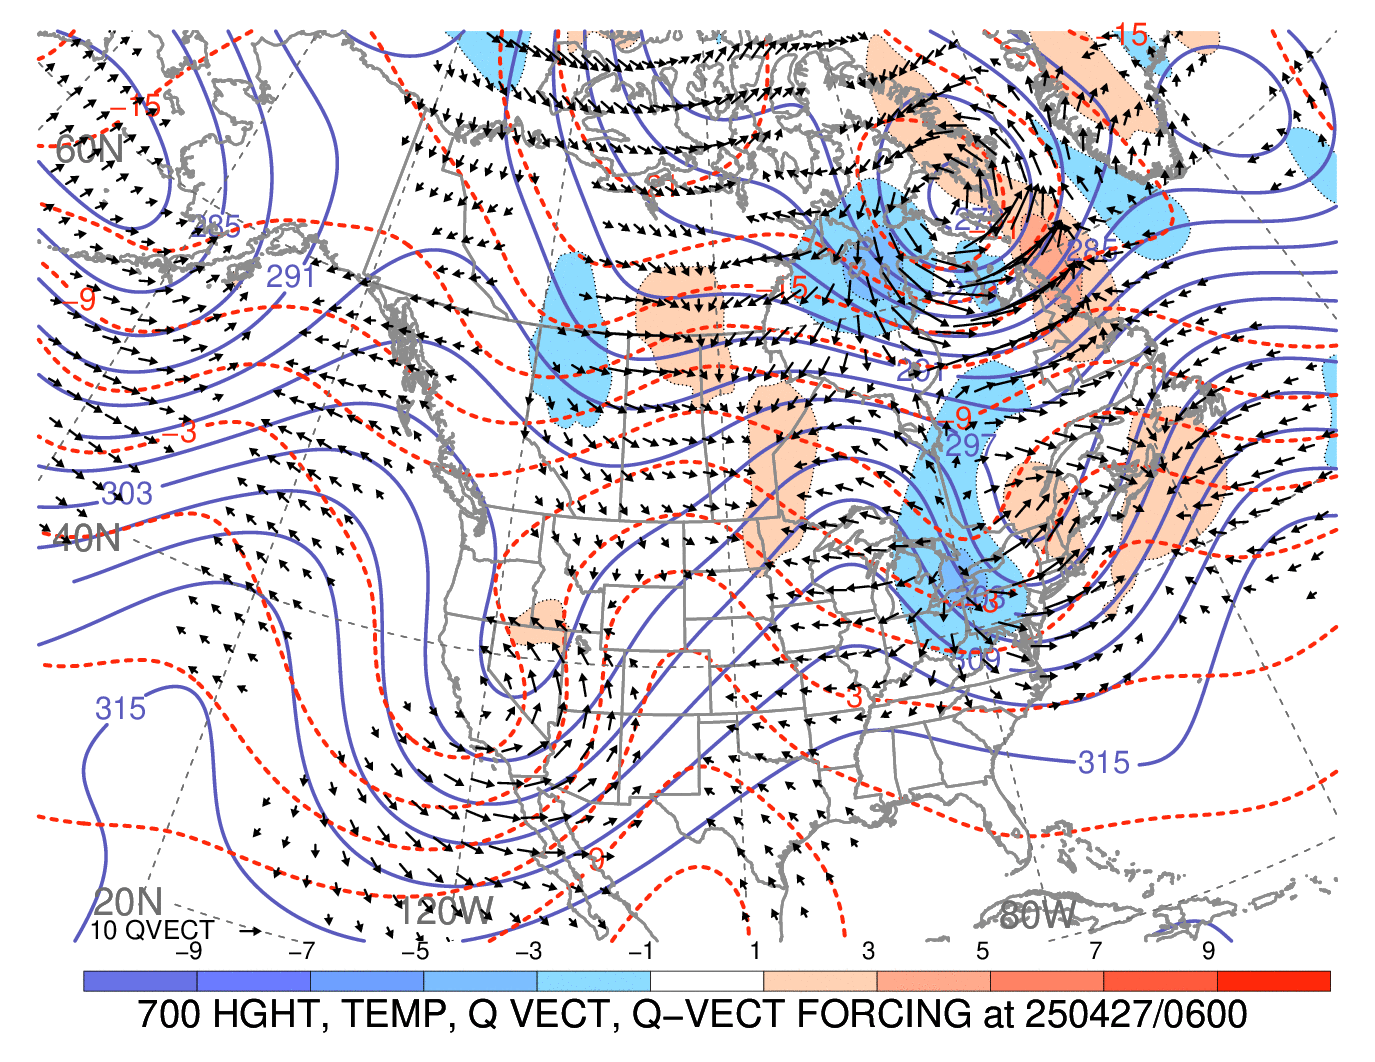
North America
Click image for latest 72-h loop
|
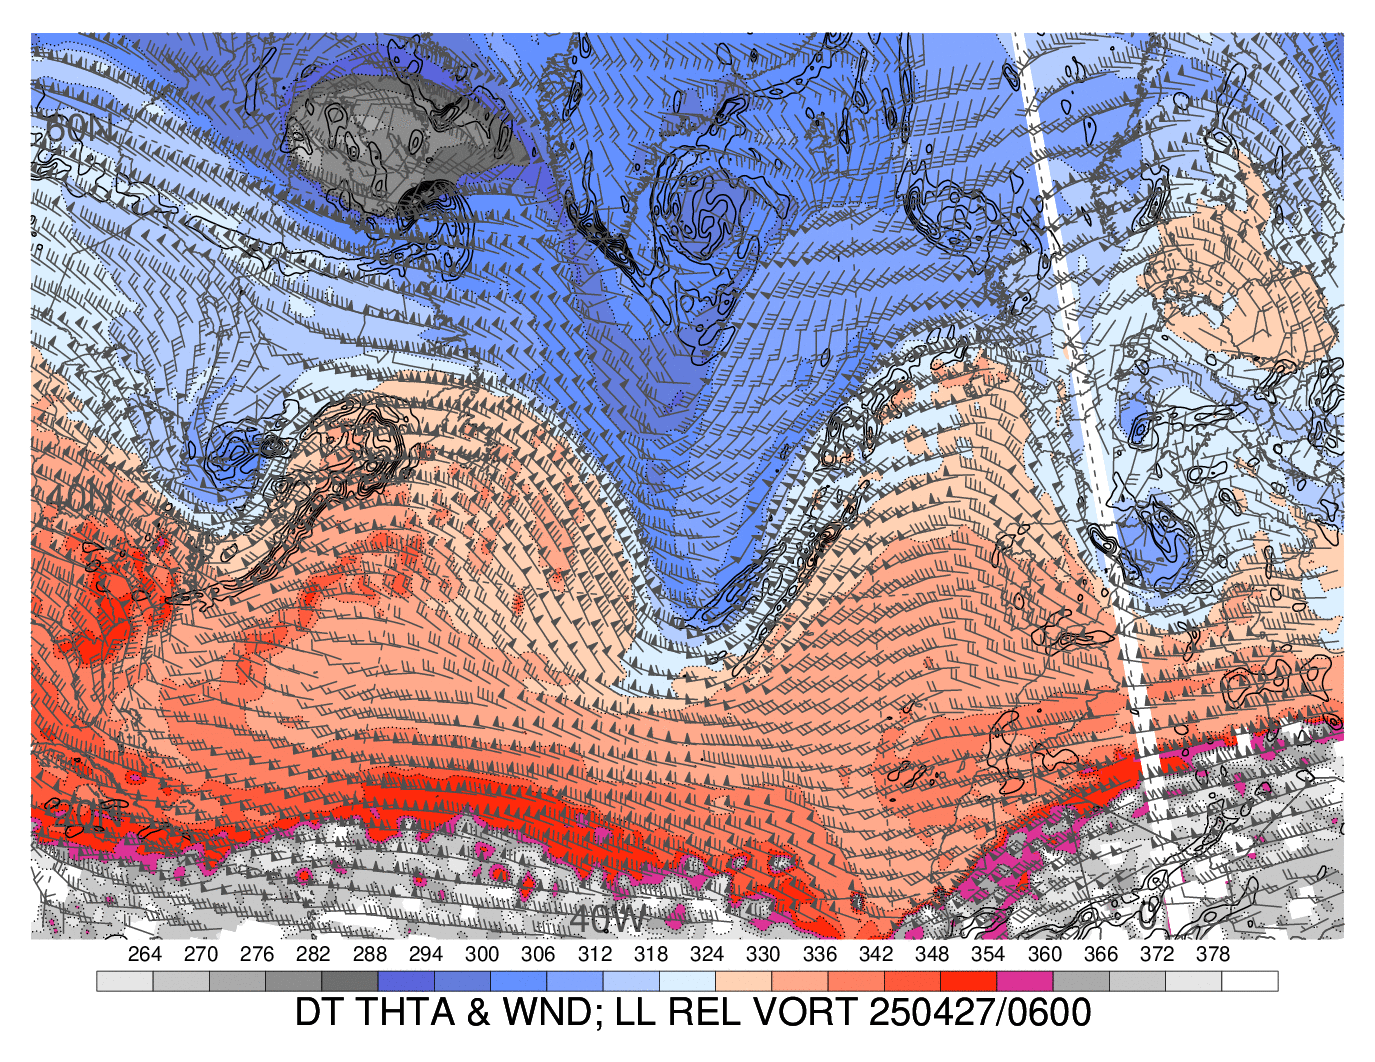
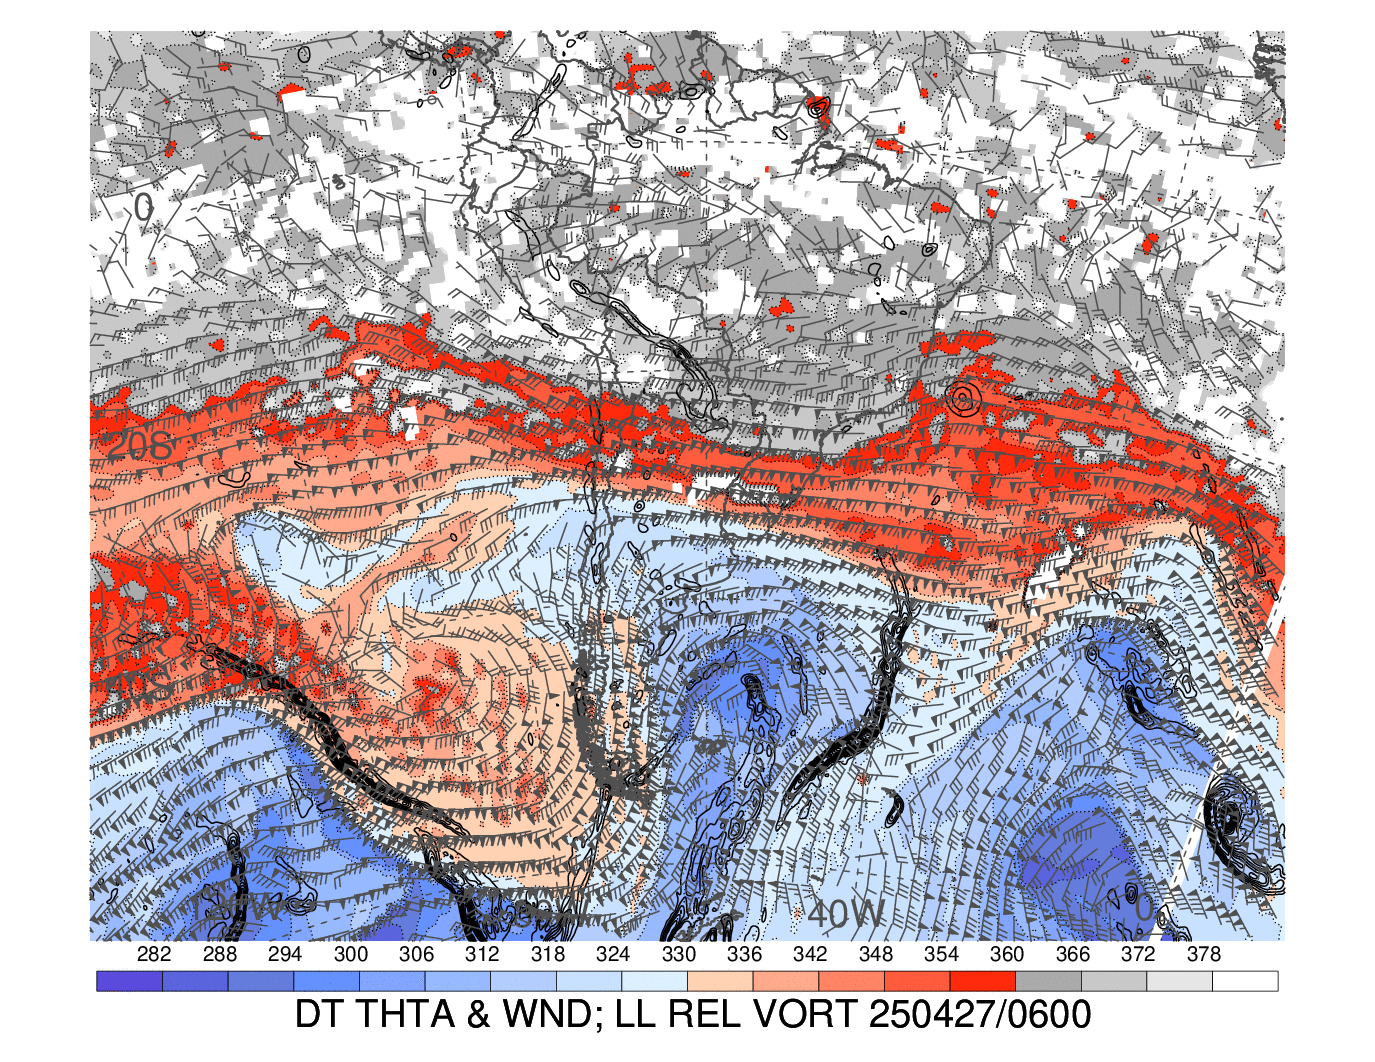
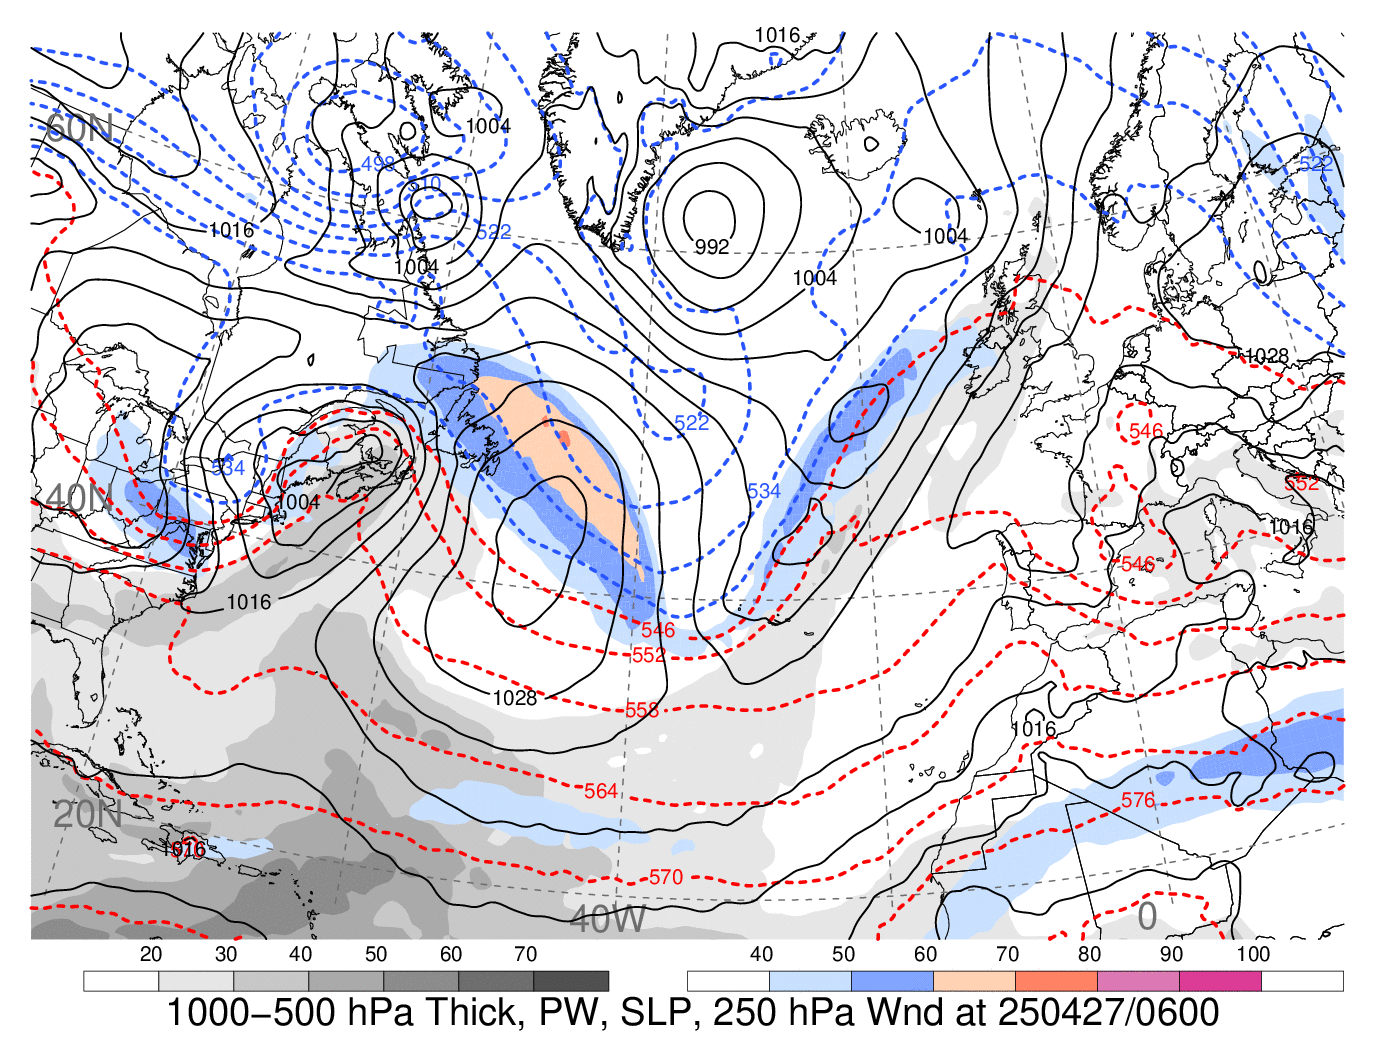
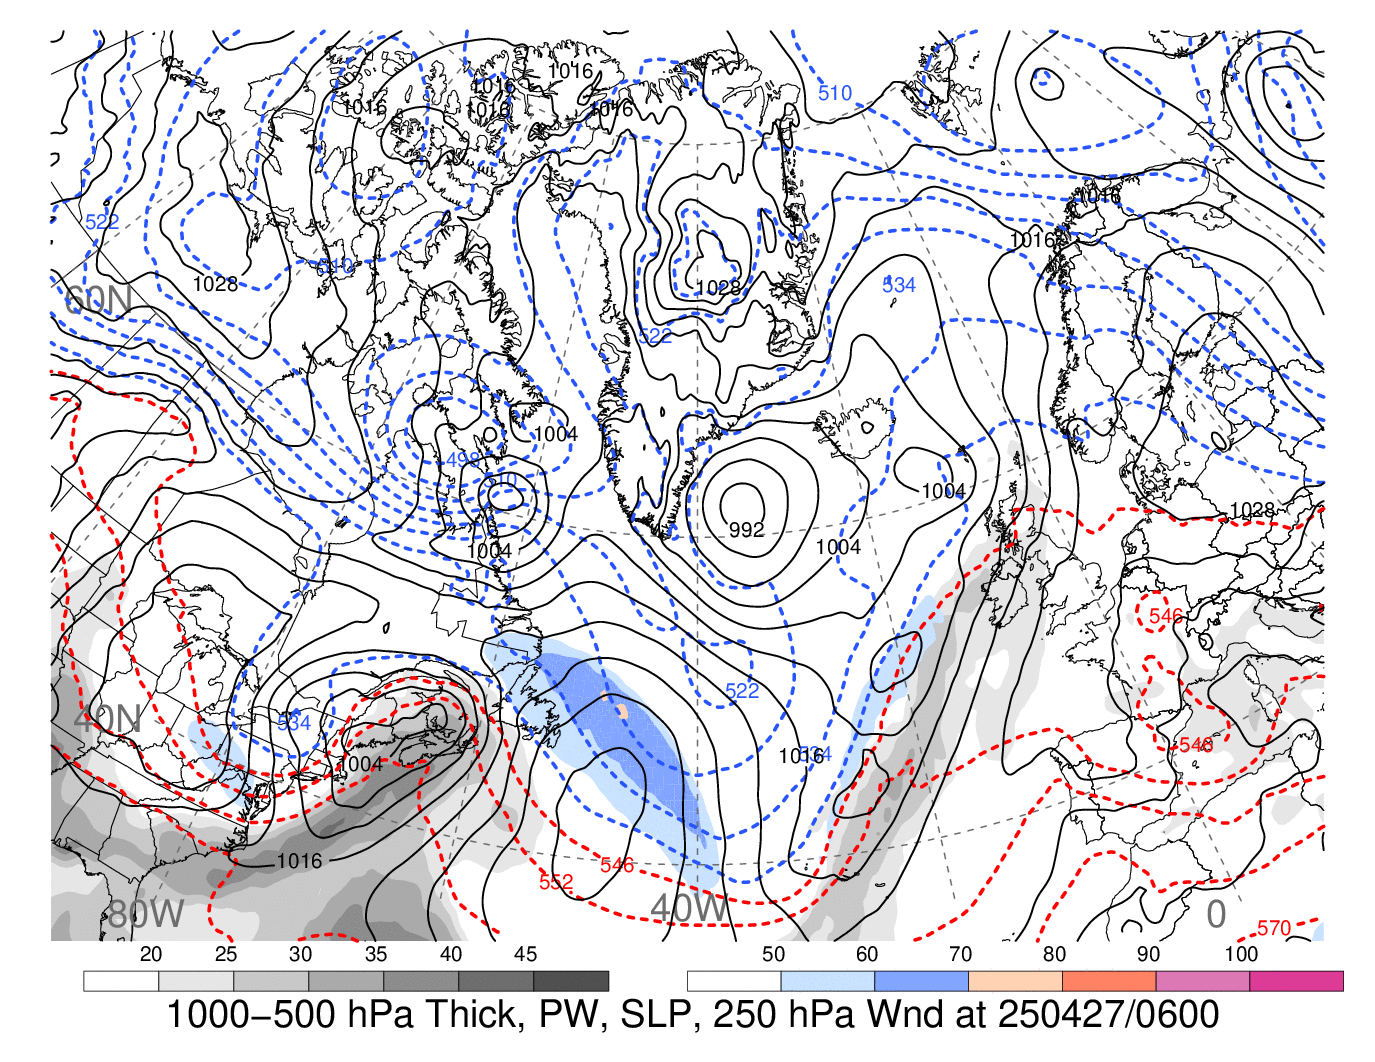
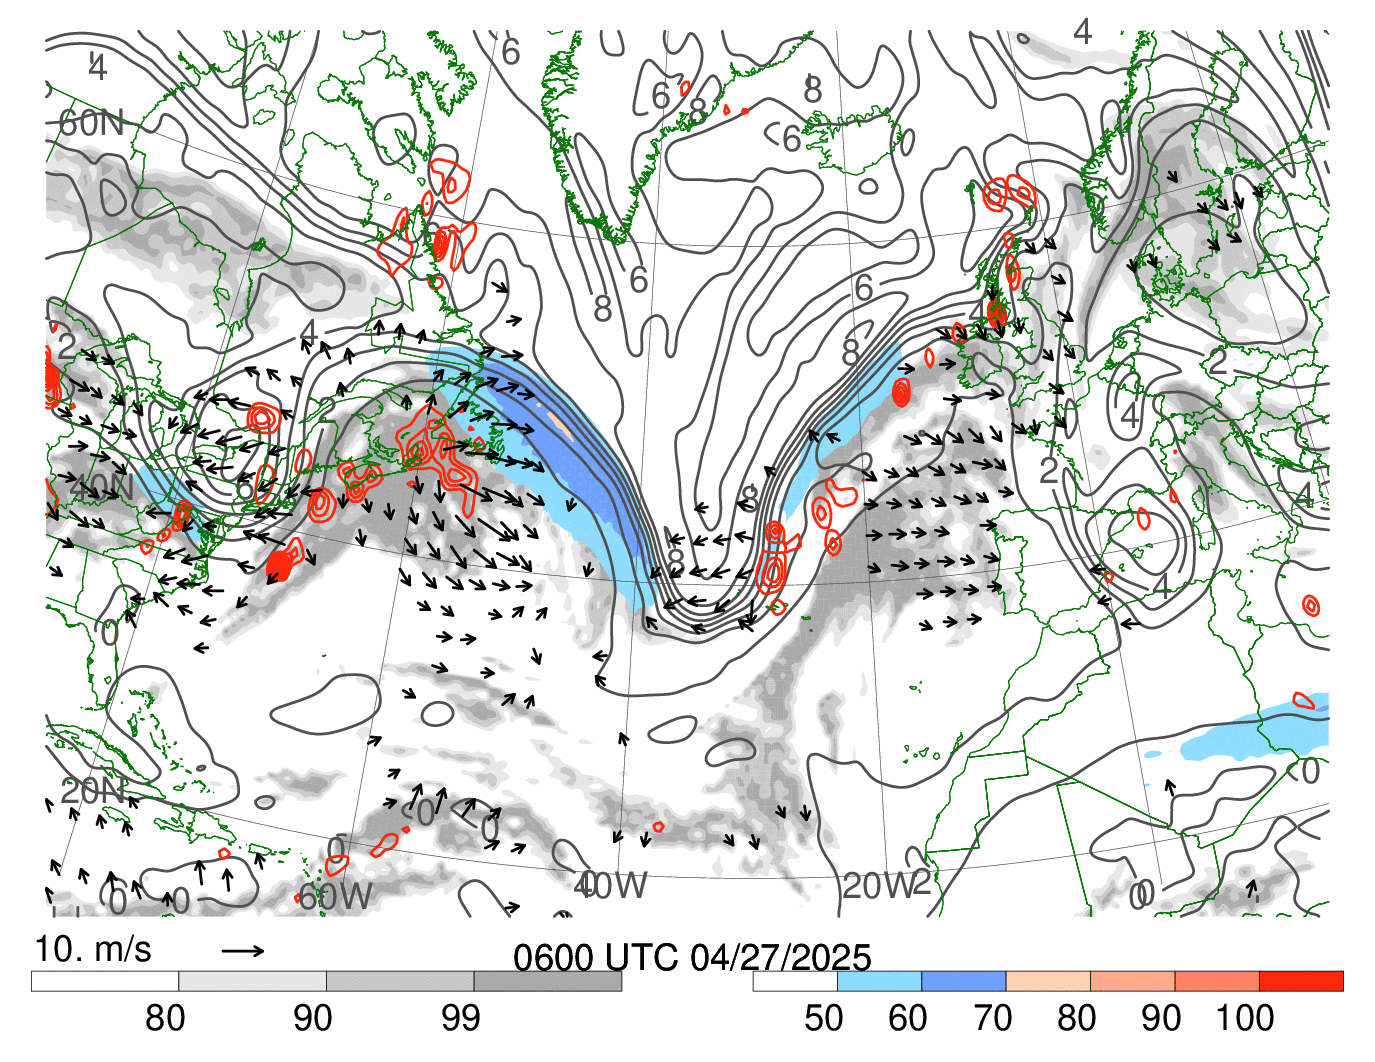
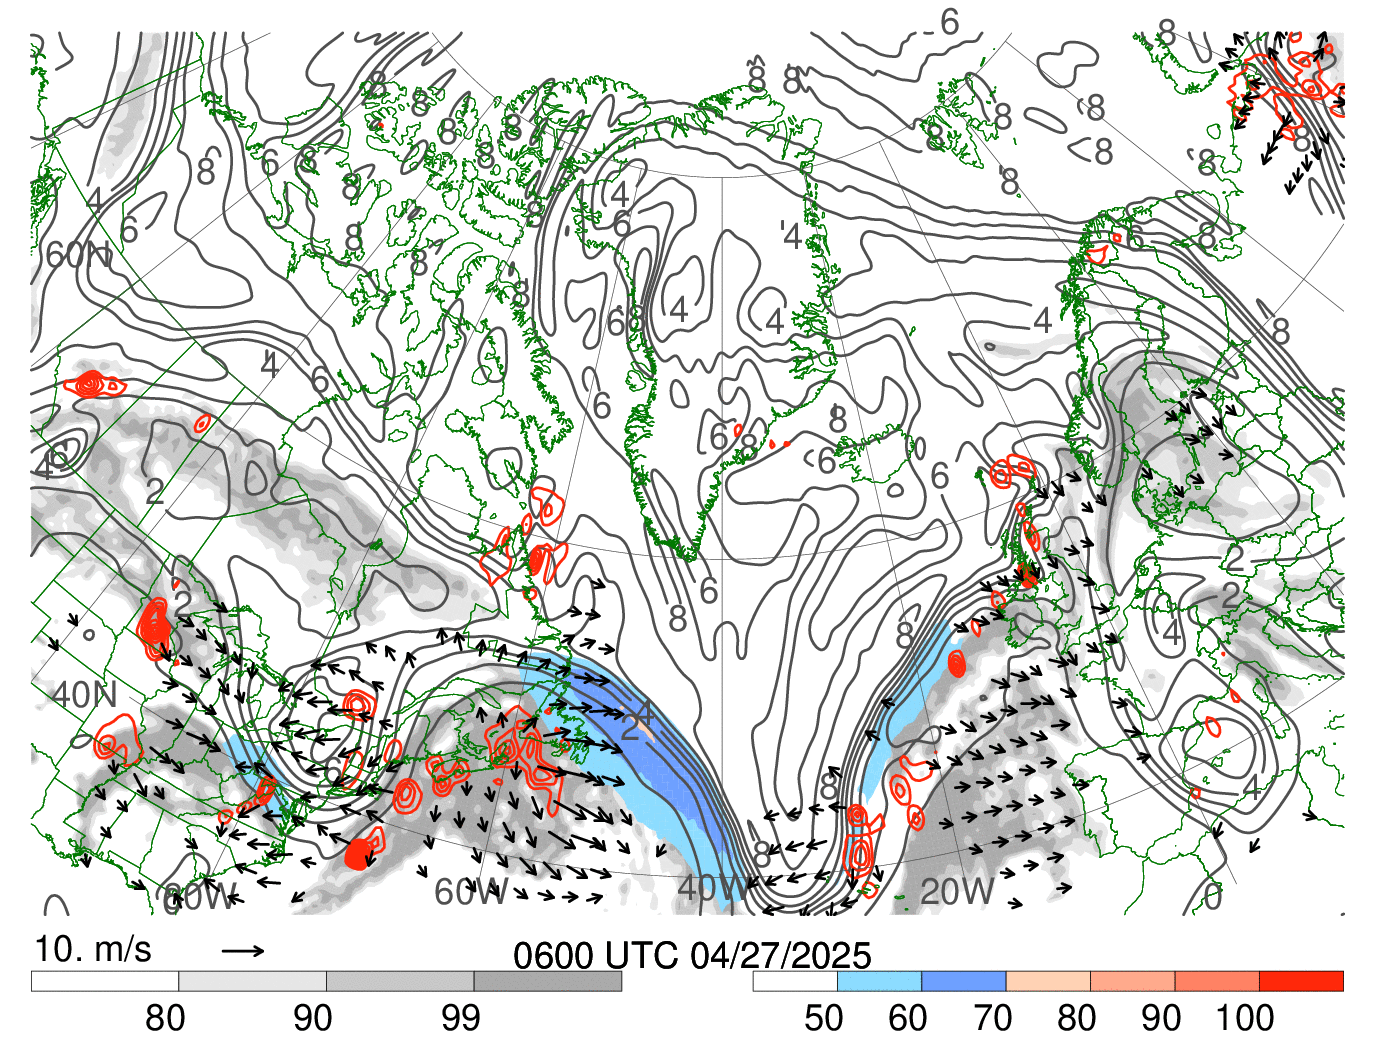
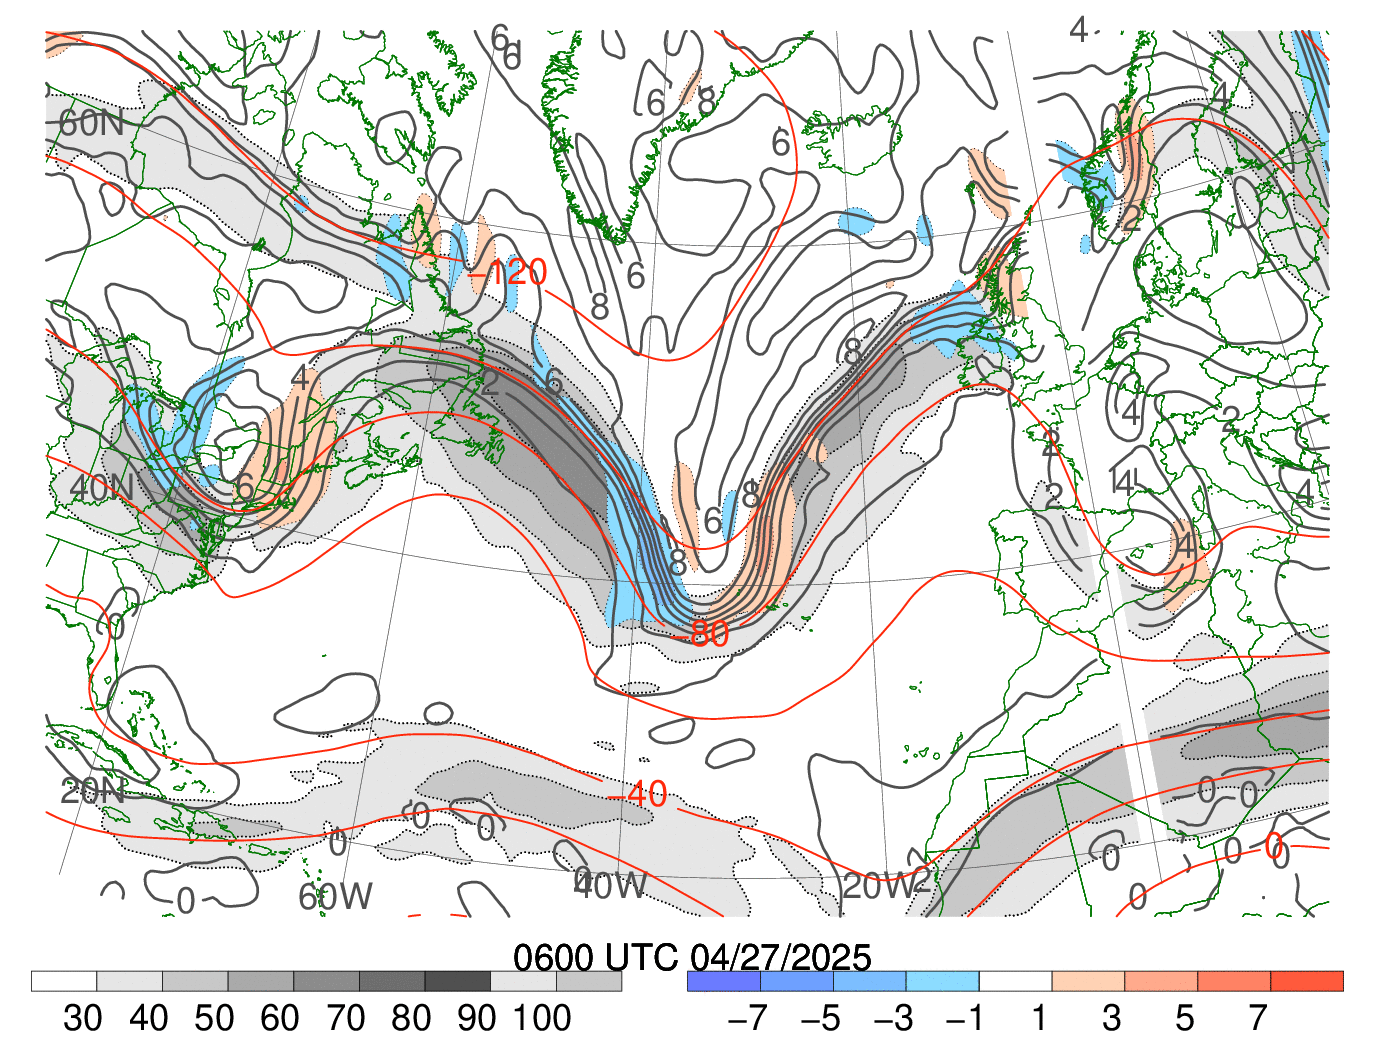
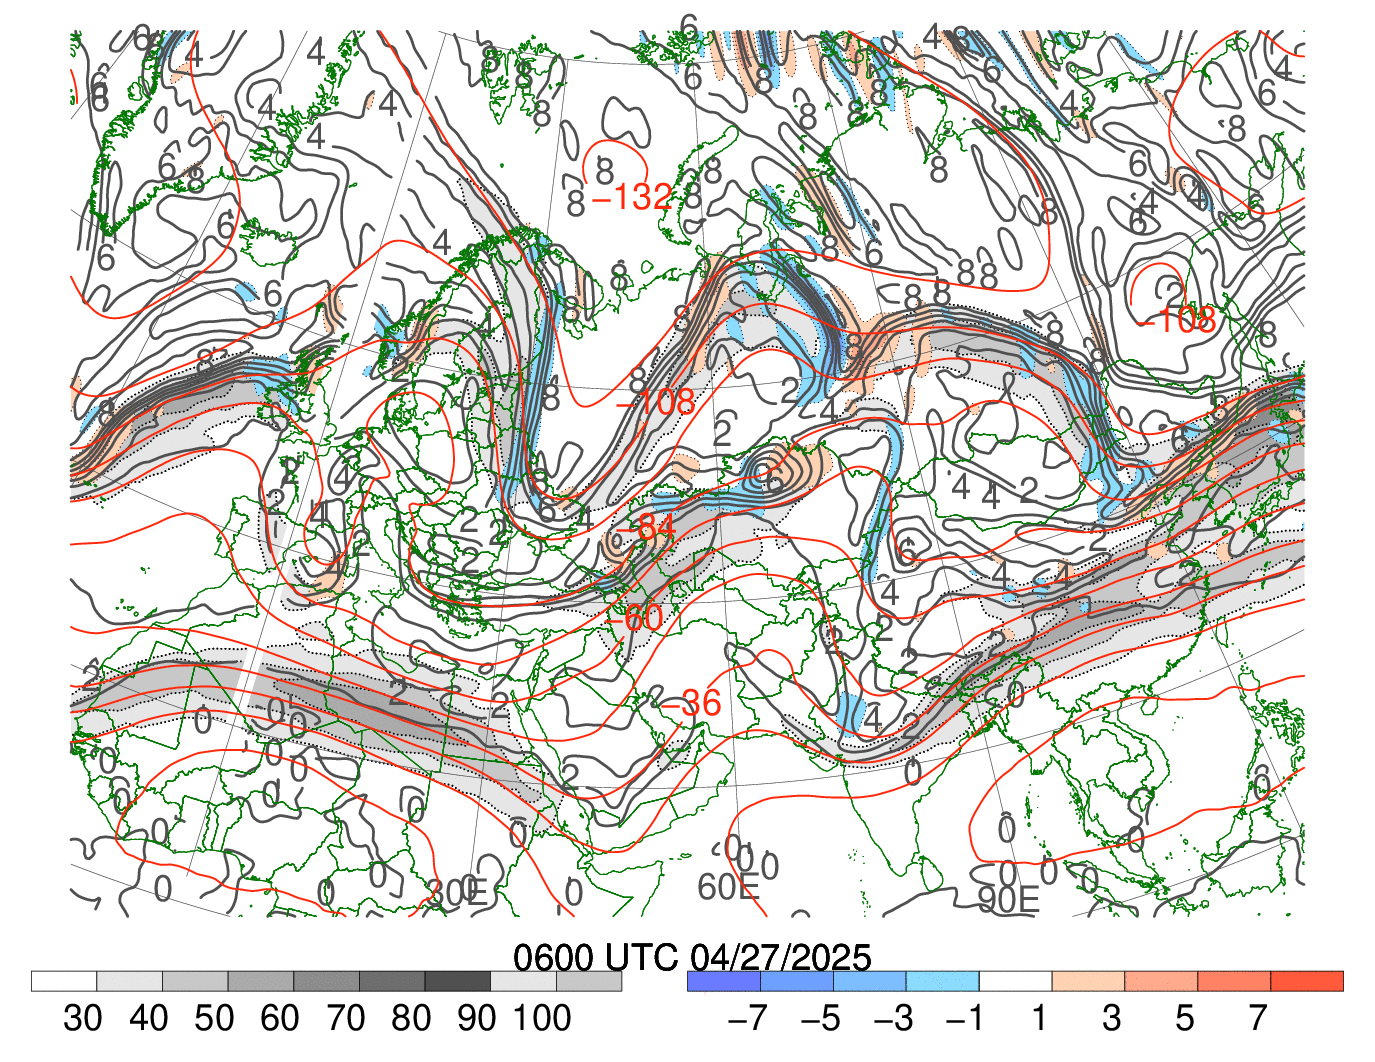
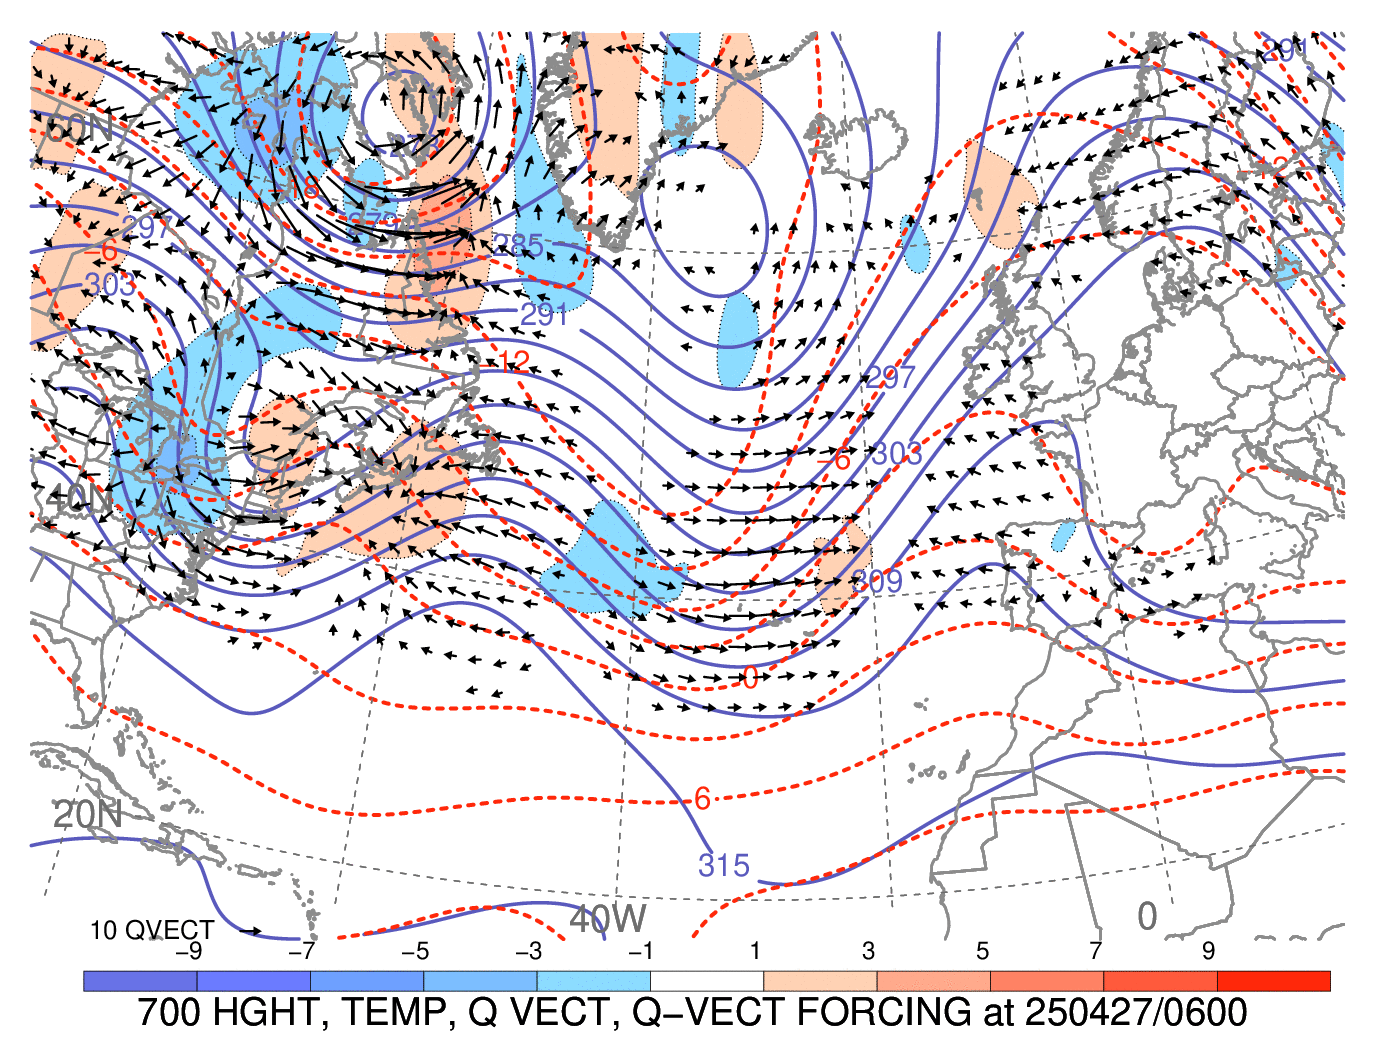
North Atlantic
Click image for latest 72-h loop
|
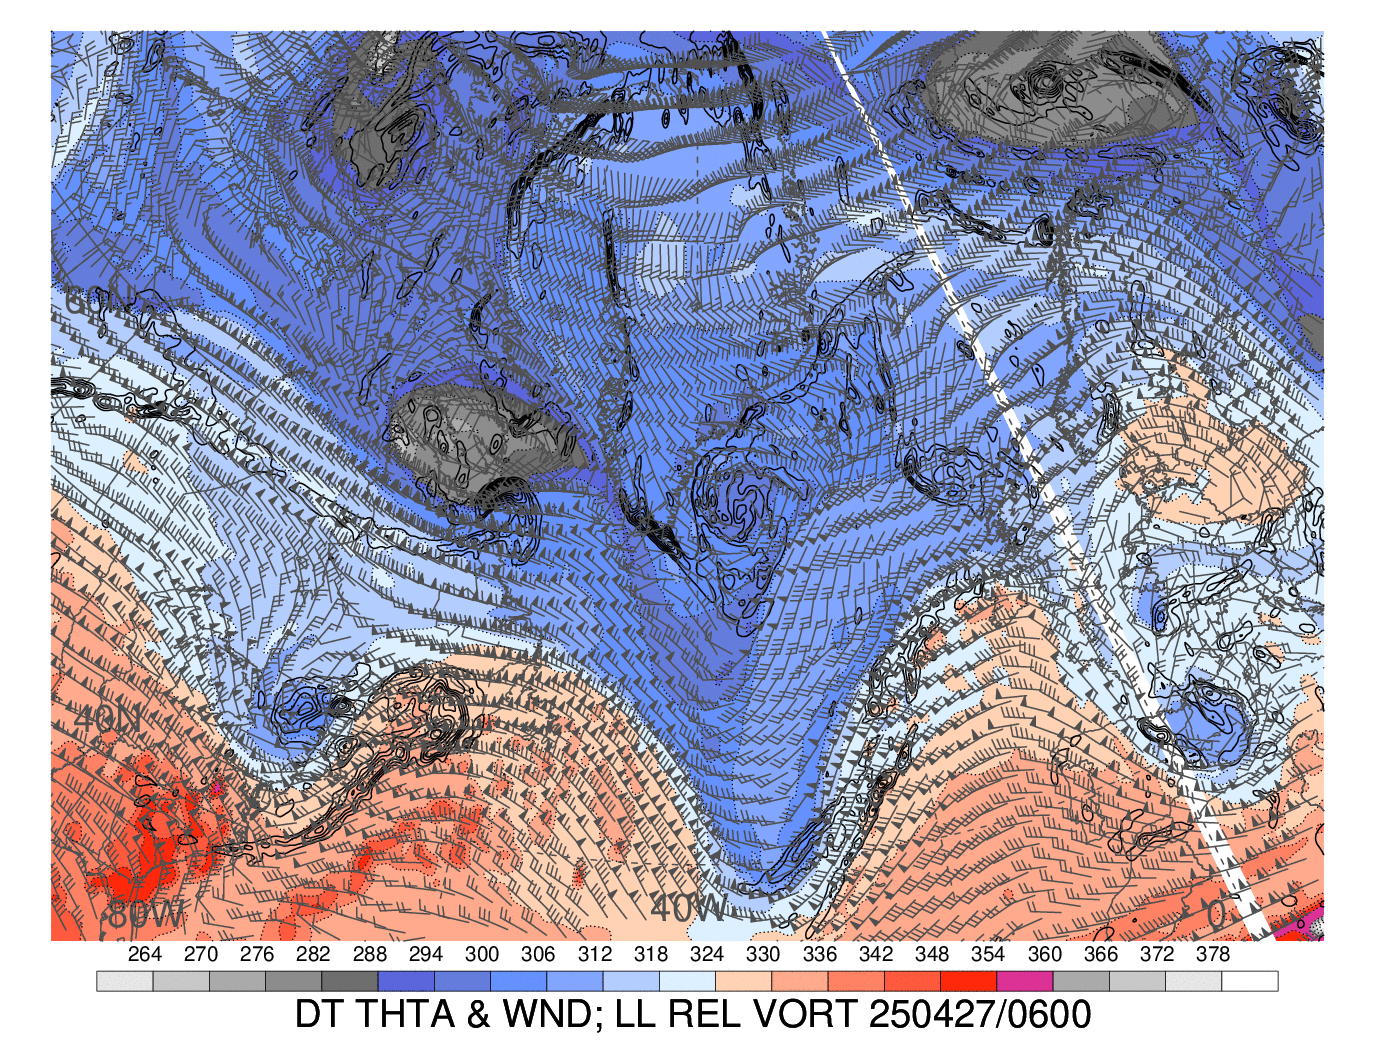
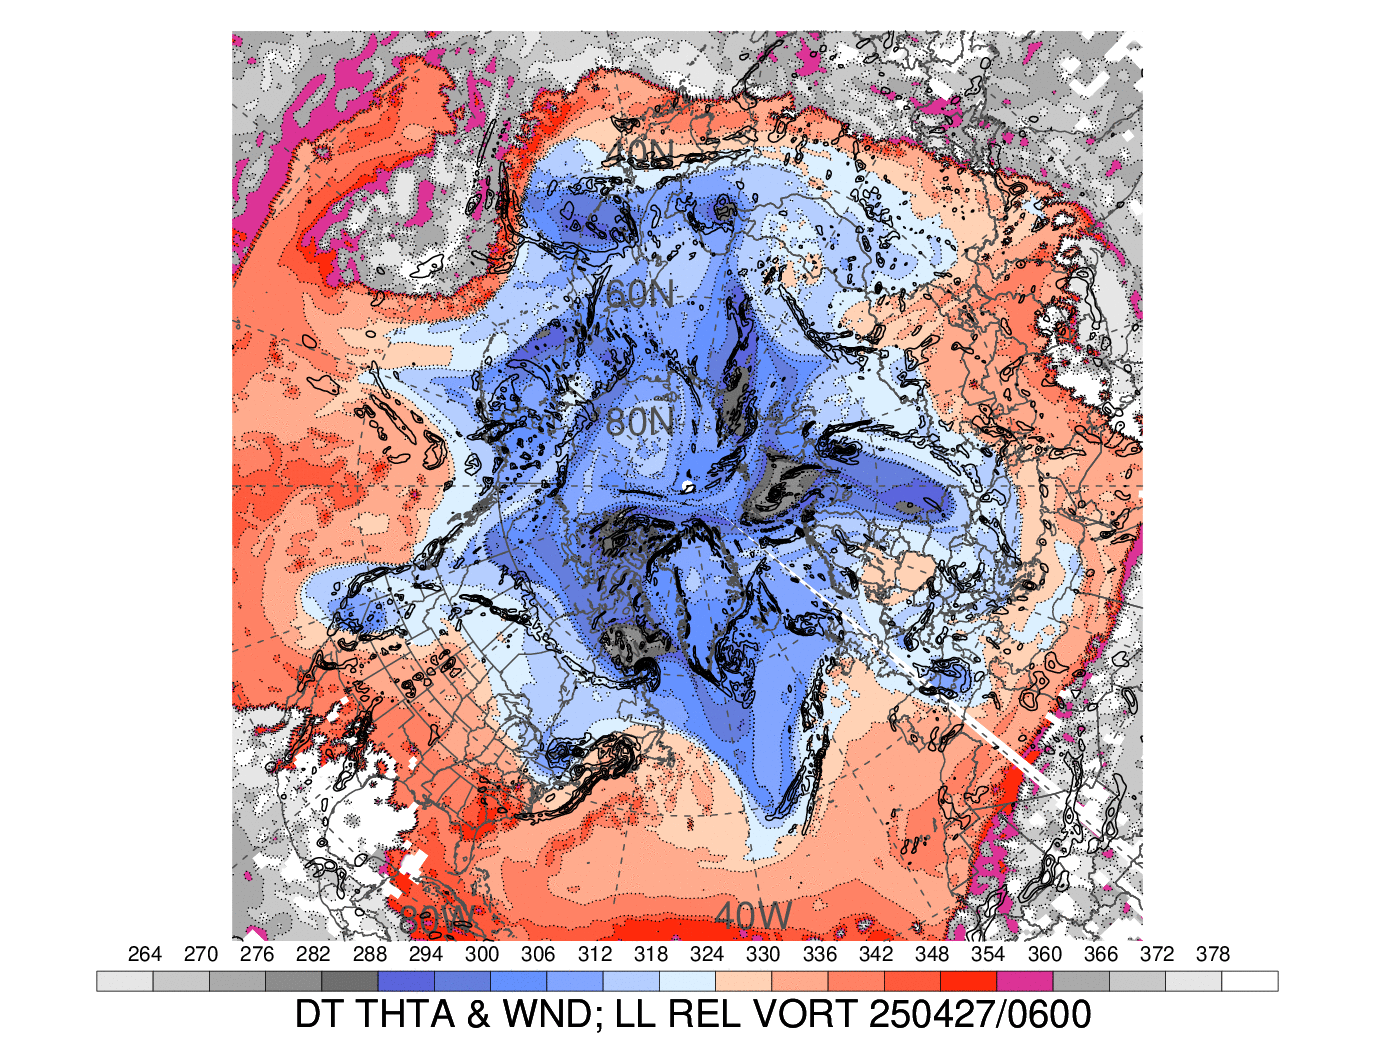
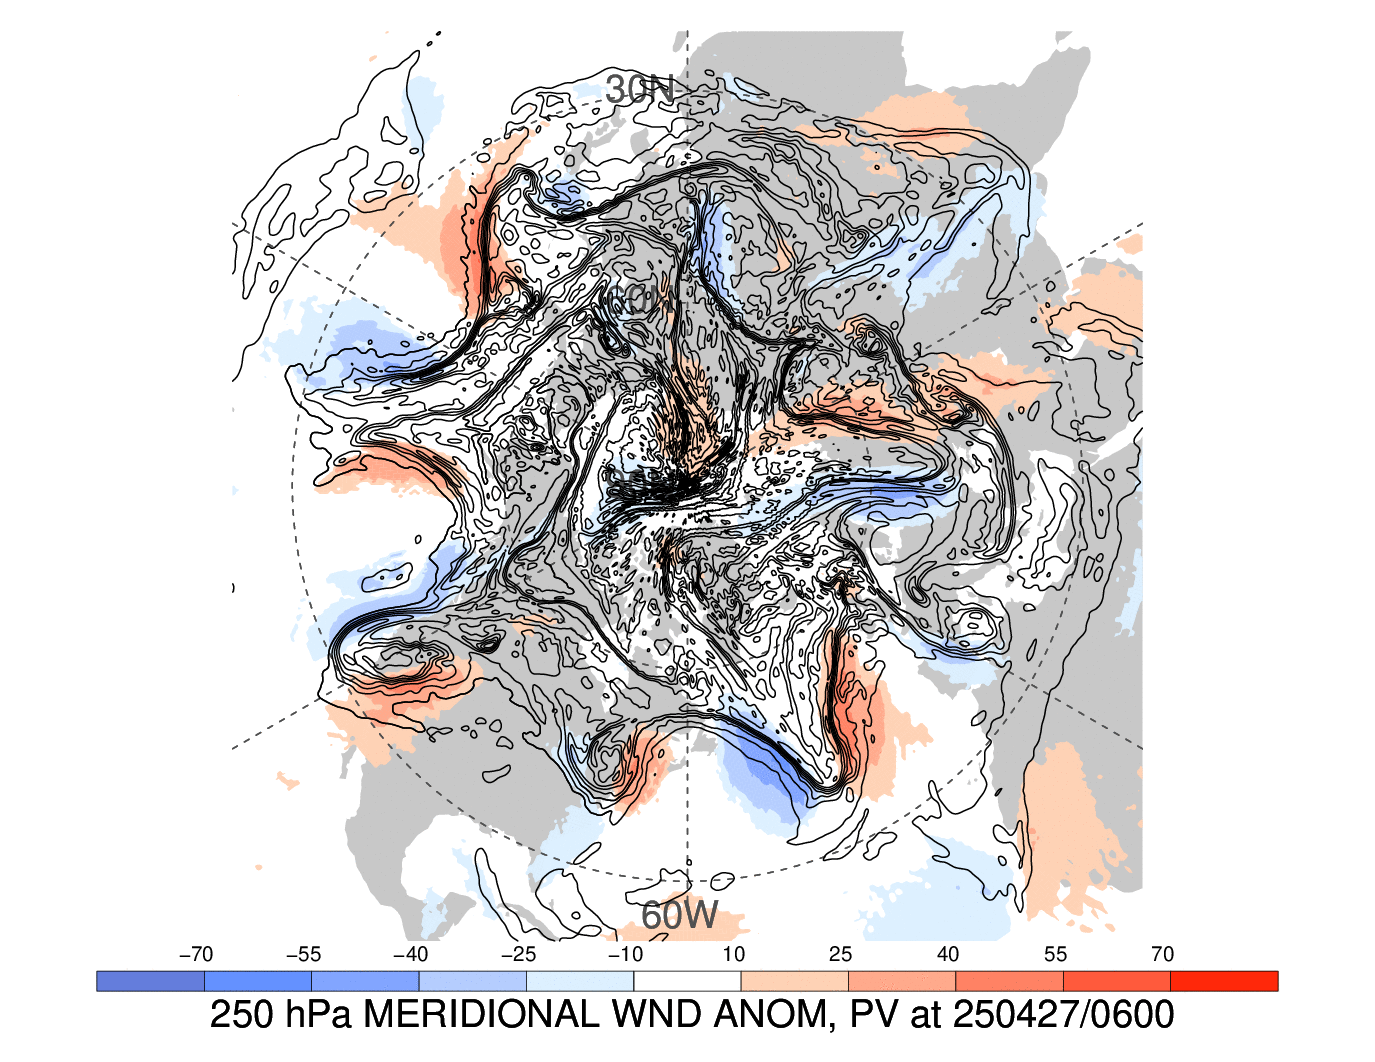
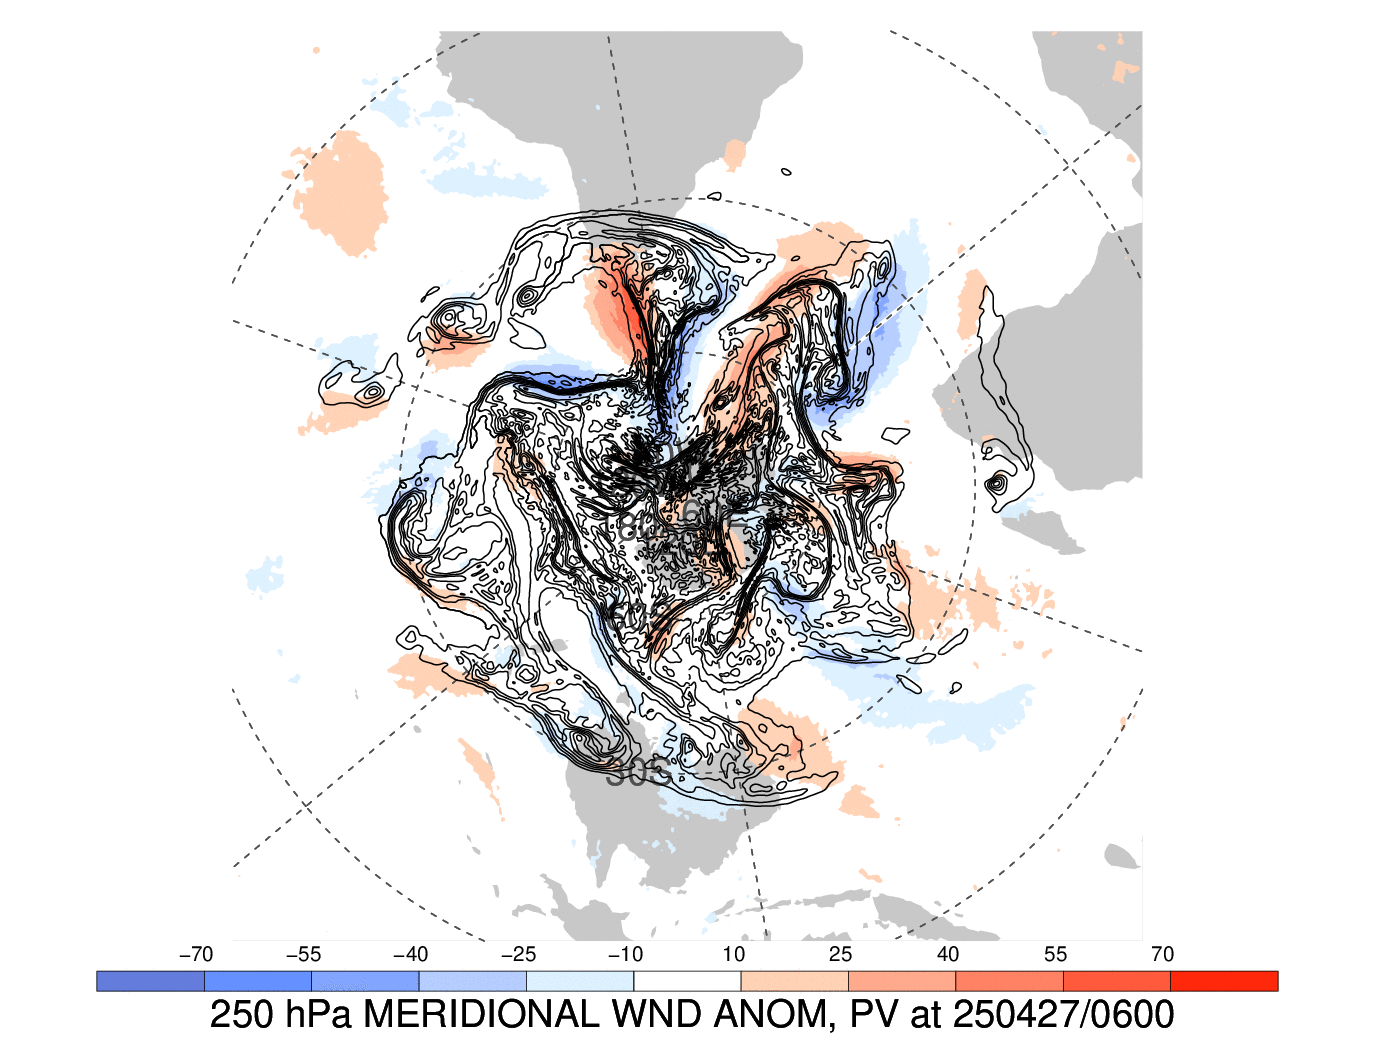
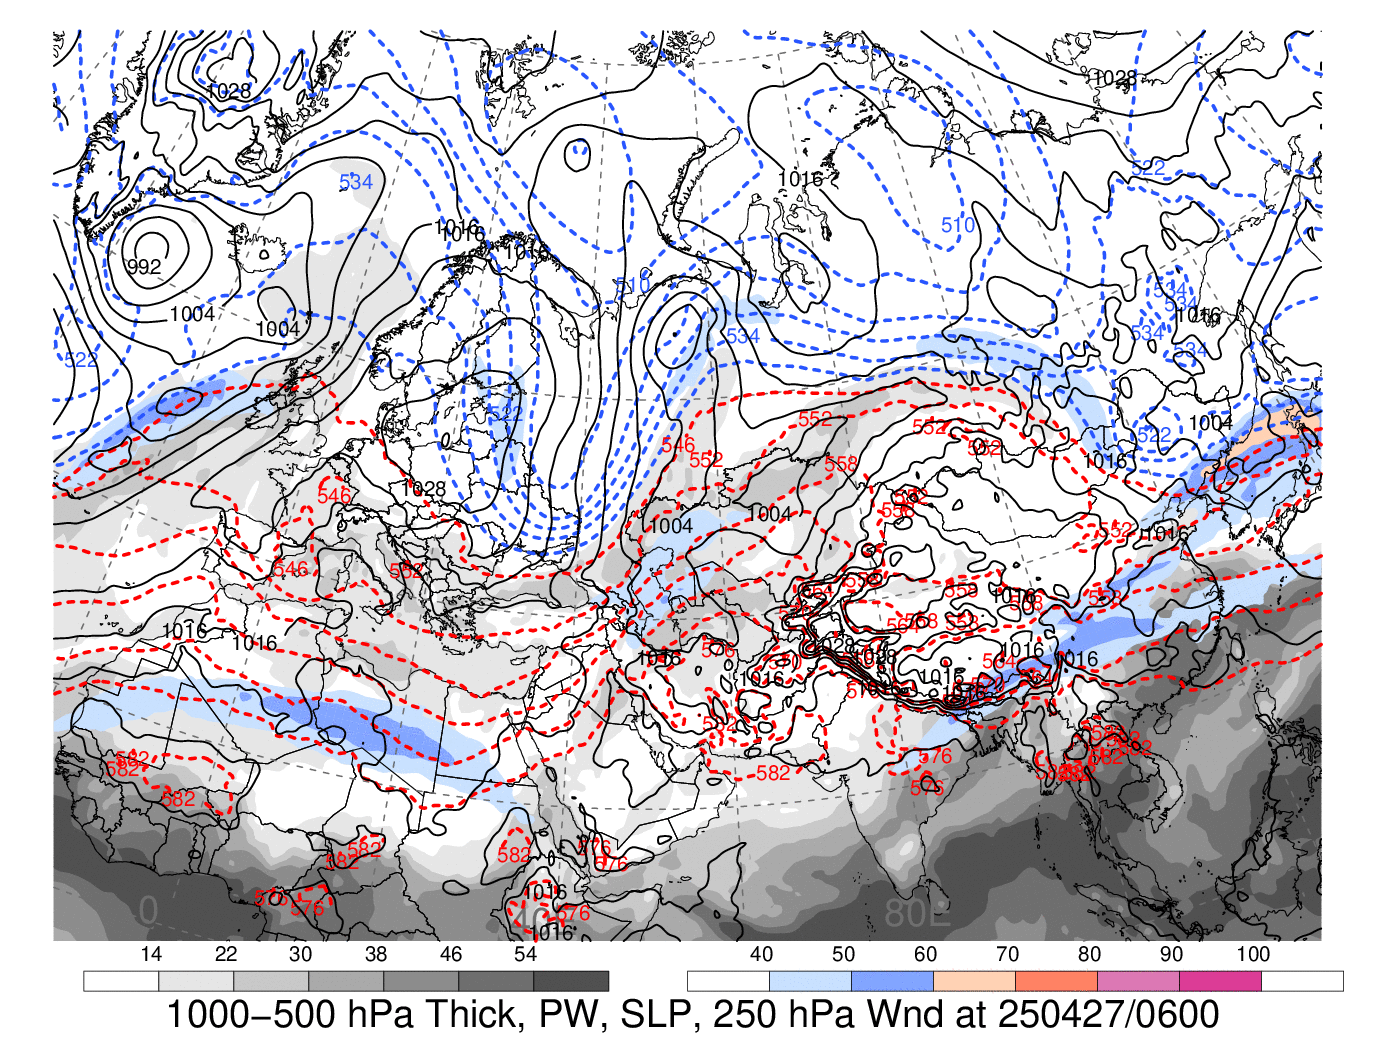
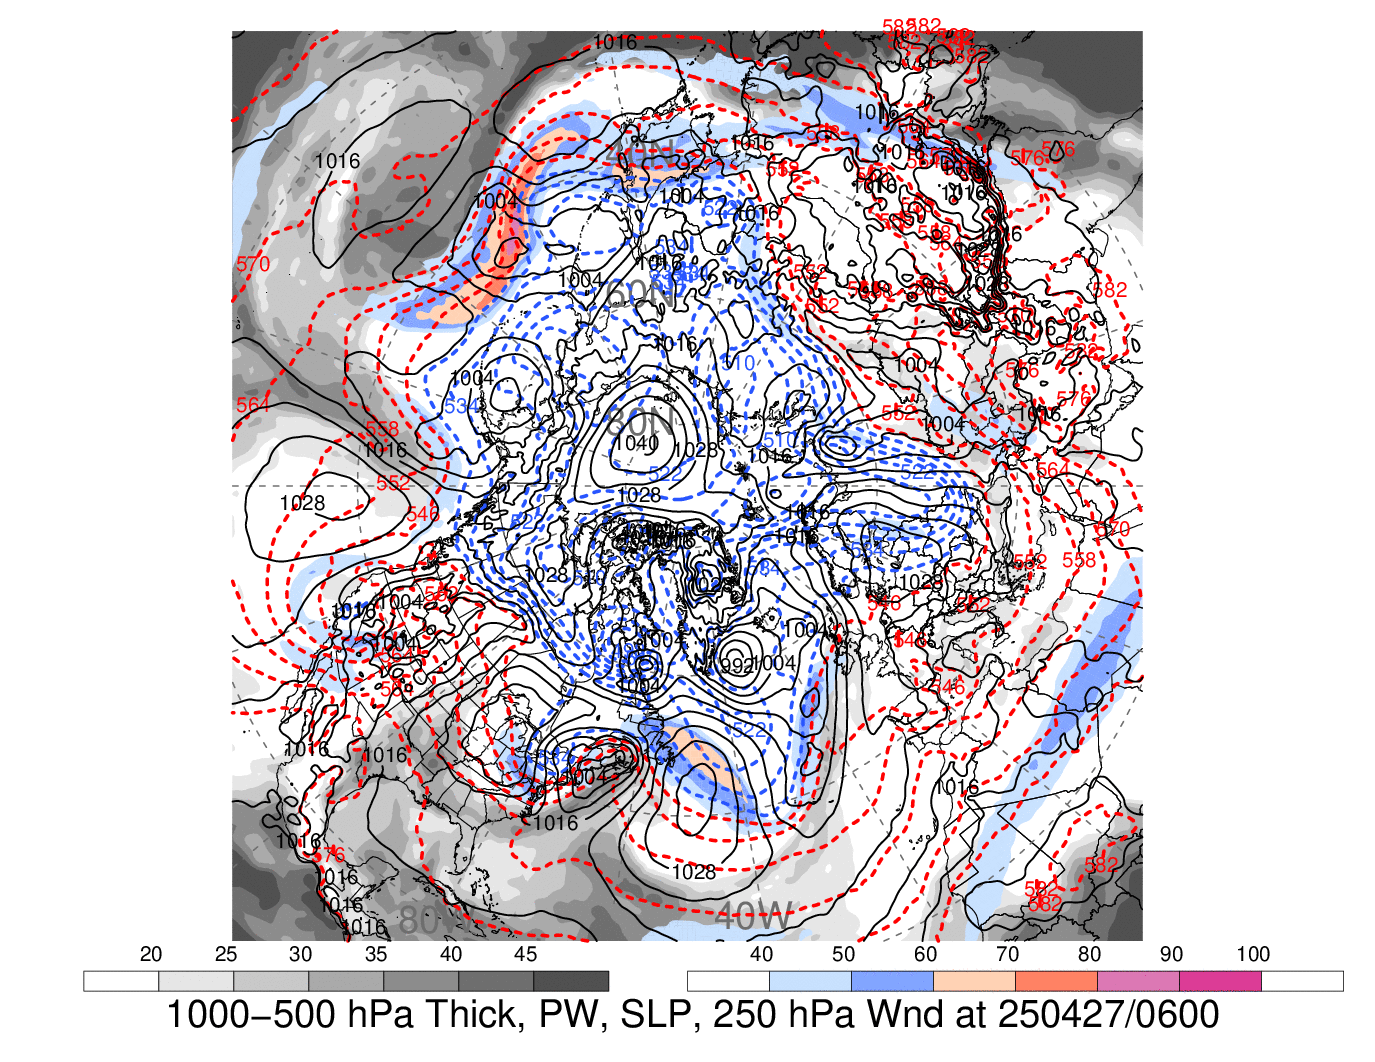
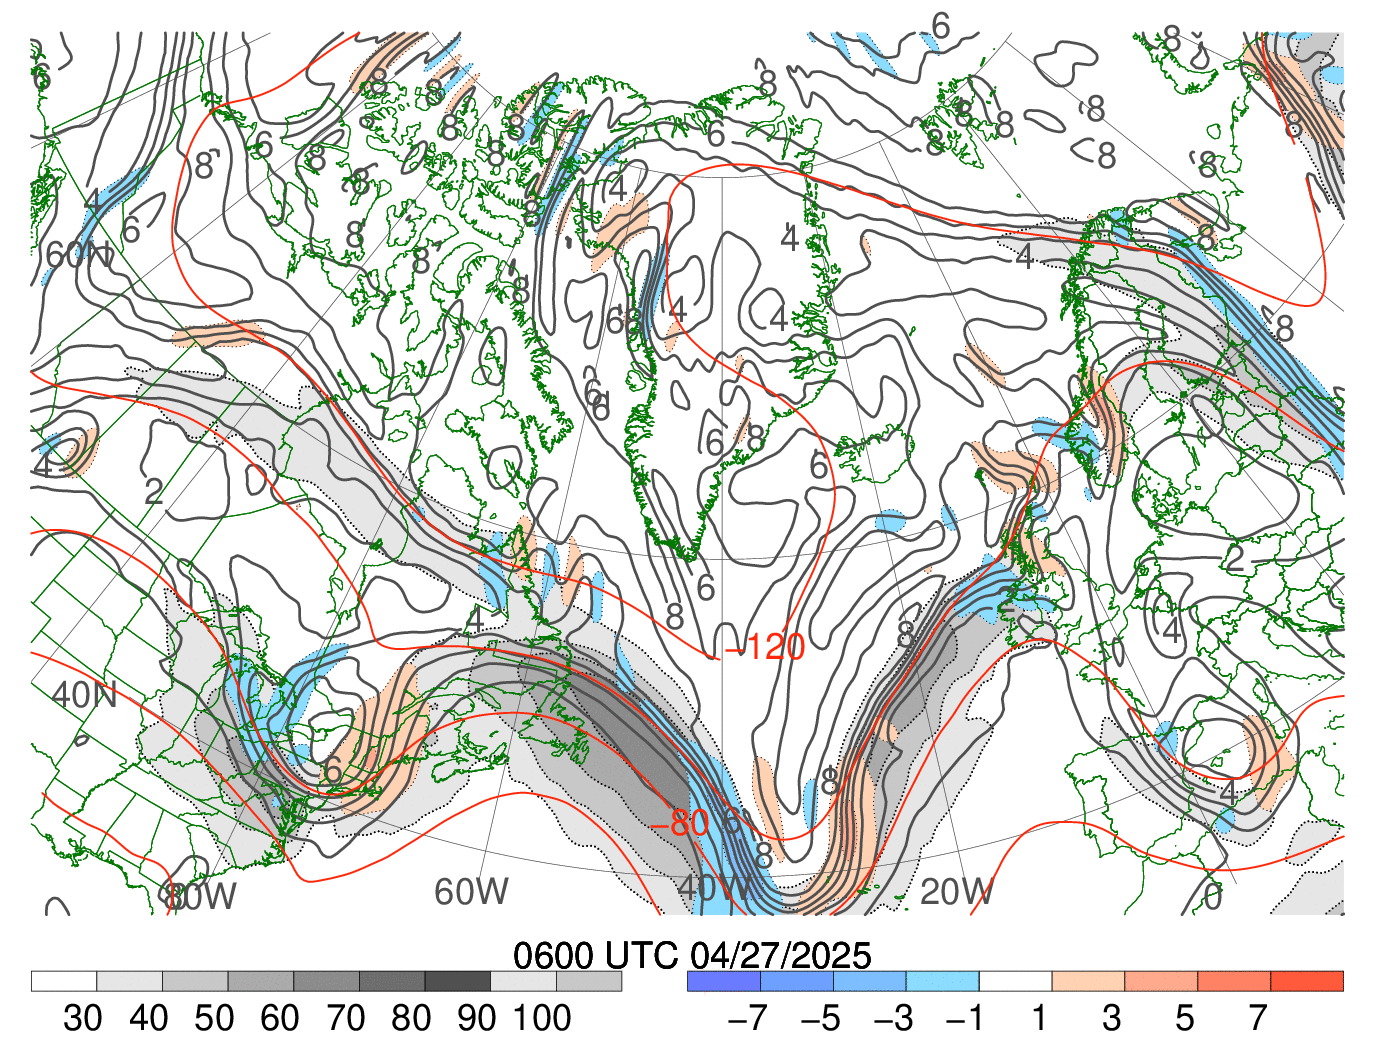
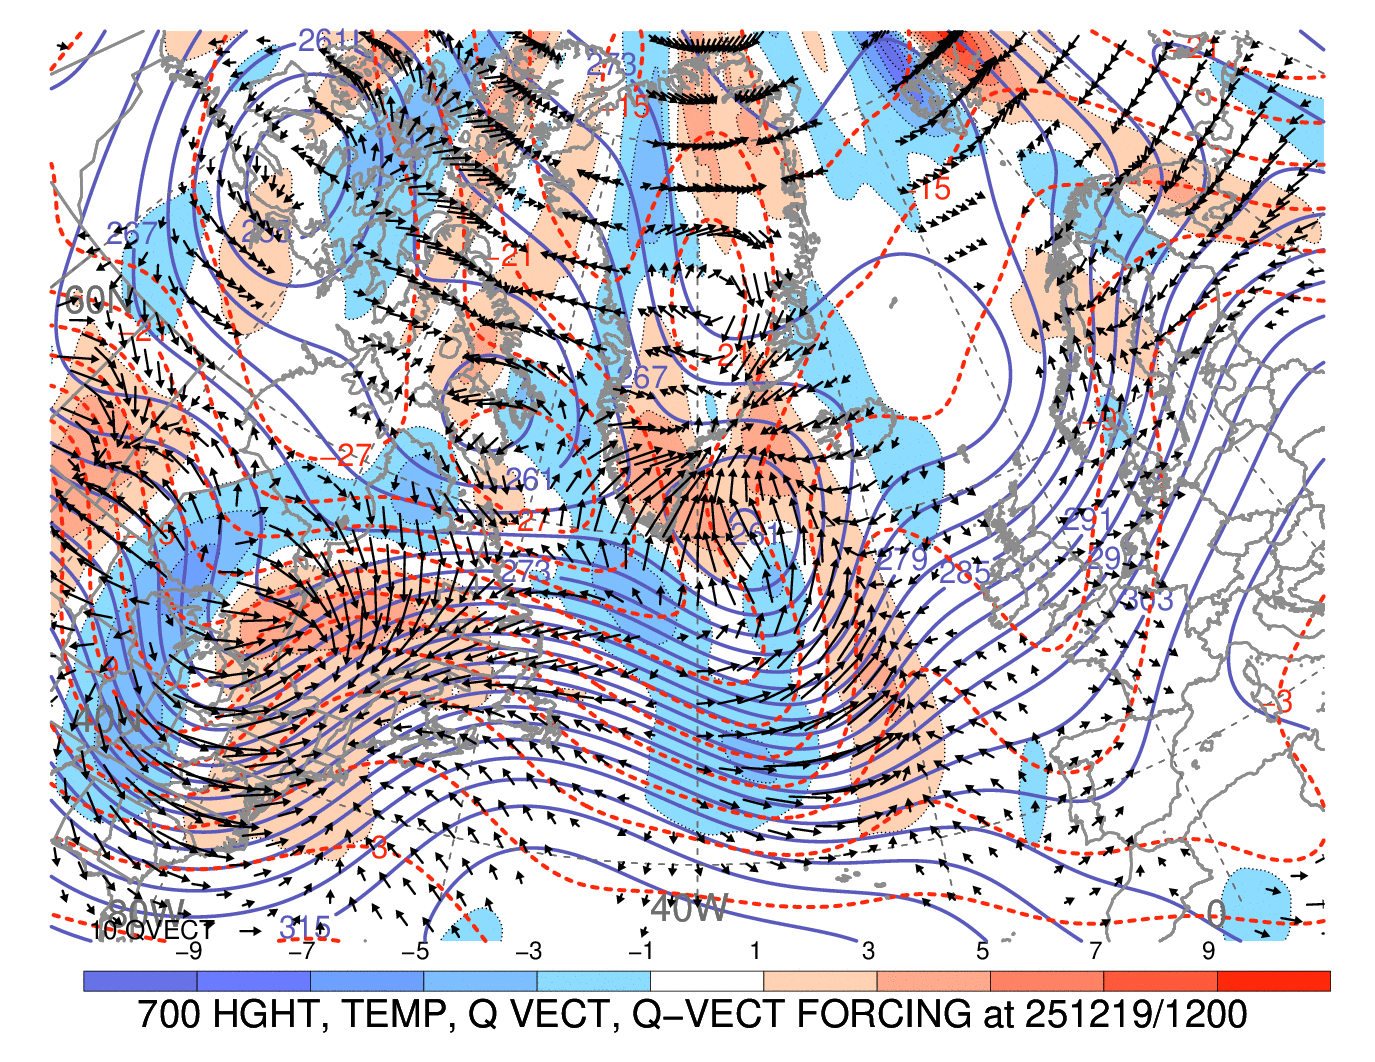
High-Lat North
Atlantic
Click image for latest 72-h loop
|
|
|
|
|
|
|
|
|