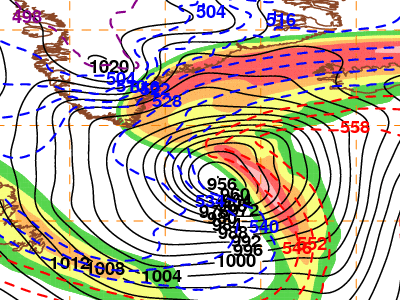
Mean sea level pressure in solid black contours, every 4 hPa.
1000-500 hPa thickness in color dashed lines every 6 dam; red when 546 dam and above, blue between 504 and 540 dam, and purple when 498 dam and below.
250 hPa isotachs (wind speed) in color shading every 10 m/s beginning at 40 m/s.
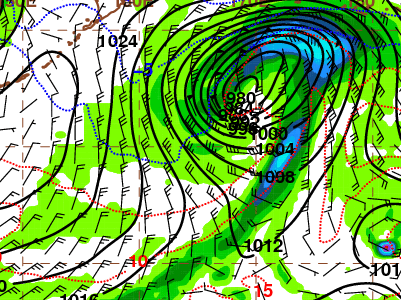
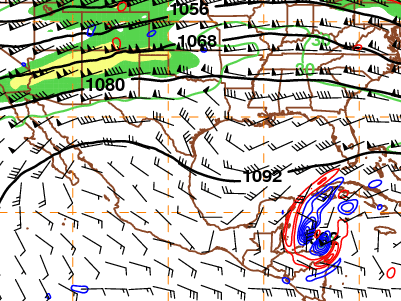
Mean sea level pressure in solid black contours, every 4 hPa.
850 hPa temperatures in color dotted lines every 5 degrees Celsius; red when >0 C, blue when between 0 C and -15 C, and purple when -20 C and below.
10 m wind barbs in kt; standard notation.
6 hour precipitation total ending at valid model time in color shading; units of inches with values as per color bar.
Note: color bar is similar to NCEP, but has been edited for clarity at some higher precipitation levels.
850 hPa mixing ratio in color shading beginning at 4 g/kg.
850 hPa temperatures in color dotted lines every 3 degrees Celsius; dark red when 21 C or greater, red when between 3 C and 18 C, blue when between -18 C and 0 C, and purple when -21 C and below.
850 hPa heights in solid black contours every 3 dam.
850 hPa wind barbs in kt; standard notation.
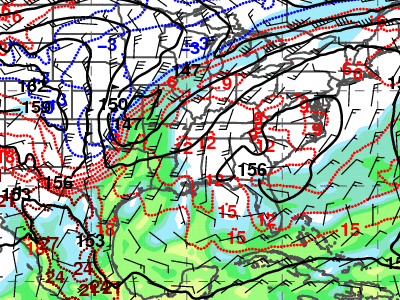
700 hPa Winds/PW
Precipitable water in color shading every 5 mm beginning at 15 mm.
700 hPa heights in solid black contours every 3 dam.
700 hPa temperatures in color dotted lines every 3 degrees Celsius; red when 12 C or greater, blue when between 3 C and 9 C, and purple when 0 C and below.
700 hPa wind barbs in kt; standard notation.
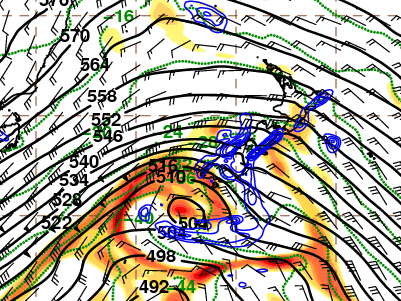
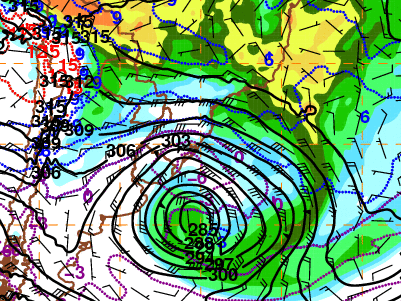
500 hPa relative vorticity in orange shading beginning at 6 x10^-5 s^-1 (negative values in Southern Hemisphere).
500 hPa upward vertical velocity (omega) in blue solid lines every 5 x 10^-3 hPa/s, negative values only.
500 hPa temperature in green dotted lines every 4 degrees Celsius.
500 hPa wind barbs in kt; standard notation.
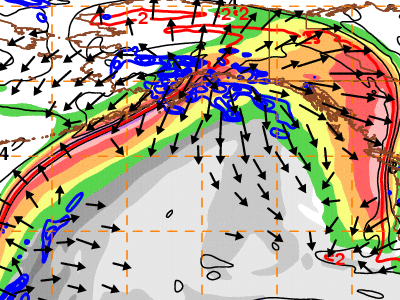
250 hPa isotachs (wind speed) in color shading every 10 m/s beginning at 40 m/s, with the 30 m/s contour outlined in green.
250 hPa heights in solid black contours every 12 dam.
250 hPa divergence and convergence are contoured in blue and red solid lines, respectively, every 5x10^-5 s^-1.
250 hPa wind barbs in kt; standard notation.
250 hPa potential vorticity in black solid lines every 2 PVU starting at 2 PVU in addition to the 1 PVU contour; 2 PVU contour highlighted in red; similar for all negative values of potential vorticity.
250 hPa isotachs (wind speed) in color shading every 10 m/s beginning at 40 m/s.
250 hPa irrotational wind arrows greater than 5 m/s; reference vector on map.
500 hPa upward vertical velocity (omega) in blue solid lines every 4 x 10^-3 hPa/s, negative values only.
Precipitable water in gray shading every 10 mm starting at 15 mm.
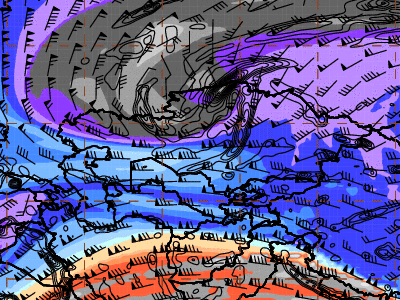
Potential temperature (color shading) and winds (standard notation) on the dynamic tropopause, defined as the 2.0 PVU surface (-2.0 PVU surface in the Southern Hemisphere).
925-850 hPa layer average relative vorticity in black solid contours every 2.5x10^-5 s^-1 starting at 2.5x10^-5 s^-1 (negative values in the Southern Hemisphere).