GFS Maps
Click on any image to view a forecast loop
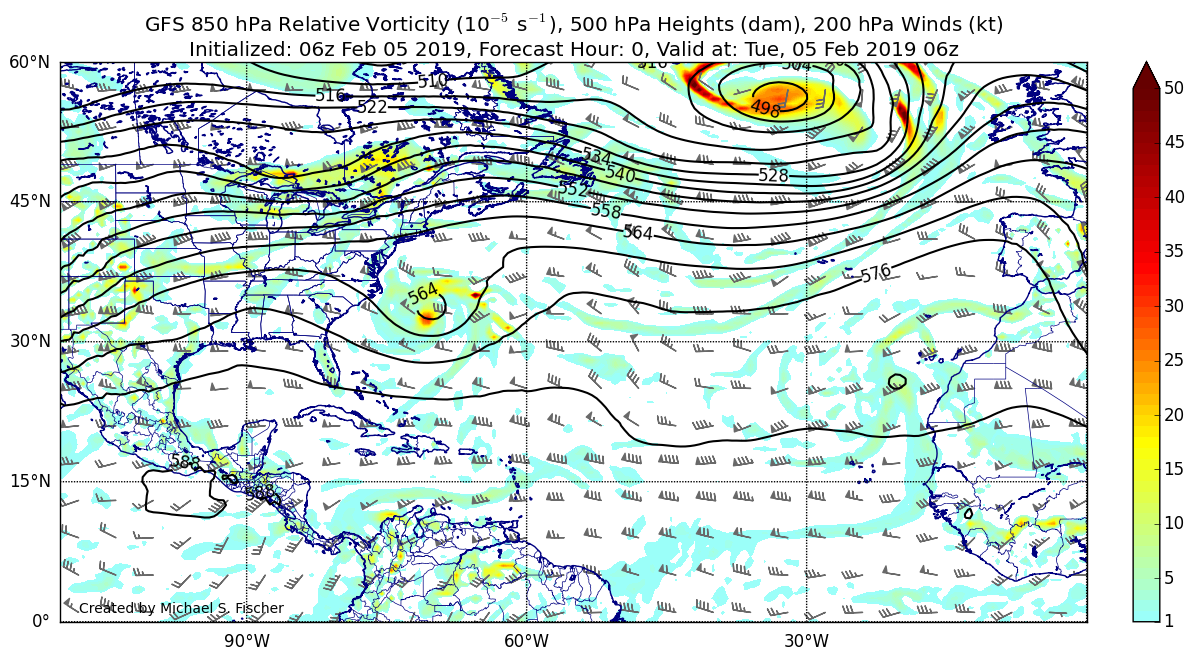
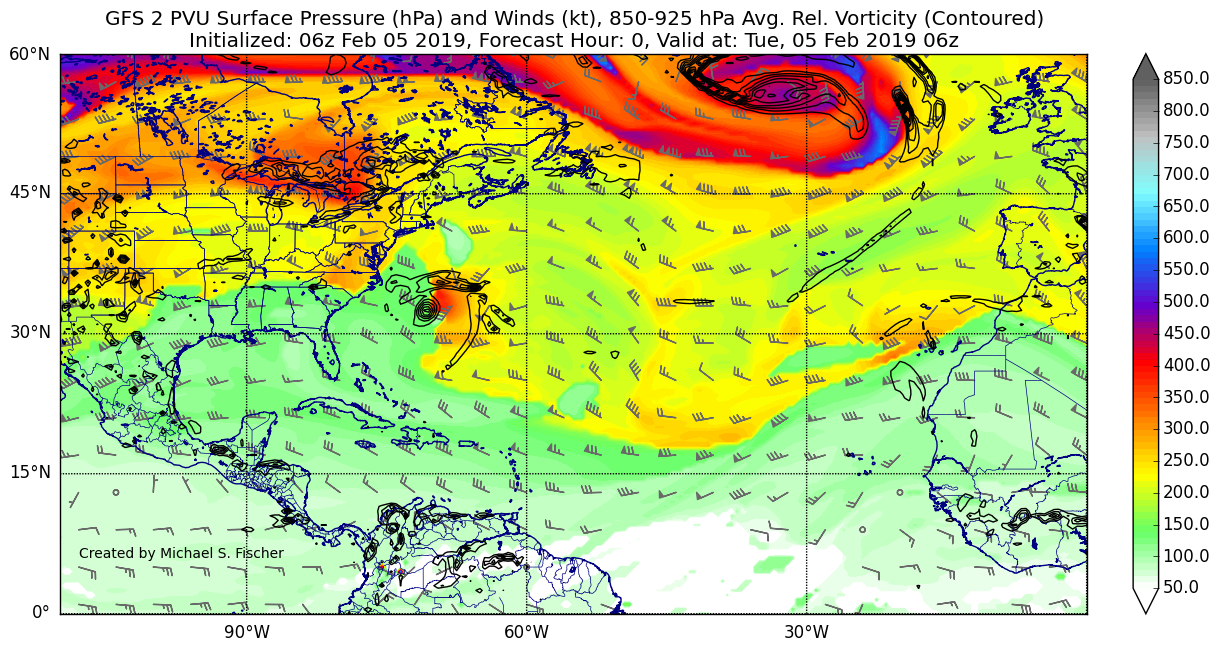
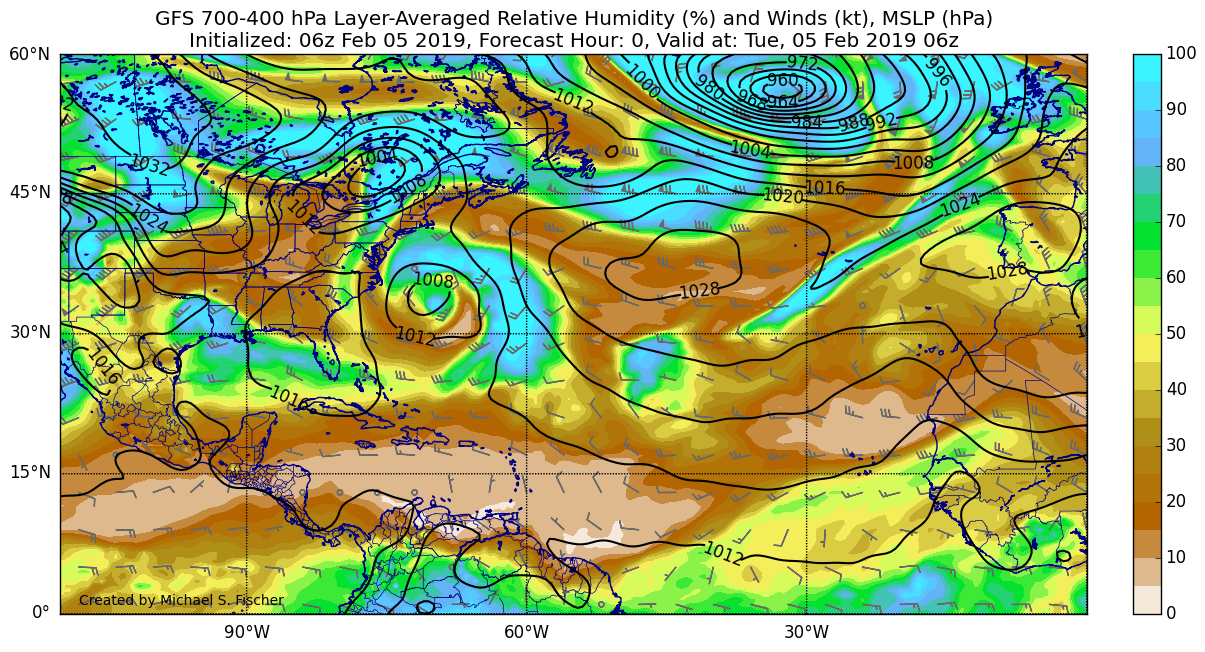
ATL Plots:
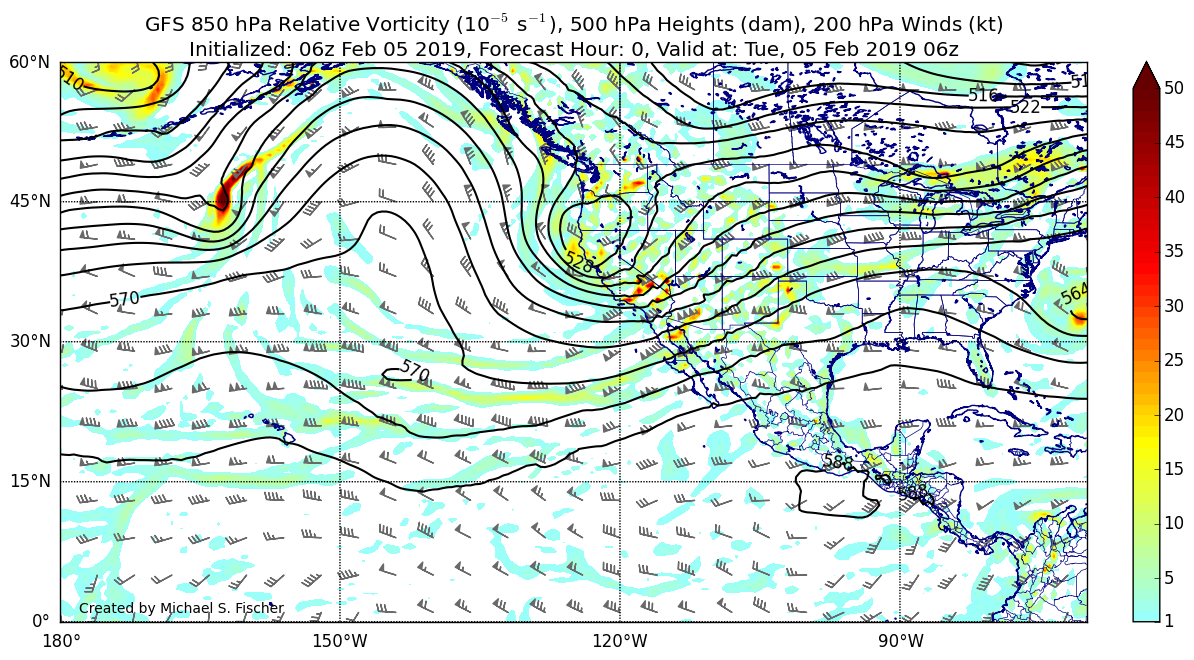
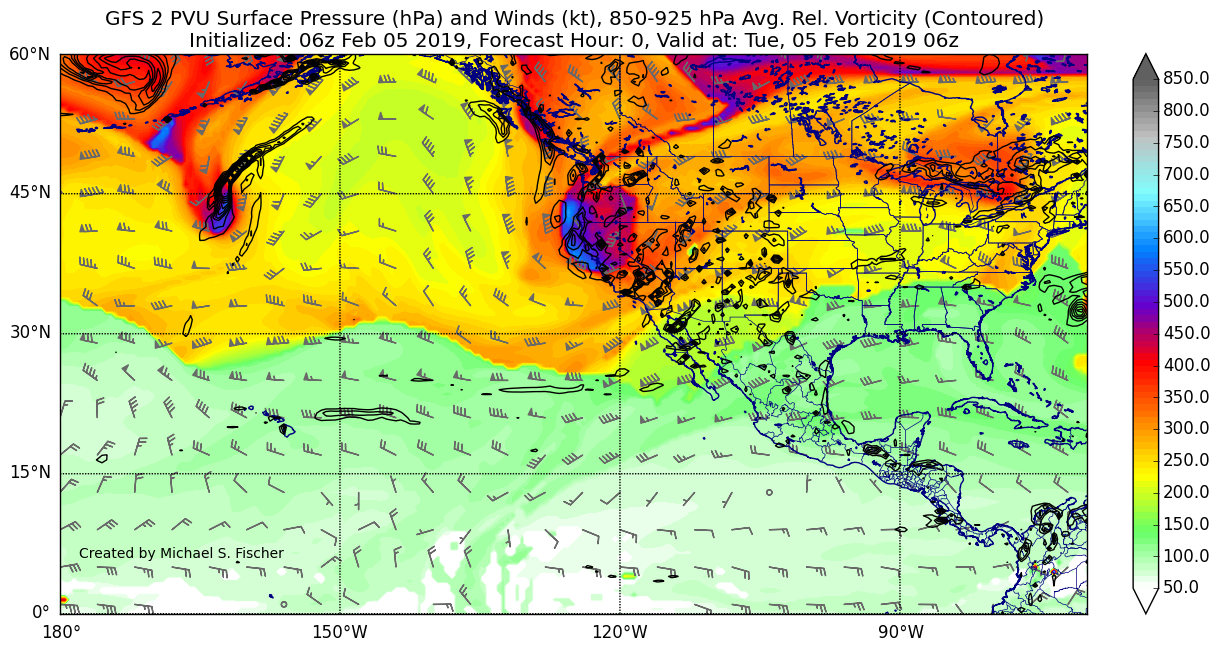
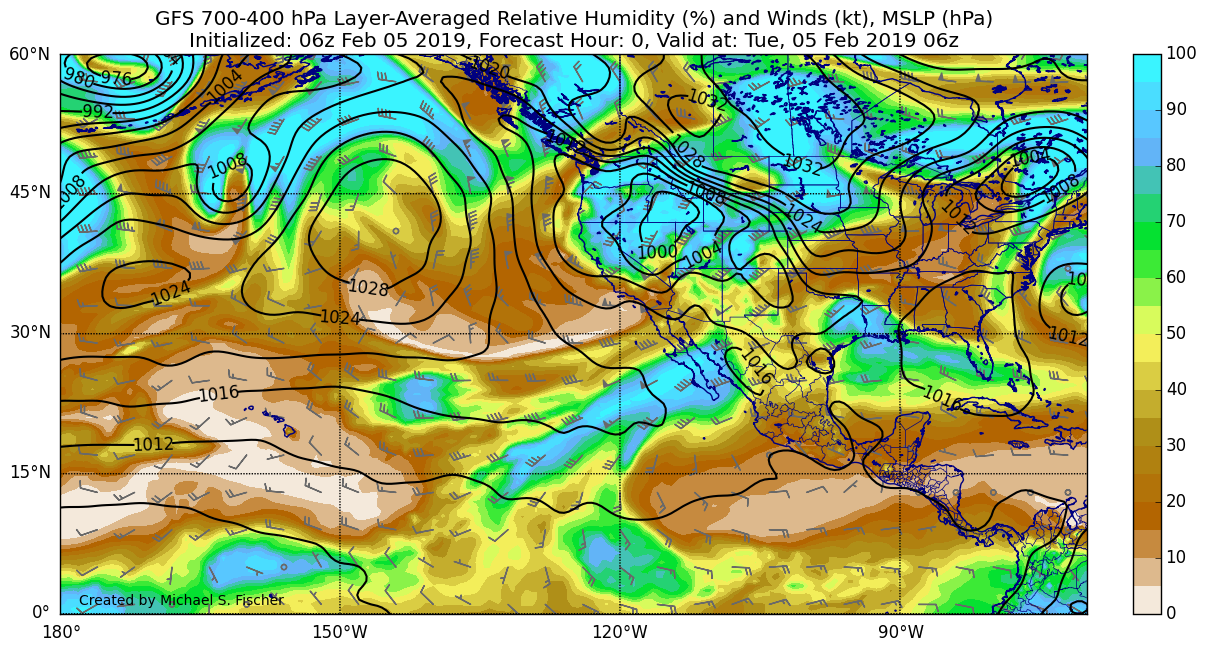
EPAC Plots:
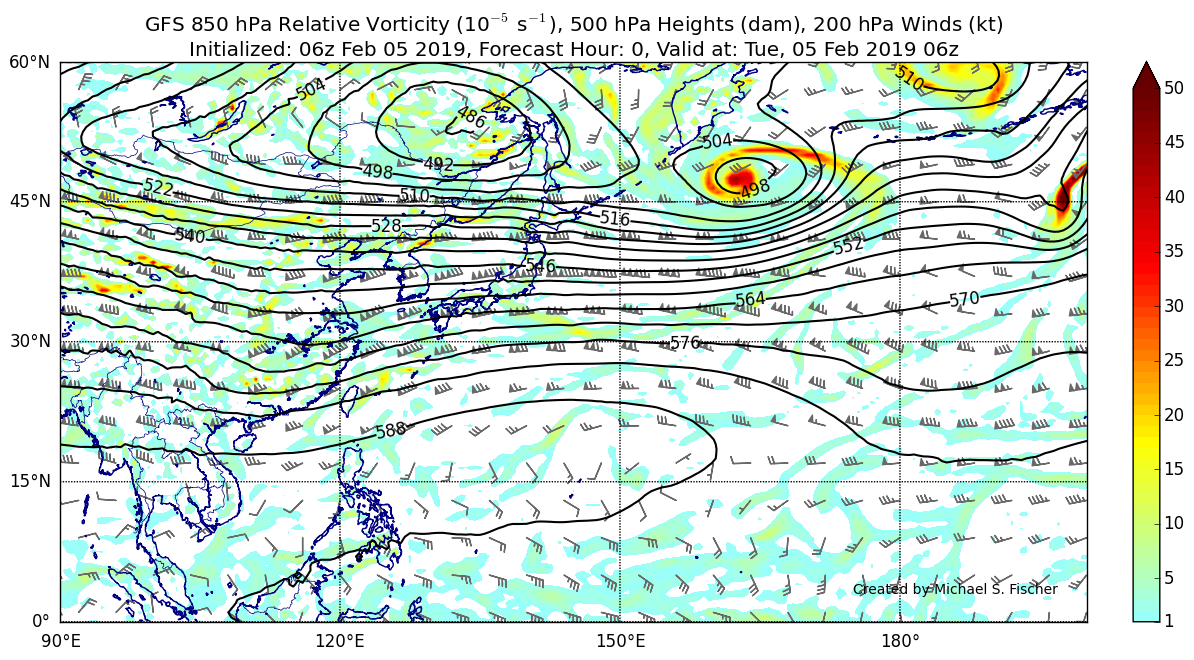
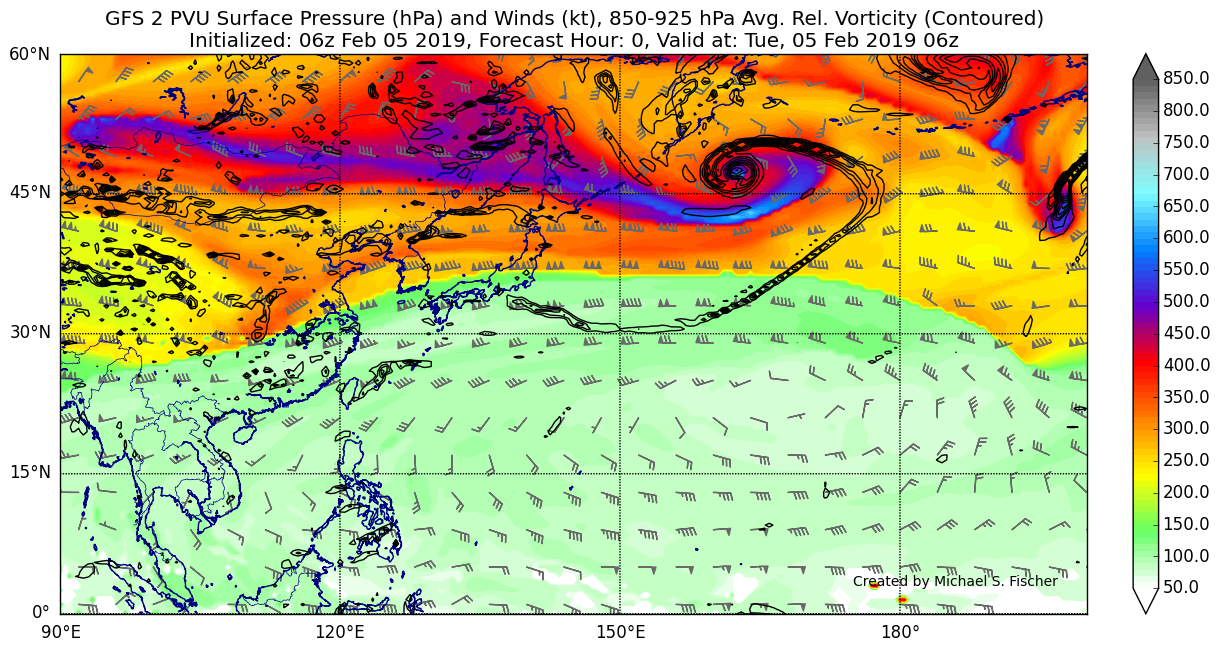
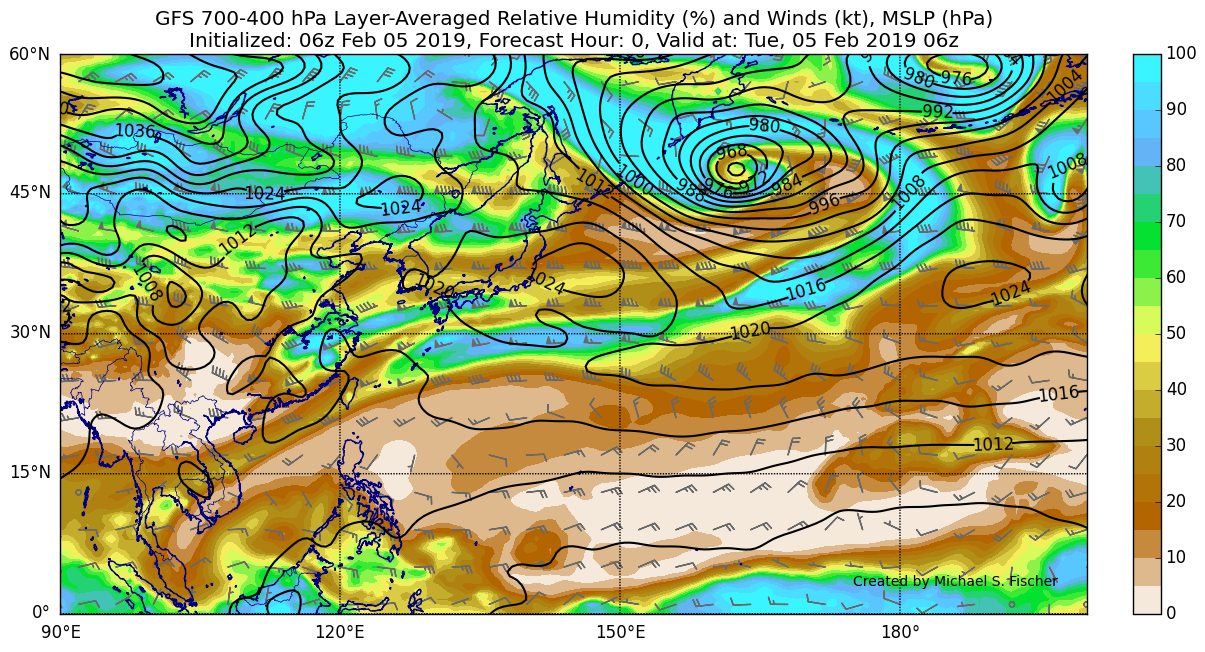
WPAC Plots:
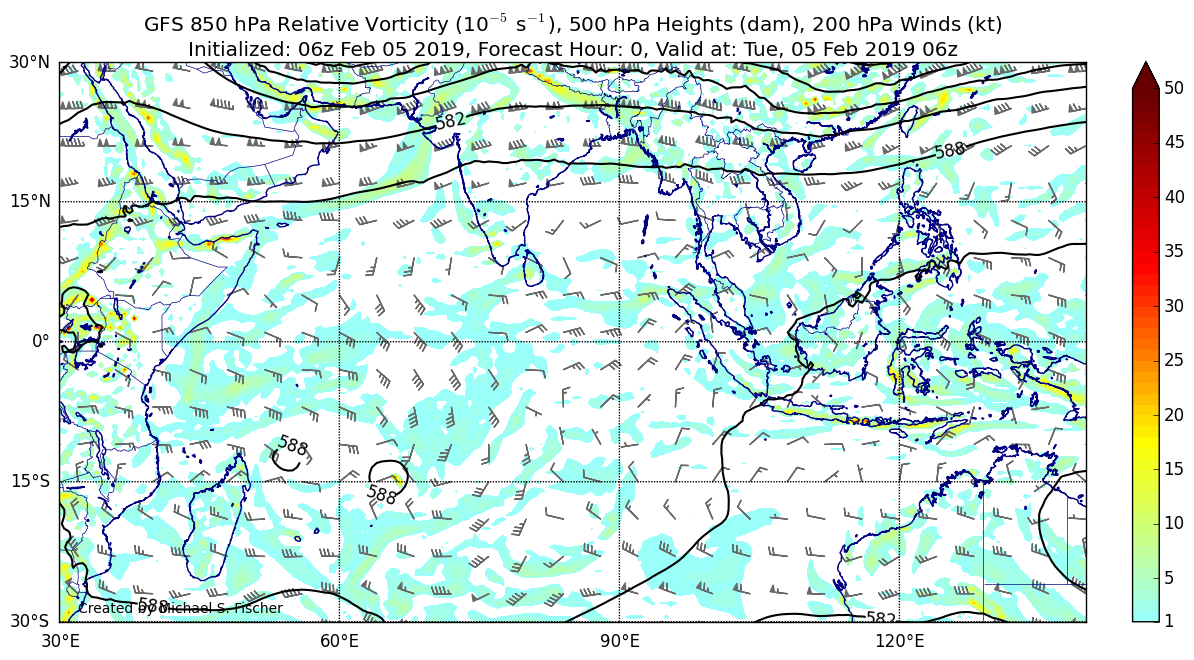
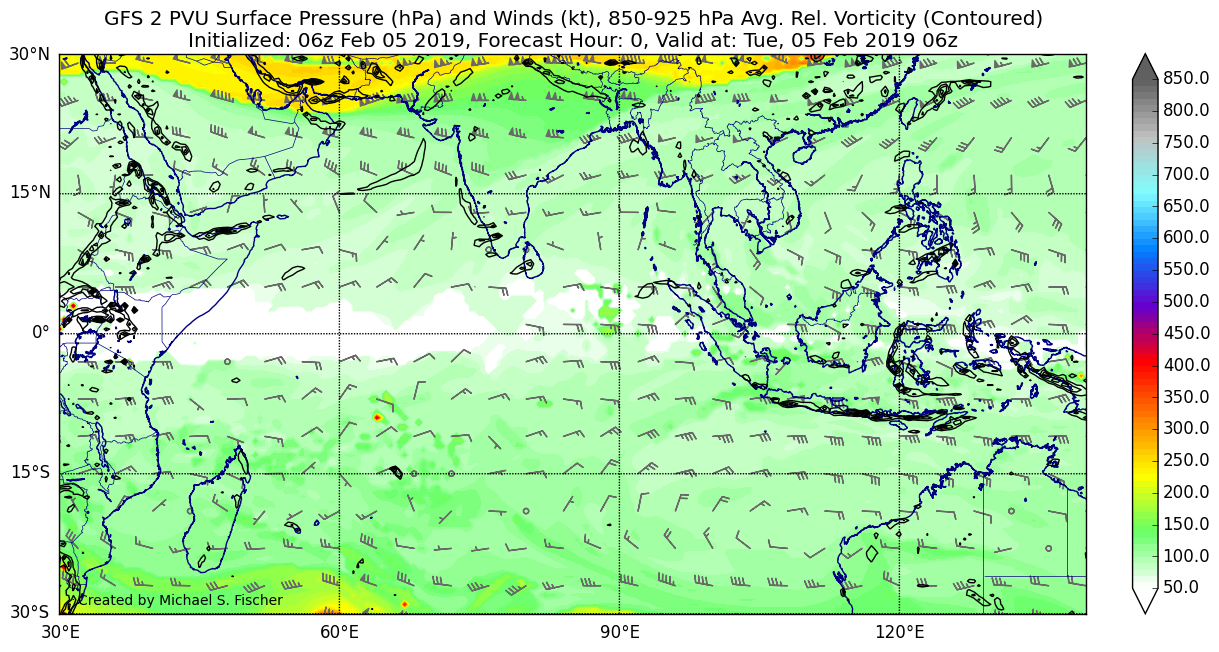
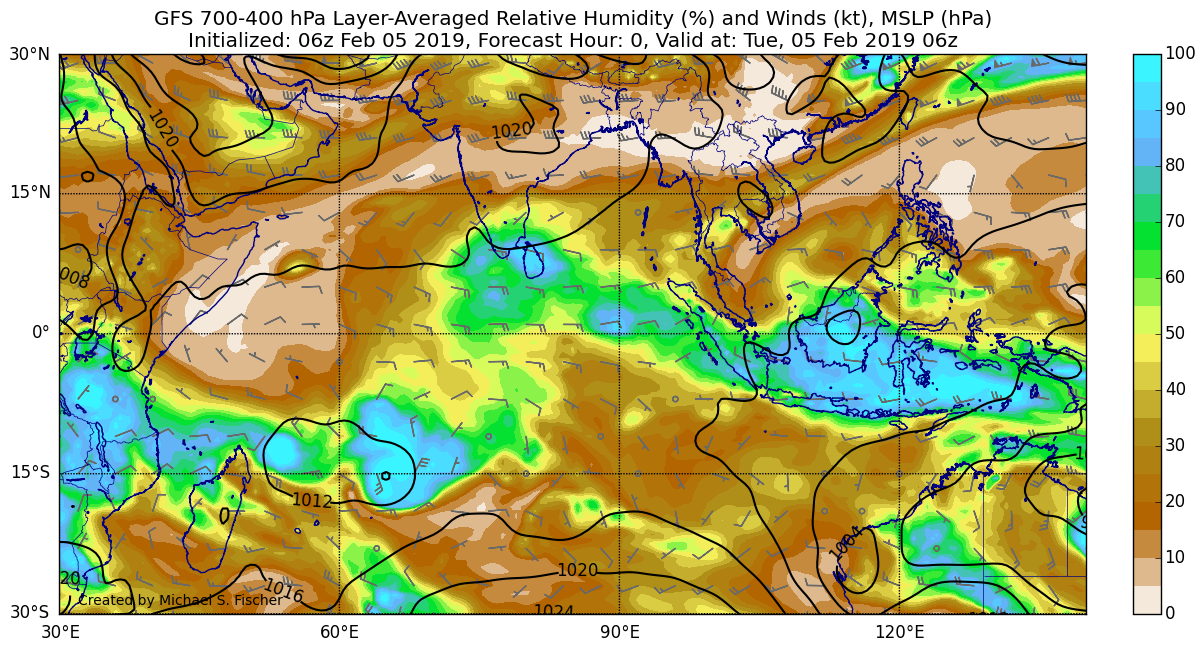
IND Plots:
Pressure and Winds on the 2 PVU Surface:
700-400 hPa Column Averaged Moisture and Winds, Sea-level Pressure:
850 hPa Vorticity, 500 hPa Geopotential Heights, and 200 hPa Winds: