
Dropsonde Sounding Plotter App
Author: Nicholas E. Johnson, nejohnson@albany.edu
Last Updated: 24 April 2026
Feedback is appreciated! If you have any comments or suggestions please send them to me using the "Send Feedback" button or by email.
Description
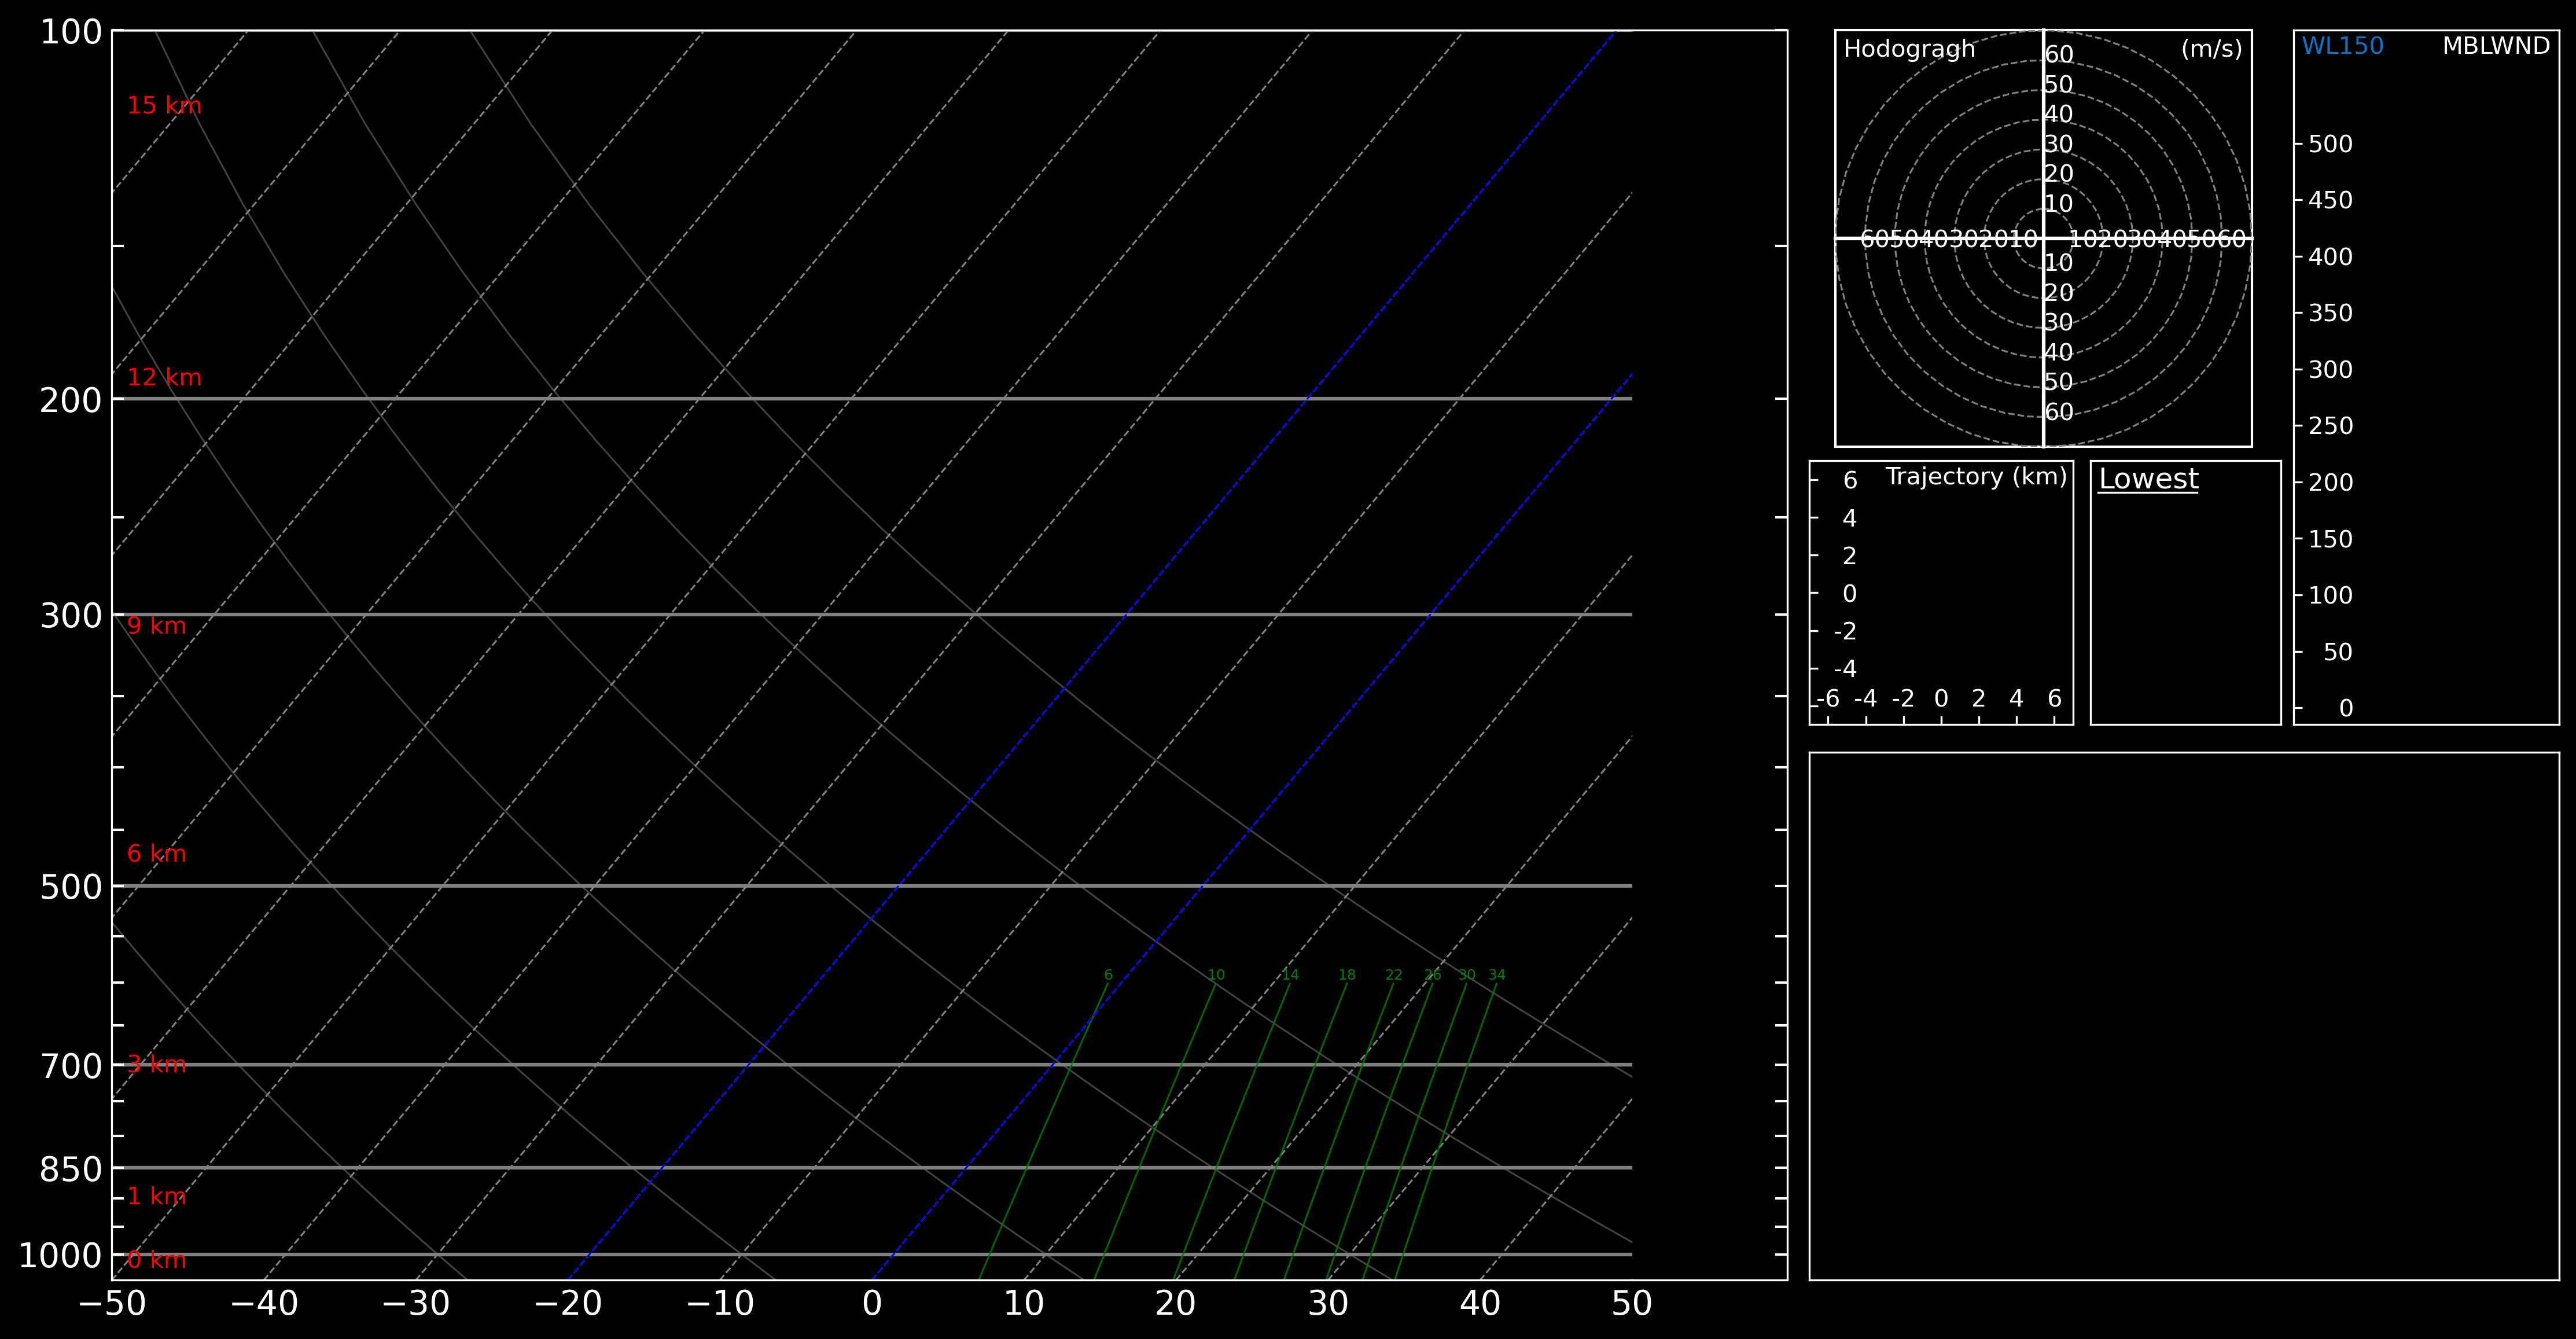
This website provides an interface for plotting dropsonde soundings. There are two operating modes: research mode and real-time mode. In research mode, archived dropsondes from both NOAA and Air Force reconnaissance flights can be loaded. In real-time mode, NOAA dropsondes released in the last 24 hours are automatically loaded. The dropsonde locations are displayed on the map and can be selected to plot the sounding for that location. The sounding plot includes derived quantities including convective parameters, wind shear, lapse rates, dropsonde trajectory, and mean low-level winds (WL150 and MBLWND). In addition to plotting the sounding on the SkewT plot, dropsonde measurements at a selected height can be shown on the map.
Instructions
Loading data
There are two options for loading dropsonde data in research mode:
- Select a flight(s) from the data browser.
- Type a flight ID or URL to a dropsonde netCDF or FRD file in the input box.
In real-time mode, the list of available dropsondes can be updated by clicking the "Check for New Dropsondes" button. If new dropsondes are available, they will be added to the map.
Plotting the SkewT
Using the dropsonde points on the map, click the point for the dropsonde from which to plot the skewT. The selected dropsonde will be highlighted in red. The skewT may take a few seconds to plot. Alternatively, instead of selecting a dropsonde from the map, a skewT can be plotted by using the "-- Select a File --" dropdown menu on the top left of the skewT plot. The dropdown menu displays the file names for each dropsonde that was loaded.
The skewT may be saved or cleared using the buttons below the plot. The plot does not need to be cleared every time a new dropsonde is plotted.
Plotting dropsonde variables
The dropsonde points on the map can be shaded to show a measured dropsonde quantity at a given height. To the right of the map, use the "-- Select Variable --" dropdown menu to select the quantity to plot. Options include:
- Pressure (hPa)
- Temperature (°C)
- Dew Point Temperature (°C)
- Relative Humidity (%)
- Equivalent Potential Temperature (K)
- Wind Speed (m/s)
- Vertical Wind* (m/s)
*The vertical wind measurements are estimates and may have significant errors.
Additional Information
- In research mode, the app may be reset using the "Clear Map" button. Reseting the app will remove all loaded dropsonde data and return all settings to defaults.
- WL150 is the average wind over the lowest available 150 m of the wind sounding. Information about the WL150 algorithm can be found here.
- MBLWND is the mean boundary level wind. The mean wind in the lowest 500 meters of the sounding
Acknowlegements