Real-time maps
EMC's GEFS plumes can be found here.
Click on the images for a 120-hour GFS forecast loop initialized at either 0000 or 1200 UTC. A loop of all three maps layered can be found here.
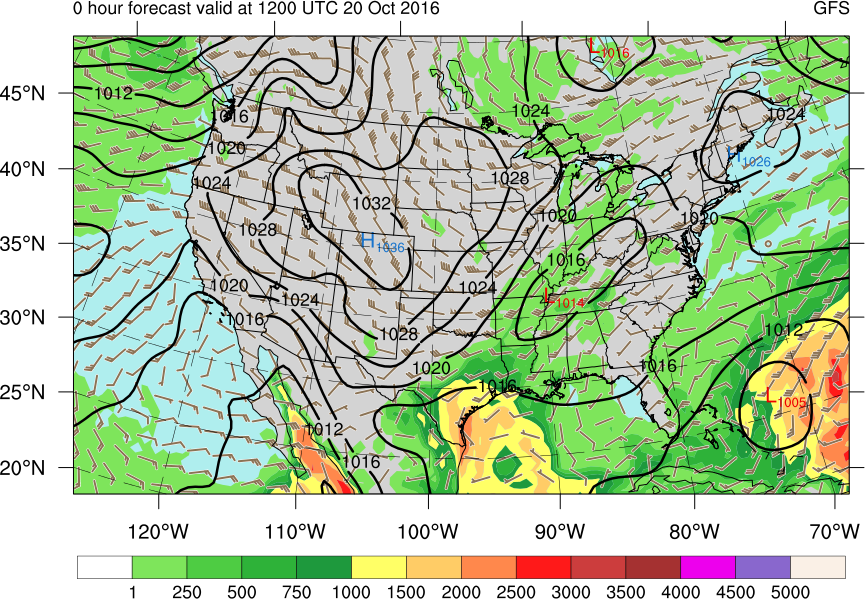
CAPE (fill, J/kg), MSLP (black contours, hPa), surface – 500-hPa shear (barbs, kt), and 6-hour accumulated precip (pink contours, every 5 mm)
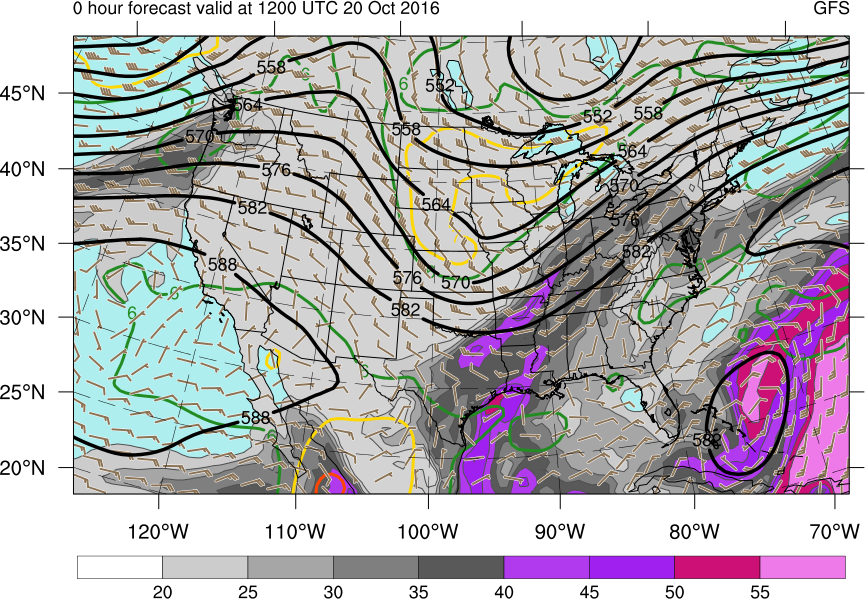
Precipitable water (fill, mm), 700 – 500-hPa lapse rates (colored contours, C/km), 500-hPa geopotential heights (black contours, dam), and 700 – 500-hPa layer averaged winds (barbs, kt)
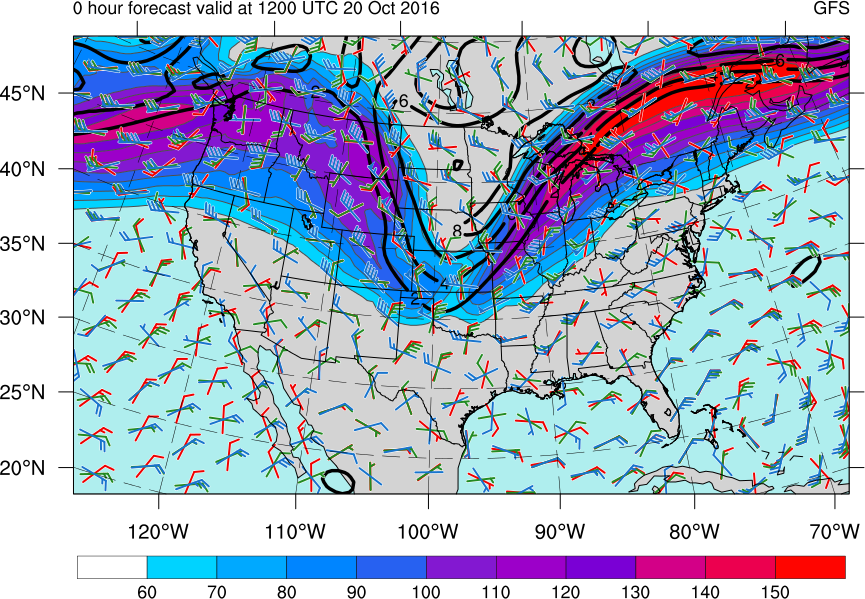
250-hPa wind magnitude (fill, kt), 300 – 200-hPa layer averaged potential vorticity (black contours, PVU), and surface (red) 850-hPa (green) 500-hPa (blue) winds (barbs, kt)