Friday Map Discussion: 26
October 2007
Friday Map Discussion Archive
home
Lance was out of town on Friday, but map discussion went on
as usual, with the topic of discussion the meteorological conditions leading to
the recent devastating southern California wildfires. As of
Sunday evening 10/28, the fires had killed 7 people, burned more than a
half-million acres, and destroyed about 2,300 homes. A New York Times interactive
graphic nicely shows the daily extent of the largest of the 24 fires during
the period 21–27 October.
The favorable meteorological
and climate conditions for the California fires that were identified on Friday were
(i) the severe drought in southern California (2006–present), (ii) western U.S.
ridge amplification in association with the passage of a Rossby wave train (19–23
October 2007), and (iii) the onset and persistence of Santa Ana conditions (21–25
October 2007).
1. Severe southern California drought (2006–present)
The driest water
year on record for downtown Los Angeles occurred
between 1
July 2006 and 30 June 2007 (see water year precipitation
time series obtained from http://home.att.net/~station_climo/). Only 3.21” inches of precipitation were recorded
during the period (see 2006–2007 daily precipitation time
series) – about one-fifth of the mean water year precipitation total of
15.08”. This precipitation total was
more than an inch lower than the previous precipitation record of 4.42” set during
the 2001–2002 water year. Several other
stations in southwestern California also recorded their driest season on record, including
Burbank (2.83”), Lancaster (1.40”), and Palmdale (0.65”) (source: NWS Los
Angeles/Oxnard WFO). In more recent
months (July–October 2007), dry conditions have persisted in southern California. A time series of 2007 Los
Angeles daily precipitation shows that, with the exception of a two-day precipitation
event in September, no precipitation has been recorded there since last April,
at the end of the last rainy season (see graph of Los Angeles seasonal
precipitation frequency distribution).
In addition to the
dearth of rain over the past 1.5 years, southern California has experienced periods of unusually warm weather. A time series of 2007 Los Angeles daily average
temperature indicates that average temperatures during June 2007 and the
period from early August through early September 2007 were above normal, and a 2006 daily average
temperature time series shows that exceptionally hot weather occurred from
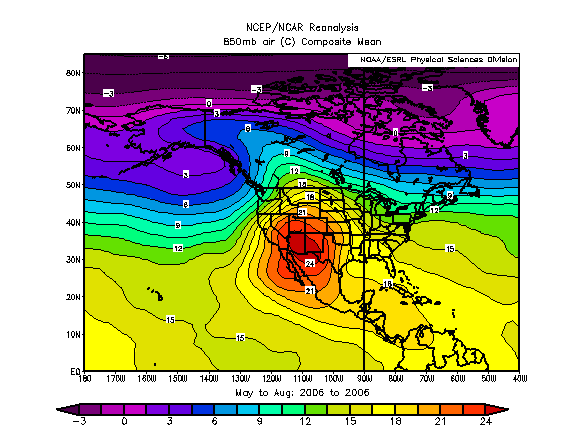
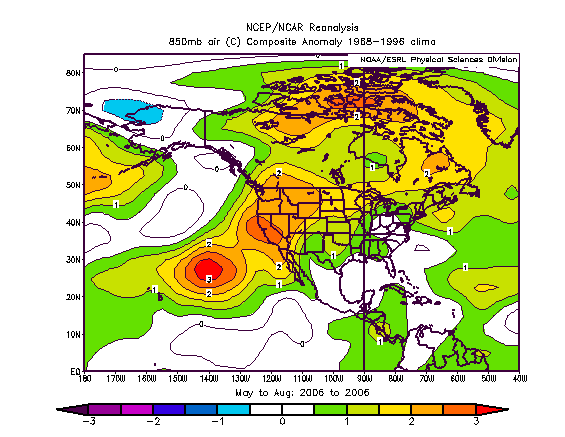
May through early September 2006. Plots
of 850-hPa temperature
and temperature
anomaly for May–August 2006 show that 850-hPa average temperatures of 21–23°C
over southern California during the period corresponded to anomalies of greater
than +2°C.
The combination of
much below-normal precipitation and periods of above-normal temperatures has
led to extreme drought conditions in southern California, according to the National
Drought Mitigation Center (see 23 October 2007 U.S.
Drought Monitor map). Archives of the weekly
Drought Monitor maps allow for an investigation of the evolution of drought spatial
coverage and severity. Comparison of the
23 October 2007
Drought Monitor map with the Drought Monitor map from approximately 1 year ago
(24 October 2006)
shows a dramatic displacement of the U.S. drought region from the High Plains,
southern Plains, and Arizona, to California and the interior West. In addition, the areal coverage of severe
drought conditions has increased substantially from one year ago. (Also of note is the incredible expansion and
increase in severity of the southeastern U.S. drought in the past year).
According to the Drought Monitor text summaries (e.g., the 13 March 2007
summary), snow pack in the southern California mountains during the 2006–2007
winter was below normal and melted earlier than usual, exacerbating drought
conditions.
2. Western U.S.
ridge amplification connection to Rossby wave train passage (19–23 October 2007)
Of interest is the
role of a Rossby wave train (downstream development) in the amplification of a ridge
over the western U.S. that led to the establishment of an interior surface high
and strong downsloping flow west of the San Jacinto,
San Bernadino, San Gabriel, and Santa Ana mountains (topographic map from
UCLA Department of Atmospheric and Oceanic Sciences). Plots of 1000–500-hPa thickness, 300-hPa wind
speed, and sea level pressure obtained from Ron
McTaggart-Cowen’s GFS
analysis animation builder for 00Z on 18, 19, 20, 21, 22, and 23 October 2007 show the rapid
transition of the Pacific jet from zonal to highly amplified, with a clear
signal of a Rossby wave train evident in the successive pattern of troughs and
ridges that propagates across the Pacific Ocean and North America. The development of a strong surface high over
the interior West was associated with the amplification and eastward surge of an
upper-level ridge over the eastern Pacific/western U.S. (see above 1000–500-hPa
thickness, 300-hPa wind speed, and sea level pressure plots for 00Z 21–23 October). A
signature of Rossby wave train propagation is also clearly evident in a Hovmöller diagram of
300-hPa meridional wind averaged between 30° and 50° N for
October 2007 (generated at the ESRL/PSD website).
3. Santa Ana conditions (21–25 October 2007)
Santa Ana conditions developed rapidly on 21 October across
southern California as high pressure became established over the interior
West. A composite plot of visible
satellite imagery and NAM sea level pressure analysis (obtained from San Francisco State University) for 00Z
22 October shows a complete absence of a marine layer near the California coast. (Also of
interest is the composite plot for 18Z 23 October,
which features smoke plumes from the fires that extend several hundred kilometers
offshore.) 10-day meteograms from Ramona (northeast of San Diego) and Valley Center (north-northeast
of San Diego) obtained from the MesoWest website at the University of Utah show that strong offshore winds and very dry
conditions developed shortly before 12Z on 21 October. At Ramona, the dew point dropped from 40°F (4°C) to around 5°F (−15°C) in less than 4 hrs. At Valley Center, the changes were more
dramatic, with a dew point drop of more than 75°F (44°C), from near 50°F (10°C)
to near −30°F (−34°C). At
both stations, the wind direction changed from variable to easterly and
increased in speed from under 5 mph to 20–35 mph (17–30 kt), with gusts to 50
mph (44 kt). The dew points at both stations
begin on 23 October to rebound slowly, though the wind direction remains predominantly
from the east (offshore) until 25 October.
Soundings from San Diego (NKX) taken at 00Z 21 October, 12Z 21 October, and 00Z 22 October (obtained
from University of Wyoming website) show the period
of transition from marine layer conditions (characterized by onshore flow and a
shallow, moist boundary layer) to Santa Ana conditions (characterized by
offshore flow and a deep, well-mixed, dry boundary layer).
To finish, I’ll offer up a few unaddressed/unresolved
science issues:
1. The extent that the drought in southern California over the past 1+ year can be attributed to La Nina
conditions (an issue brought to light by Lynn Gribble).
2. The impact of local terrain such as flow
channeling in the behavior of the fires in this case and others.
3. The trigger(s) (of tropical or extratropical origin)
of the Rossby wave train associated with the western U.S. ridge amplification.
4. The frequency that Rossby wave trains play a
role in western U.S. fire outbreaks.
Cheers,
Heather