The NOAA P-3 reconnaissance aircraft carry X band (3.2 cm) Doppler radars that scan the plane perpendicular to the aircraft. Scientists at HRD construct vertical cross sections of vertical velocity and reflectivity by combining the scans at the nadir and zenith. Hydrometeor fall speeds, estimated from radar reflectivity, are removed from the raw data to estimate vertical velocity (Marks and Houze 1987). The data has a resolution of .75 km in the horizontal, .3 km in the vertical and may extend from the sea surface to 15 km.
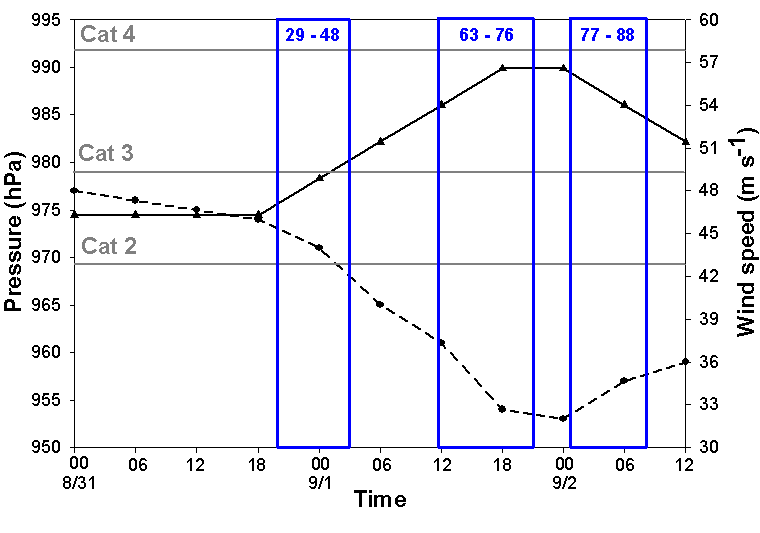
In Elena, three composite radar reflectivity and vertical motion radius-height plots were constructed. The time periods for the three composites are shown by the blue rectangles on the graph below. The first time period captures Elena as a disorganized category 2 hurricane; the middle time period shows Elena at its peak intensity, a strong category 3 hurricane; and the final time period shows Elena as the storm begins to weaken.
The
data
is composited with respect to the radius of maximum updraft
(RMU) as determined from the 850-hPa flight level data. Details on how this
radius was chosen can be found here. Only the radii that
have more than 75% data coverage will be shown in the plots
below. Regions
within the plots that have less than 75% coverage will be
blanked out white.
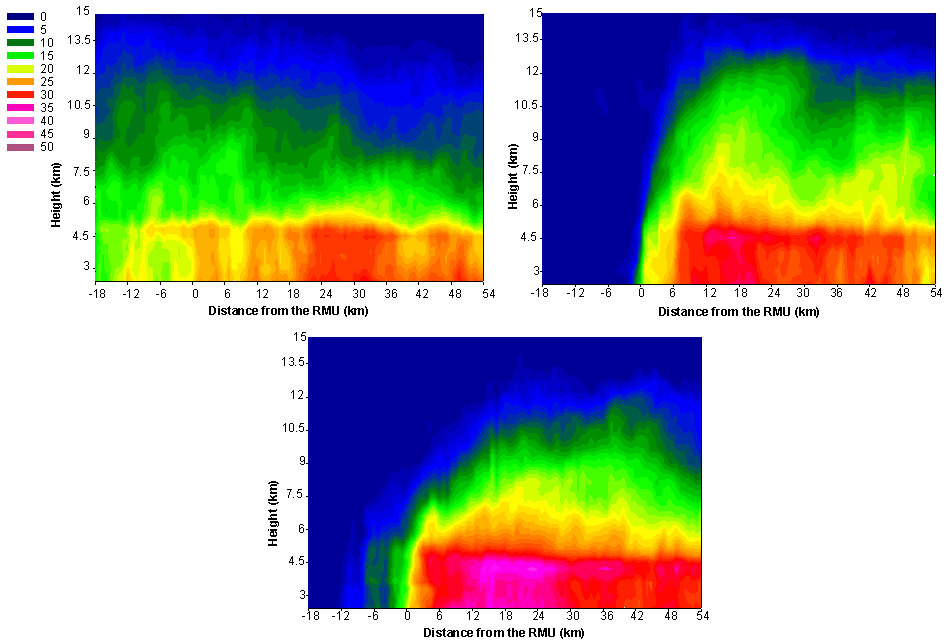
Shown above are
the composite radar reflectivity radius-height diagrams for
the beginning of deepening (upper left), maximum intensity
(upper right) and weakening (lower center) time periods. The first composite
shows Elena to be a quite disorganized category 2 hurricane
with clouds and precipitation in the eye and no well-defined
eyewall. The
bright band is seen clearly at approximately the 4.5 km level
and the maximum height of the 20 dBZ contour is ~5.5 km. Twelve hours later
the reflectivity has undergone a dramatic change. All rain and clouds
have been evacuated from the eye and a clear, well-defined
eyewall now exists with its inner edge at the RMU. Evidence of a
strong eyewall updraft channel is seen by the 20-dBZ contour
reaching 9 km. The
highest values of reflectivity are found within and below the
bright band at 18 km from the RMU. The slope of the eyewall from the
vertical (as measured by the 10 dBZ contour) is 30° in the 0-6 km level and 46° from 6-12 km. Finally, as Elena begins to weaken,
significant changes occur to the reflectivity within the
eyewall region. There
is evidence of low cloud in the eye, possibly indicating
mixing between the eye and eyewall. The inner edge of eyewall is still well
defined at the RMU with maximum values of reflectivity over 40
dBZ in the bright band between 12 and 24 km from the RMU. The maximum height
of the 20-dBZ contour is now 8 km, but not within the eyewall
itself, as the height of the clouds has been substantially
reduced in that region.
The slope of the eyewall has increased, especially at
upper levels as the 6-12 km slope is now 74°
from the vertical, while the 0-6 km slope is 34°.
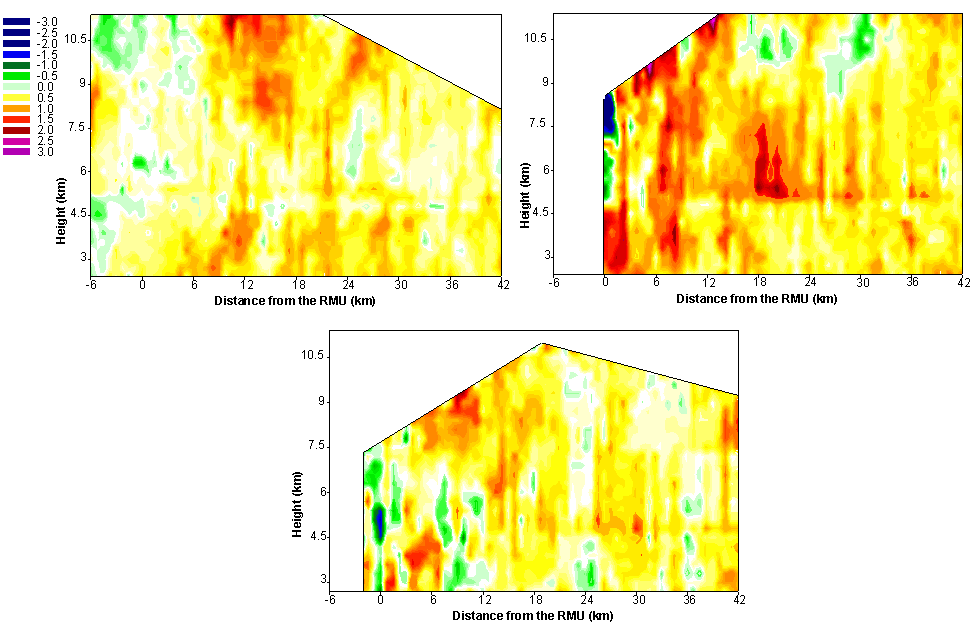
Radius-height
composites of vertical velocity for the beginning of deepening
(upper left), maximum intensity (upper right) and weakening
(lower center) time periods are shown above. In the first
composite, no deep updraft channel can be identified, due to
the lack of a well-defined eyewall as shown above. The strongest
updrafts are seen above the 9 km level, 12 to 18 km from the
RMU (recall this is the composite 850 hPa RMU which lies below
the lowest level of this plot; thus seeing small updrafts or
even downdrafts at the RMU in these diagrams is not
unexpected). Although
no eyewall has been established at this time, there is still a
greater percentage of downdrafts inside the RMU at all levels. The areal coverage
of strong (>1.5 m s-1) updrafts increases
dramatically in the next composite. A strong, tropospheric deep eyewall
updraft channel is seen sloping radially outward beginning
around 3 km from the RMU.
There is a hint of strong subsidence now being
established inside the eye, although with no clouds, and thus
no hydrometeors radially inside the inner edge of the eyewall
(see the reflectivity composite above), no vertical velocity
data exists in the core.
Strong mesoscale upward motion also exists in the 3 km
above the bright band. Finally,
during the weakening time period, a strong, eyewall updraft
channel is once again hard to define. There is a maximum
in upward motion at low levels and again at upper levels
within the eyewall, but it is difficult to connect the two
with one channel. A
much greater area of the lower portion of the eyewall is now
covered with downdrafts exceeding –1 m s-1 and the
mesoscale ascent above the melting level has disappeared.