National Lightning Detection Network (NLDN)
Since 1983, a
daily thunderstorm
probability
forecast contest has been organized by the
Department
of
Atmospheric and Environmental Sciences at the
University at Albany
during the summer months of June, July, and August
(Bosart and Landin 1994).
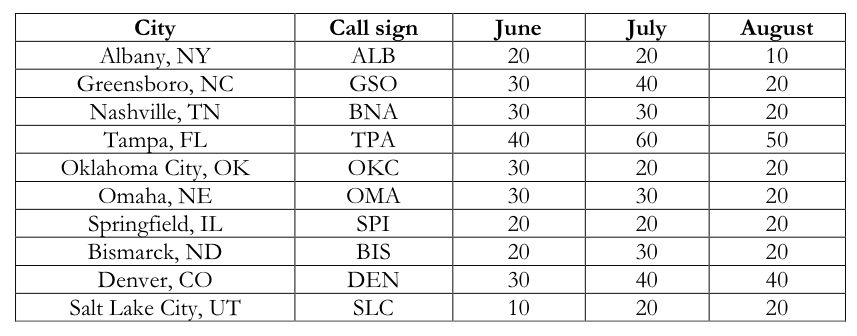
The contest involves predicting the probability to the
nearest 10% that
a thunderstorm (TS) will be reported during a 24 hour
period (starting
@ 18
UTC) at ten locations across the continental United States
(see table
below). The
forecasts are verified by standard METAR reports and are
scored against
consensus and a 16 year thunderstorm climatology
(1988–2003) shown in
the table below as the percentage of days per month with a
METAR TS
report.
In recent years however, there have been several
instances,
particularly during the overnight hours, in which a
thunderstorm failed
to
be reported in the METAR reports despite its occurrence
(see 2009
WAF
Conference presentation for examples). During
such instances, the forecast contest was verified by
contacting the
attendant NWS office directly and/or examining WSR-88D and
National
Lightning
Detection Network (NLDN) data. Given its
continuous
space and time coverage, an average detection efficiency
of ~95% and
mean location errors of < 500 m (Cummins and Murphy
2009), using the
NLDN to verify thunderstorm occurrence is explored at the
original 10 stations of the Albany forecast contest, plus
10 additional
cities to cover the full spectrum of summertime, synoptic
environments
and rates of thunderstorm occurrence across the
continental United
States.
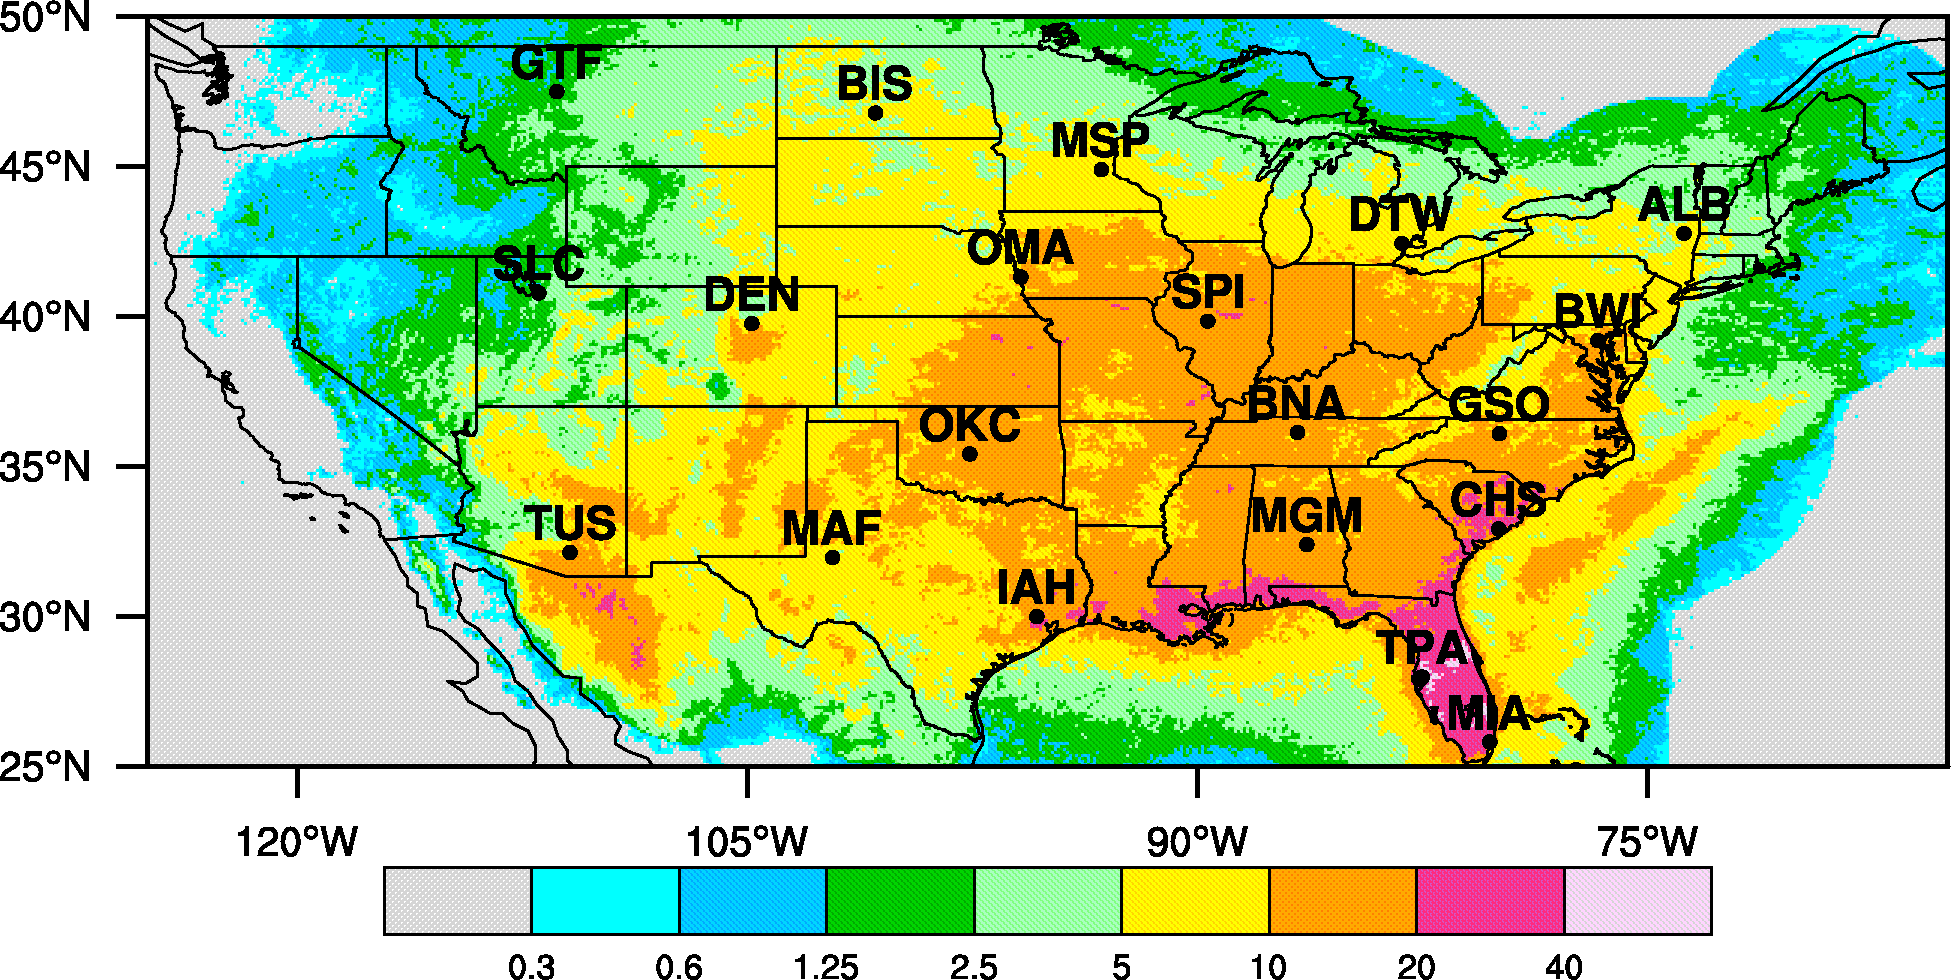
Locations (by METAR station ID) of the 20 cities examined, overlaid on the 15 year (1995-2009) June, July, August NLDN flash density (in flashes per km2 per year).
Locations (by METAR station ID) of the 20 cities examined, overlaid on the 15 year (1995-2009) June, July, August NLDN flash density (in flashes per km2 per year).
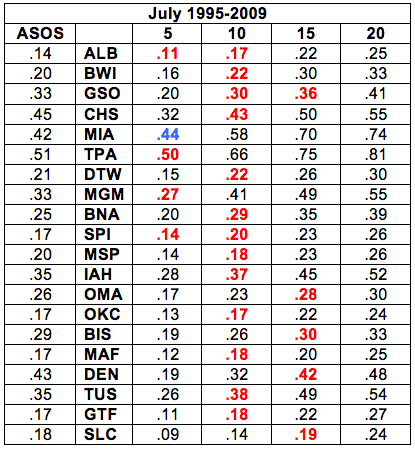
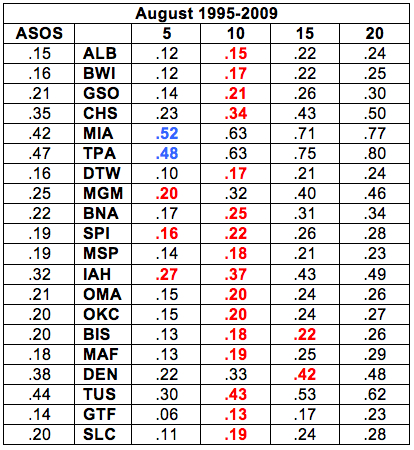
The
tables and bar
charts below show the 15 year (1995-2009) June, July
and August (JJA)
METAR
thunderstorm climatologies (ASOS column) and the
climatology of NLDN
detected lightning within 5, 10, 15 and 20 km of
each station as the
fraction of days per month with a TS report or NLDN
detected
flash. The red numbers highlight the
radial bin with the
NLDN climatological value closest to the ASOS value
(i.e., for June
ALB, .16 at 10 km is the closest to the .15 ASOS
value). Numbers
in blue highlight instances where the 5 km NLDN
climatological value
exceeds the ASOS value.
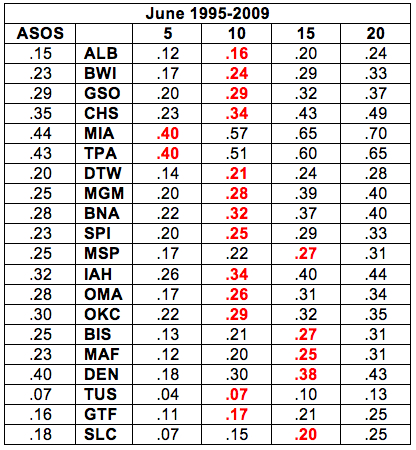
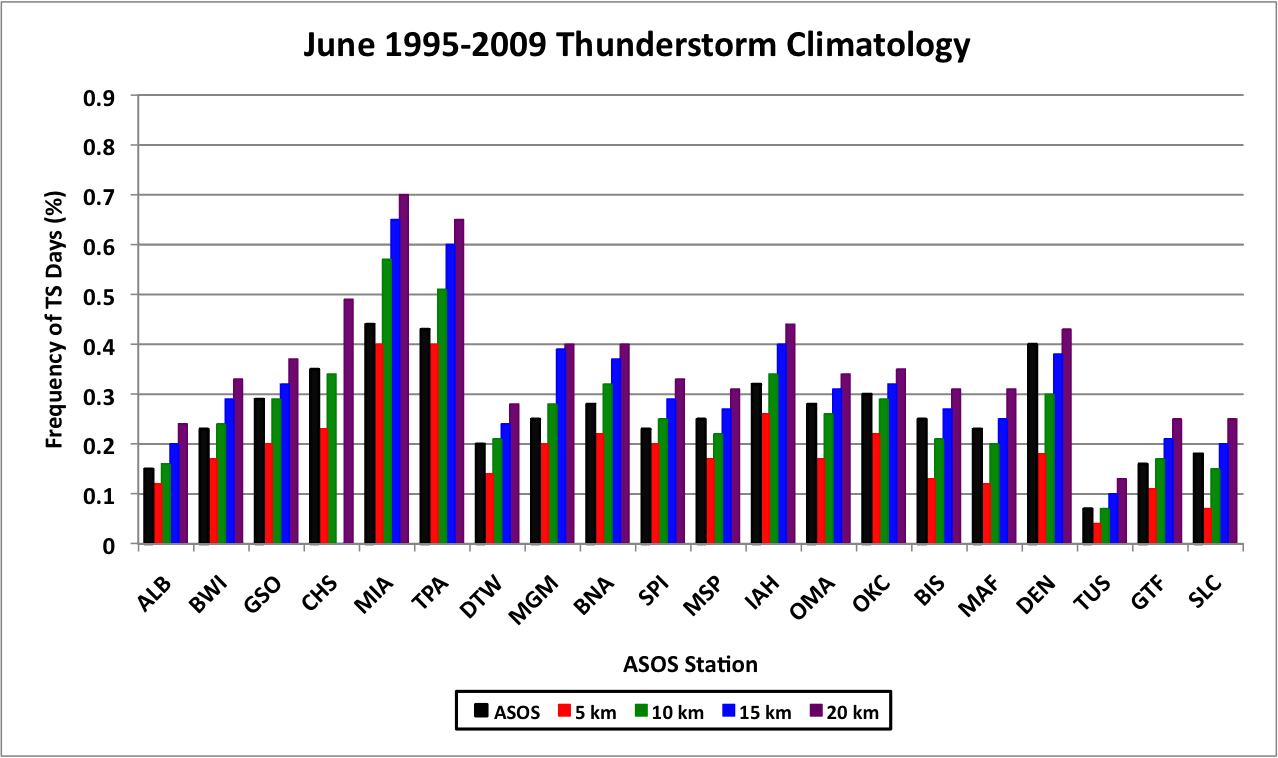
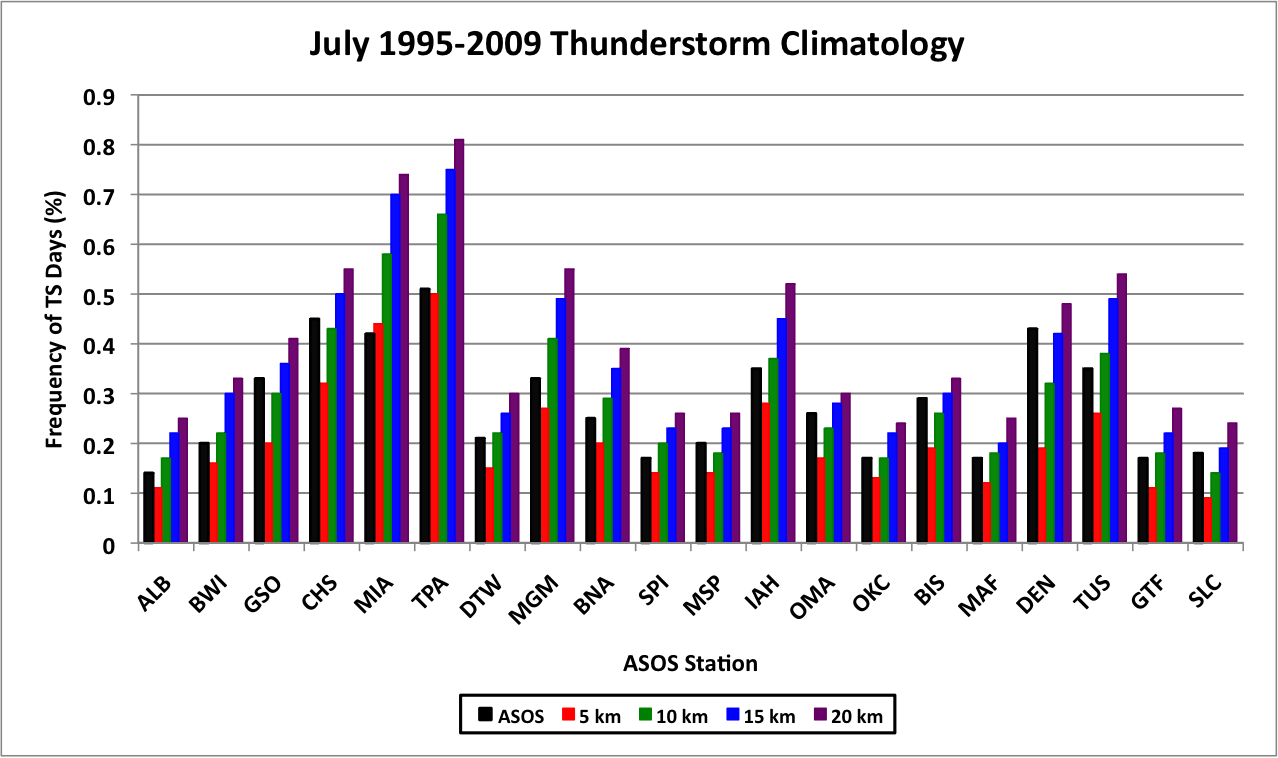
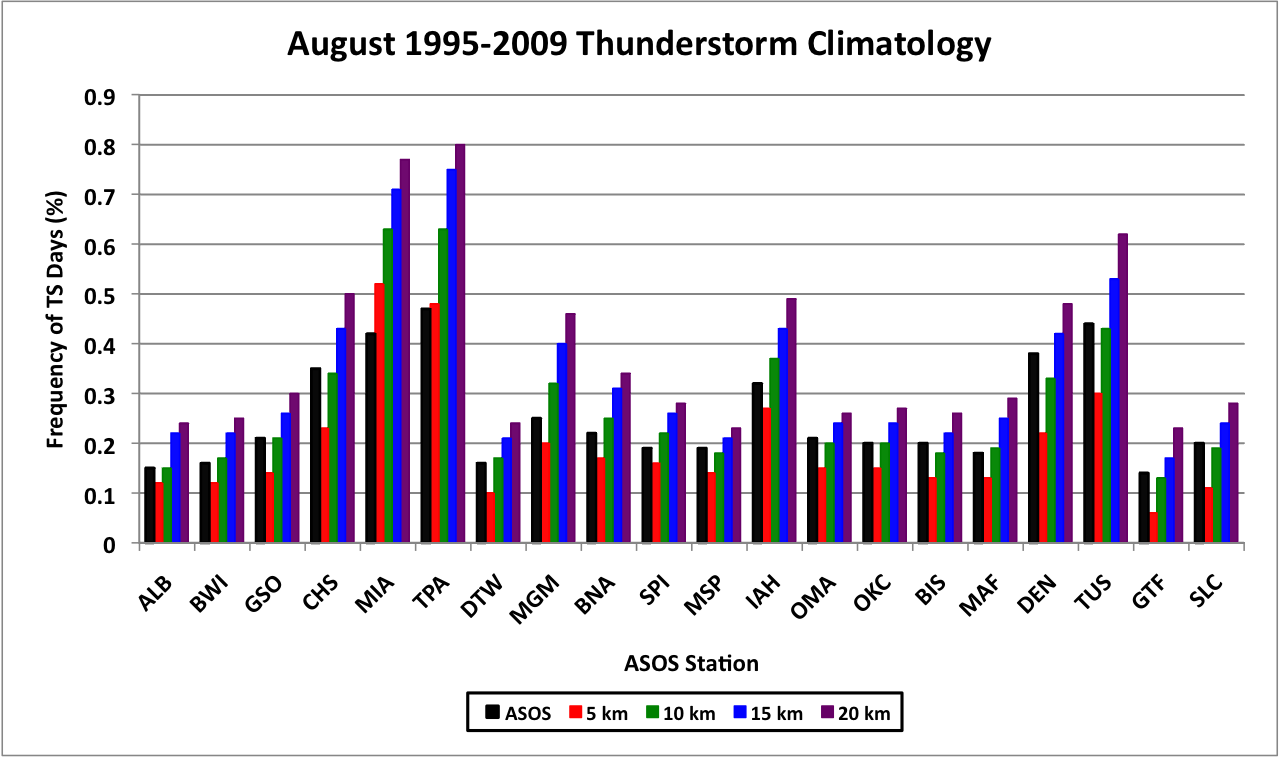
As seen in the tables and figures above, 10 km is the radial
range that best agrees with the METAR TS climatology, in
agreement with Bosart and Landin's (1994) statement that
thunder can generally be heard within 10 km of a station.
There are, however, some distinct exceptions: 1) MIA and
TPA both have months (July and August) where the number
of days with flashes within 5 km of the station exceeds the
number of TS days, and 2) TS reports for stations in the
western U.S. (DEN, BIS, SLC) tend to agree best with the
number of NLDN lightning days further from the stations,
e.g., at the 15 km radius.
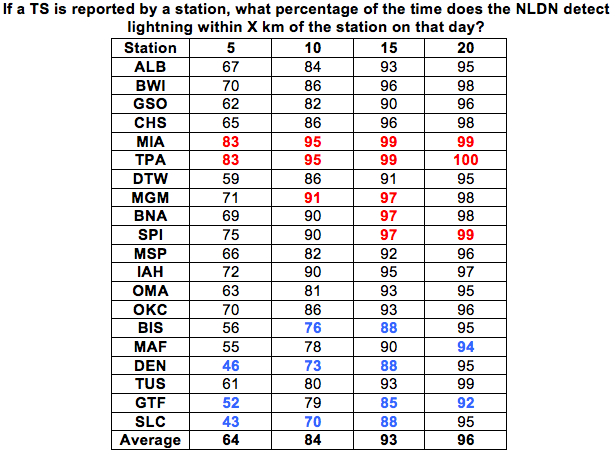
The tables and graphs above explore the number of METAR TS and NLDN detected lightning days without taking into account whether these days actually match in the two data sets. The tables below take date matching into account and address two fundamental questions: 1) If the NLDN detects lightning within X km (where X = 5, 10, 15 or 20) of a station, what percentage of the time does that station report a TS on that day?, and 2) If a TS is reported by a station, what percentage of the time does the NLDN detect lightning within X km of the station on that date? Average values are listed at the bottom of the tables and red (blue) numbers denote values one standard deviation above (below) the mean.
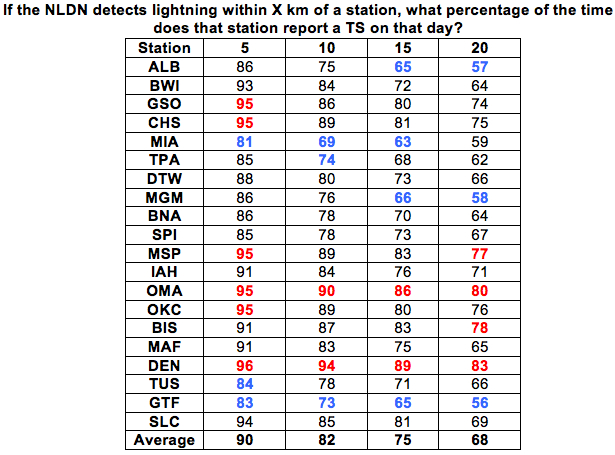
The table on the left above shows that GSO, CHS, MSP, OKC, and especially OMA and DEN are excellent verifiers of thunderstorms, e.g., when there is lightning within 10 km of the station, a TS is reported in the METARs. On the other hand, MIA, TPA, TUS and GTF are very poor verifiers of thunderstorms, i.e. there are many days with lightning within 10 km of the station when no TS is reported. While one might suspect that the low verification rates at TPA and MIA are due to the fact that lightning is observed nearly every summer day in Florida, the flash density plot above shows that stations such as IAH and CHS have almost as lightning per year as MIA and TPA and verify at rates above the mean. (Possible explanations for the low verification rate in TUS and GTF will be explored below.)
The table to the right above verifies the strong east/west dichotomy noted above: stations in the western U.S. (DEN, SLC, BIS, GTF) verify TSs with lightning at much farther distances from the stations than locations in the eastern U.S.. Fewer trees and buildings for longer sight lines and less sound absorption are the most likely contributing factors to this difference.
 The
next factor
explored is the interannual variability of the total
number of JJA METAR reported TS days (hereon denoted
METAR) and total
number of JJA days with lightning detected with 10
km of each
station (NLDN10),
and their
correlation.
The
next factor
explored is the interannual variability of the total
number of JJA METAR reported TS days (hereon denoted
METAR) and total
number of JJA days with lightning detected with 10
km of each
station (NLDN10),
and their
correlation.
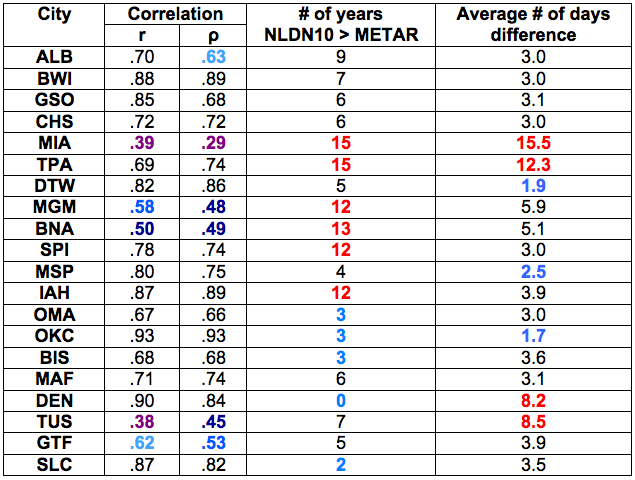
The table to the right shows the Pearson (r) and Spearman rank (rho) correlation coefficients between METAR and NLDN10; the number of years, out of 15, NLDN10 > METAR (mean of 7.3); and the average absolute value of NLDN10-METAR, i.e., the number of days difference between the two measures of thunderstorm activity (mean = 4.9 days, median = 3.3 days).
In the correlation columns, the light blue, medium blue, dark blue and purple shadings represent cities failing to have a significant positive correlation between METAR and NLDN10 at the 99.5, 99, 97.5 and 95% levels, respectively. In the last two columns, red (blue) numbers represent values one standard deviation above (below) the mean values indicated in the paragraph above.
A number of interesting results are revealed in the table. First, MIA, TUS, BNA, MGM, GTF and ALB all fail to have significant positive correlations between the number of JJA METAR reported TS days and the number of days with lightning within 10 km of the stations. On the other end of the spectrum, OKC, DEN, BWI, and IAH have very high correlations between the two data sets. Second, the fourth column is another confirmation of western stations having METAR TS days with lightning at much greater distances than eastern stations. Third, the last column shows that the largest average differences between METAR and NLDN10 are recorded at MIA and TPA, where lightning routinely is detected within 10 km of the stations and no TS is reported, and DEN and TUS, where TSs are verified with lightning at distances > 10 km and monsoonal variability dominates, respectively. Stations with low differences are DTW, MSP and OKC, indicating 10 km is the ideal radial distance for TS verification at those sites.
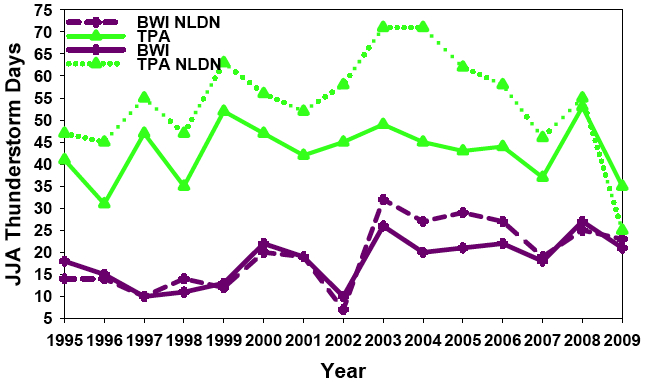
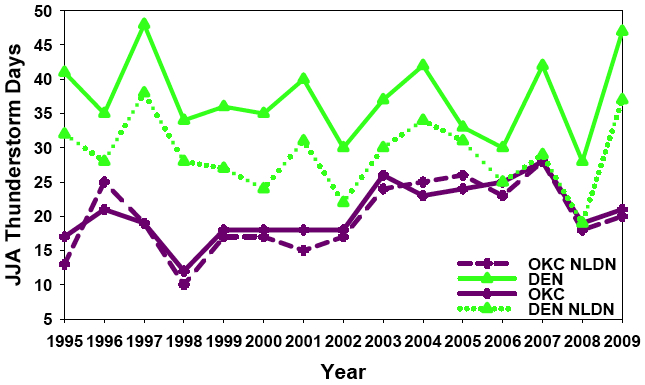
The plots below examine the points above in greater detail by showing the interannual variability in METAR (solid lines) and NLDN10 (dashed lines) for six selected cities (plots for the other 14 cities can be found here).
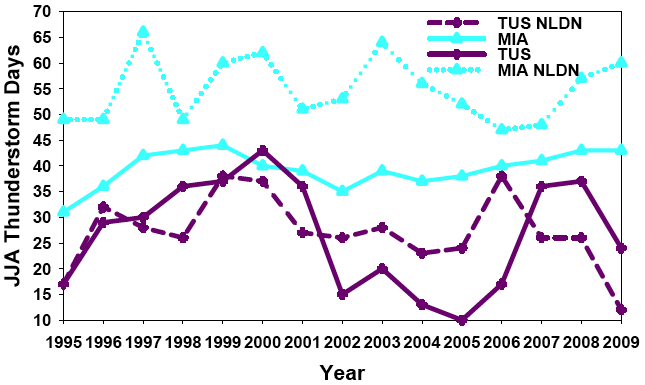
The plot to the left above shows the interannual variability of METAR and NLDN10 for the cities with the two lowest correlation coefficients between the data sets, MIA and TUS. The poor correlation in TUS seems to be due to changes in METAR lagging those in NLDN10 by a year. The strong interannual variability of precipitation in Arizona associated with the North American Monsoon System (NAMS) seems to be the major contributing factor in this difference and is explored further below.
The low correlation in MIA is due to METAR remaining flat
with time, while NLDN10 (which is always larger than
METAR) exhibits significant year to year variability. In
contrast, TPA (shown to the right above), which also always
has NLDN10 > METAR, does exhibit variability in both
METAR and NLDN10 and has a significant positive
correlation between the two.
BWI (above right), DEN and OKC (both left) exhibit three
of the largest correlation coefficients between METAR and
NLDN10 despite large differences in number of TS days at
each station and between METAR and NLDN10 at DEN
where METAR is always greater than NLDN10.
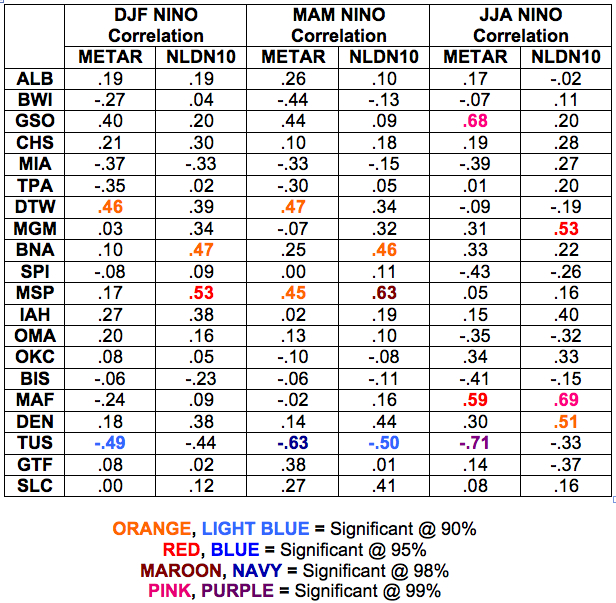
The next subject explored is the relationship between summertime thunderstorm activity over the U.S. and ENSO. The table below shows the Spearman rank correlation coefficients between the two measures of TS activity (METAR and NLDN10) and the preceding winter (DJF) and spring (MAM), and concurrent (JJA) Oceanic Niño Index (ONI). The colored numbers indicate statistical significance at the values listed below the table.
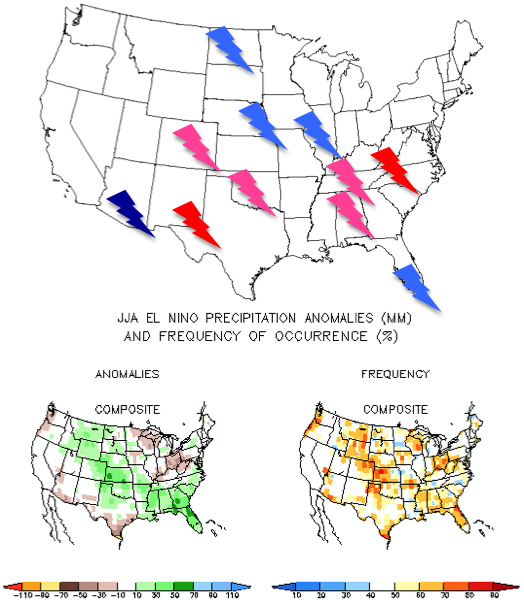
The city with the strongest and most consistent relationship with ENSO is TUS, exhibiting negative correlations (i.e., warm Pacific waters, less TS activity) across the seasons and measures of TS activity, with 4/6 values being statistically significant. DTW, BNA and MSP show positive correlations between winter and spring ENSO values and subsequent JJA TS activity, while GSO, MGM, MAF and DEN all exhibit statistically significant positive correlations between TS activity and ENSO in JJA. These later relationships, and the one with TUS noted above, are broadly consistent with the known patterns of JJA ENSO precipitation anomalies shown below with less rainfall/TS activity in the midwest, upper Plains and southwest, and more rainfall/TS activity in the southeast and Great Plains (the top panel is from this study with pink/red = positive correlations and blue/navy = negative correlations; and the bottom panel is from CPC).
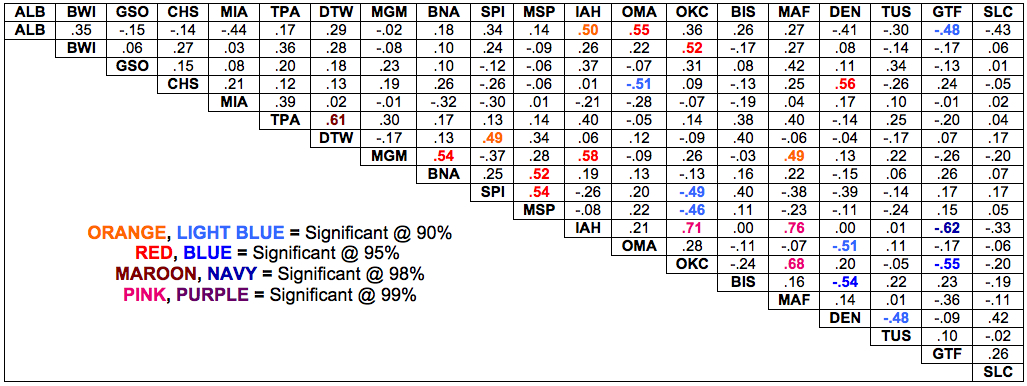
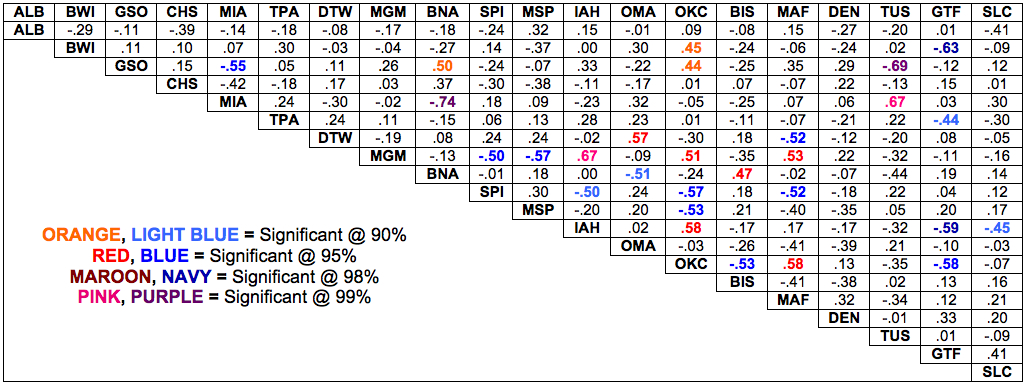
Finally, relationships involving the amount of TS activity between the 20 cities are examined. The two tables below show the Spearman rank coefficients for the correlations of NLDN10 (top) and METAR (bottom) between each city with the significant values colored as indicated within the tables.
The cities with the largest numbers of significant correlations are OKC and IAH, which reveal more TS activity in these cities is positively correlated with activity in cities on the east coast and in the southeast and negatively correlated with TS activity in the upper midwest, northern Plains and western U.S. (MGM and MAF have fewer significant correlations but also reveal the same pattern). Conversely, SPI TS activity is positively correlated with activity in the upper midwest and northeast, and strongly negatively correlated with activity in the southeastern U.S. and southern Plains.
As seen in the tables and figures above, 10 km is the radial
range that best agrees with the METAR TS climatology, in
agreement with Bosart and Landin's (1994) statement that
thunder can generally be heard within 10 km of a station.
There are, however, some distinct exceptions: 1) MIA and
TPA both have months (July and August) where the number
of days with flashes within 5 km of the station exceeds the
number of TS days, and 2) TS reports for stations in the
western U.S. (DEN, BIS, SLC) tend to agree best with the
number of NLDN lightning days further from the stations,
e.g., at the 15 km radius.
The tables and graphs above explore the number of METAR TS and NLDN detected lightning days without taking into account whether these days actually match in the two data sets. The tables below take date matching into account and address two fundamental questions: 1) If the NLDN detects lightning within X km (where X = 5, 10, 15 or 20) of a station, what percentage of the time does that station report a TS on that day?, and 2) If a TS is reported by a station, what percentage of the time does the NLDN detect lightning within X km of the station on that date? Average values are listed at the bottom of the tables and red (blue) numbers denote values one standard deviation above (below) the mean.
The table on the left above shows that GSO, CHS, MSP, OKC, and especially OMA and DEN are excellent verifiers of thunderstorms, e.g., when there is lightning within 10 km of the station, a TS is reported in the METARs. On the other hand, MIA, TPA, TUS and GTF are very poor verifiers of thunderstorms, i.e. there are many days with lightning within 10 km of the station when no TS is reported. While one might suspect that the low verification rates at TPA and MIA are due to the fact that lightning is observed nearly every summer day in Florida, the flash density plot above shows that stations such as IAH and CHS have almost as lightning per year as MIA and TPA and verify at rates above the mean. (Possible explanations for the low verification rate in TUS and GTF will be explored below.)
The table to the right above verifies the strong east/west dichotomy noted above: stations in the western U.S. (DEN, SLC, BIS, GTF) verify TSs with lightning at much farther distances from the stations than locations in the eastern U.S.. Fewer trees and buildings for longer sight lines and less sound absorption are the most likely contributing factors to this difference.
The
next factor
explored is the interannual variability of the total
number of JJA METAR reported TS days (hereon denoted
METAR) and total
number of JJA days with lightning detected with 10
km of each
station (NLDN10),
and their
correlation. The table to the right shows the Pearson (r) and Spearman rank (rho) correlation coefficients between METAR and NLDN10; the number of years, out of 15, NLDN10 > METAR (mean of 7.3); and the average absolute value of NLDN10-METAR, i.e., the number of days difference between the two measures of thunderstorm activity (mean = 4.9 days, median = 3.3 days).
In the correlation columns, the light blue, medium blue, dark blue and purple shadings represent cities failing to have a significant positive correlation between METAR and NLDN10 at the 99.5, 99, 97.5 and 95% levels, respectively. In the last two columns, red (blue) numbers represent values one standard deviation above (below) the mean values indicated in the paragraph above.
A number of interesting results are revealed in the table. First, MIA, TUS, BNA, MGM, GTF and ALB all fail to have significant positive correlations between the number of JJA METAR reported TS days and the number of days with lightning within 10 km of the stations. On the other end of the spectrum, OKC, DEN, BWI, and IAH have very high correlations between the two data sets. Second, the fourth column is another confirmation of western stations having METAR TS days with lightning at much greater distances than eastern stations. Third, the last column shows that the largest average differences between METAR and NLDN10 are recorded at MIA and TPA, where lightning routinely is detected within 10 km of the stations and no TS is reported, and DEN and TUS, where TSs are verified with lightning at distances > 10 km and monsoonal variability dominates, respectively. Stations with low differences are DTW, MSP and OKC, indicating 10 km is the ideal radial distance for TS verification at those sites.
The plots below examine the points above in greater detail by showing the interannual variability in METAR (solid lines) and NLDN10 (dashed lines) for six selected cities (plots for the other 14 cities can be found here).
The plot to the left above shows the interannual variability of METAR and NLDN10 for the cities with the two lowest correlation coefficients between the data sets, MIA and TUS. The poor correlation in TUS seems to be due to changes in METAR lagging those in NLDN10 by a year. The strong interannual variability of precipitation in Arizona associated with the North American Monsoon System (NAMS) seems to be the major contributing factor in this difference and is explored further below.
The low correlation in MIA is due to METAR remaining flat
with time, while NLDN10 (which is always larger than
METAR) exhibits significant year to year variability. In
contrast, TPA (shown to the right above), which also always
has NLDN10 > METAR, does exhibit variability in both
METAR and NLDN10 and has a significant positive
correlation between the two.
BWI (above right), DEN and OKC (both left) exhibit three
of the largest correlation coefficients between METAR and
NLDN10 despite large differences in number of TS days at
each station and between METAR and NLDN10 at DEN
where METAR is always greater than NLDN10.
The next subject explored is the relationship between summertime thunderstorm activity over the U.S. and ENSO. The table below shows the Spearman rank correlation coefficients between the two measures of TS activity (METAR and NLDN10) and the preceding winter (DJF) and spring (MAM), and concurrent (JJA) Oceanic Niño Index (ONI). The colored numbers indicate statistical significance at the values listed below the table.
The city with the strongest and most consistent relationship with ENSO is TUS, exhibiting negative correlations (i.e., warm Pacific waters, less TS activity) across the seasons and measures of TS activity, with 4/6 values being statistically significant. DTW, BNA and MSP show positive correlations between winter and spring ENSO values and subsequent JJA TS activity, while GSO, MGM, MAF and DEN all exhibit statistically significant positive correlations between TS activity and ENSO in JJA. These later relationships, and the one with TUS noted above, are broadly consistent with the known patterns of JJA ENSO precipitation anomalies shown below with less rainfall/TS activity in the midwest, upper Plains and southwest, and more rainfall/TS activity in the southeast and Great Plains (the top panel is from this study with pink/red = positive correlations and blue/navy = negative correlations; and the bottom panel is from CPC).
Finally, relationships involving the amount of TS activity between the 20 cities are examined. The two tables below show the Spearman rank coefficients for the correlations of NLDN10 (top) and METAR (bottom) between each city with the significant values colored as indicated within the tables.
The cities with the largest numbers of significant correlations are OKC and IAH, which reveal more TS activity in these cities is positively correlated with activity in cities on the east coast and in the southeast and negatively correlated with TS activity in the upper midwest, northern Plains and western U.S. (MGM and MAF have fewer significant correlations but also reveal the same pattern). Conversely, SPI TS activity is positively correlated with activity in the upper midwest and northeast, and strongly negatively correlated with activity in the southeastern U.S. and southern Plains.