ATM533 Fall 2025 Week 2: Tabular Data Visualization
2024 Atlantic Tropical Cyclones Track Map
This notebook reads in historical tropical cyclone tracks from the Hurdat2 database; selects named storms that occurred in the Atlantic basin in 2024, and plots their tracks on a labeled map.
Based on Metpy Monday Episodes 142 and 143
Notebook author: Kevin Tyle
Imports
import pandas as pd
import matplotlib.pyplot as plt
from datetime import datetime
import cartopy.crs as ccrs
import cartopy.feature as cfeature
import matplotlib.pyplot as plt
import matplotlib as mpl
import numpy as np
Define a function to convert coordinates into floating point values
def lat_lon_to_float(v):
    """
    Convert strings from NHC to float locations
    """
    if (v[-1] == 'S') or (v[-1] == 'W'):
        multiplier = -1
    else:
        multiplier = 1
    return float(v[:-1]) * multiplier
Read in and parse the HURDAT2 data file, using built-in Python functions and the datetime library
data = []
with open('/spare11/atm533/data/hurdat2.txt', 'r') as f:
    for line in f.readlines():
        if line.startswith('AL'):
            storm_id = line.split(',')
            storm_number = storm_id[0].strip()
            storm_name = storm_id[1].strip()
        else:
            location_line = line.split(',')
            dt = datetime.strptime(location_line[0] + location_line[1], '%Y%m%d %H%M')
            storm_status = location_line[3].strip()
            storm_lat = lat_lon_to_float(location_line[4].strip())
            storm_lon = lat_lon_to_float(location_line[5].strip())
            max_speed = float(location_line[6].strip())
            central_pressure = float(location_line[7].strip())
            data.append([storm_number, storm_name, storm_status, storm_lat,storm_lon, dt, max_speed,central_pressure])
Examine the first list element
data[0]['AL011851',
'UNNAMED',
'HU',
28.0,
-94.8,
datetime.datetime(1851, 6, 25, 0, 0),
80.0,
-999.0]Create a Pandas dateframe from the list, explicitly defining column names.
df = pd.DataFrame(data, columns=['Storm_Num', 'Storm_Name', 'Storm_Status', 'Lat', 'Lon', 'Time', 'Max_Speed', 'Min_SLP'])Examine the dataframe
dfHow many unique storms do we have?
len(df['Storm_Num'].unique())1991uniqueStorms = df['Storm_Num'].unique()uniqueStormsarray(['AL011851', 'AL021851', 'AL031851', ..., 'AL172024', 'AL182024',
'AL192024'], dtype=object)Grouping by storm status, get the counts of each class of storm.
df.groupby('Storm_Status').count()Get those storms that occurred in a desired year
year = '2024'dfYear = df[df['Time'].dt.strftime("%Y") == year]dfYearWhat are the unique storm names of this particular year?
dfYear['Storm_Name'].unique()array(['ALBERTO', 'BERYL', 'CHRIS', 'DEBBY', 'ERNESTO', 'FRANCINE',
'GORDON', 'HELENE', 'ISAAC', 'JOYCE', 'KIRK', 'LESLIE', 'MILTON',
'NADINE', 'OSCAR', 'PATTY', 'RAFAEL', 'SARA'], dtype=object)Depending on the year, we might have a couple of unnamed storms ... that is, storms that have been assigned a numerical name. These were tropical cyclones tracked by NHC (and thus in the HURDAT2 database) but never reached tropical storm status. We will want to omit these. We can do this by excluding those storms that never reached tropical storm, subtropical storm, or hurricane status.
To make things easier to read and analyze, make the storm name the index of the dataframe.
dfYear = dfYear.set_index('Storm_Name')
dfYearIterate over each storm name, and check if the storm ever reached a named storm status. If so, add it to a list.
dfYear.index.unique()Index(['ALBERTO', 'BERYL', 'CHRIS', 'DEBBY', 'ERNESTO', 'FRANCINE', 'GORDON',
'HELENE', 'ISAAC', 'JOYCE', 'KIRK', 'LESLIE', 'MILTON', 'NADINE',
'OSCAR', 'PATTY', 'RAFAEL', 'SARA'],
dtype='object', name='Storm_Name')keep = []
for name in dfYear.index.unique():
stormStatusSeries = dfYear.loc[name]['Storm_Status']
if stormStatusSeries.str.contains('DB|TS|SS').any():
print(f'{name} was named')
keep.append(name)
else:
print(f'{name} was NOT named')ALBERTO was named
BERYL was named
CHRIS was named
DEBBY was named
ERNESTO was named
FRANCINE was named
GORDON was named
HELENE was named
ISAAC was named
JOYCE was named
KIRK was named
LESLIE was named
MILTON was named
NADINE was named
OSCAR was named
PATTY was named
RAFAEL was named
SARA was named
Create a new Dataframe which now consists only of the named storms.
dfYearNamed = dfYear.loc[keep]dfYearNamed.index.unique()Index(['ALBERTO', 'BERYL', 'CHRIS', 'DEBBY', 'ERNESTO', 'FRANCINE', 'GORDON',
'HELENE', 'ISAAC', 'JOYCE', 'KIRK', 'LESLIE', 'MILTON', 'NADINE',
'OSCAR', 'PATTY', 'RAFAEL', 'SARA'],
dtype='object', name='Storm_Name')How many named storms do we have?
nStorms = len(dfYearNamed.index.unique())
nStorms18Extract one of the named storms from the yearly dataframe
TC = dfYearNamed.loc['HELENE']Examine the subsetted dataframe
TCWrite it out to a CSV file for later use
TC.to_csv('helene_2024.csv', index=True)Note:
If you've picked a different year and storm name, be sure you make the appropriate edits to the code cell immediately above and the code cell a little above that!Plot the map
Set the projection for the dataset and figure. The dataset uses latitude and longitude for its coordinates (PlateCarree). Given the large domain over which TCs may have tracked in a given year, use PlateCarree for the figure as well.
data_crs = ccrs.PlateCarree()
plot_crs = ccrs.PlateCarree()
Color and linestyle considerations
Distinguishing each track will be challenging. One strategy is to cycle through colors in a colormap and linestyles in a tuple (akin to a list).
colors = mpl.cm.hsv(np.linspace(0, 1, nStorms))Create a tuple of Matplotlib linestyles. Repeat the pattern a number of times so we can ensure the number of linestyles is always greater than or equal to the number of storms.
linestyle_tuple = 100*[
     ('loosely dotted',        (0, (1, 10))),
     ('dotted',                (0, (1, 1))),
     ('densely dotted',        (0, (1, 1))),
     ('long dash with offset', (5, (10, 3))),
     ('loosely dashed',        (0, (5, 10))),
     ('dashed',                (0, (5, 5))),
     ('densely dashed',        (0, (5, 1))),

     ('loosely dashdotted',    (0, (3, 10, 1, 10))),
     ('dashdotted',            (0, (3, 5, 1, 5))),
     ('densely dashdotted',    (0, (3, 1, 1, 1))),

     ('dashdotdotted',         (0, (3, 5, 1, 5, 1, 5))),
     ('loosely dashdotdotted', (0, (3, 10, 1, 10, 1, 10))),
     ('densely dashdotdotted', (0, (3, 1, 1, 1, 1, 1)))]
linestyles = linestyle_tuple[::1][:nStorms]# Use medium-scale cartographic features
res = '50m'
fig = plt.figure(figsize=(15,12), dpi=150)
ax = plt.subplot(1,1,1, projection=plot_crs)
ax.set_extent([-150, 0, 5, 65], data_crs)
ax.set_facecolor(cfeature.COLORS['water'])
ax.add_feature (cfeature.STATES.with_scale(res))
ax.add_feature (cfeature.LAND.with_scale(res))
ax.add_feature (cfeature.COASTLINE.with_scale(res))
ax.add_feature (cfeature.LAKES.with_scale(res))
ax.add_feature (cfeature.STATES.with_scale(res))
# Loop over each storm
for idx, storm_name in enumerate(dfYearNamed.index.unique()):
storm_data = dfYearNamed[dfYearNamed.index == storm_name]
track_len = len(storm_data)
ax.plot(storm_data['Lon'], storm_data['Lat'], transform=data_crs,
label=storm_name,c=colors[idx],linestyle=linestyles[idx][1])
s = ax.scatter(storm_data['Lon'], storm_data['Lat'], transform=data_crs, c=storm_data['Max_Speed'],
vmin=40, vmax=150, s=storm_data['Max_Speed']/5, cmap='Reds')
# Get the coordinates of the first point in each storm's track, to be used for labeling
lon0, lat0 = storm_data['Lon'].iloc[0], storm_data['Lat'].iloc[0]
ax.text(lon0, lat0, s=storm_name,fontdict=dict(color='black', size=6), bbox=dict(facecolor='#CCCCCC', alpha=0.5))
ax.legend(loc='upper left', fontsize=7)
# Once out of the loop, create and label a colorbar, set the title, and save the figure.
cbar = plt.colorbar(s,shrink=0.35)
cbar.ax.tick_params(labelsize=12)
cbar.ax.set_ylabel("Windspeed (kts)",fontsize=13);
plotTitle = f'Named Tropical / Subtropical Cyclones, Atlantic Basin, {year}'
ax.set_title (plotTitle);
fig.savefig (f'AtlTCs{year}.png')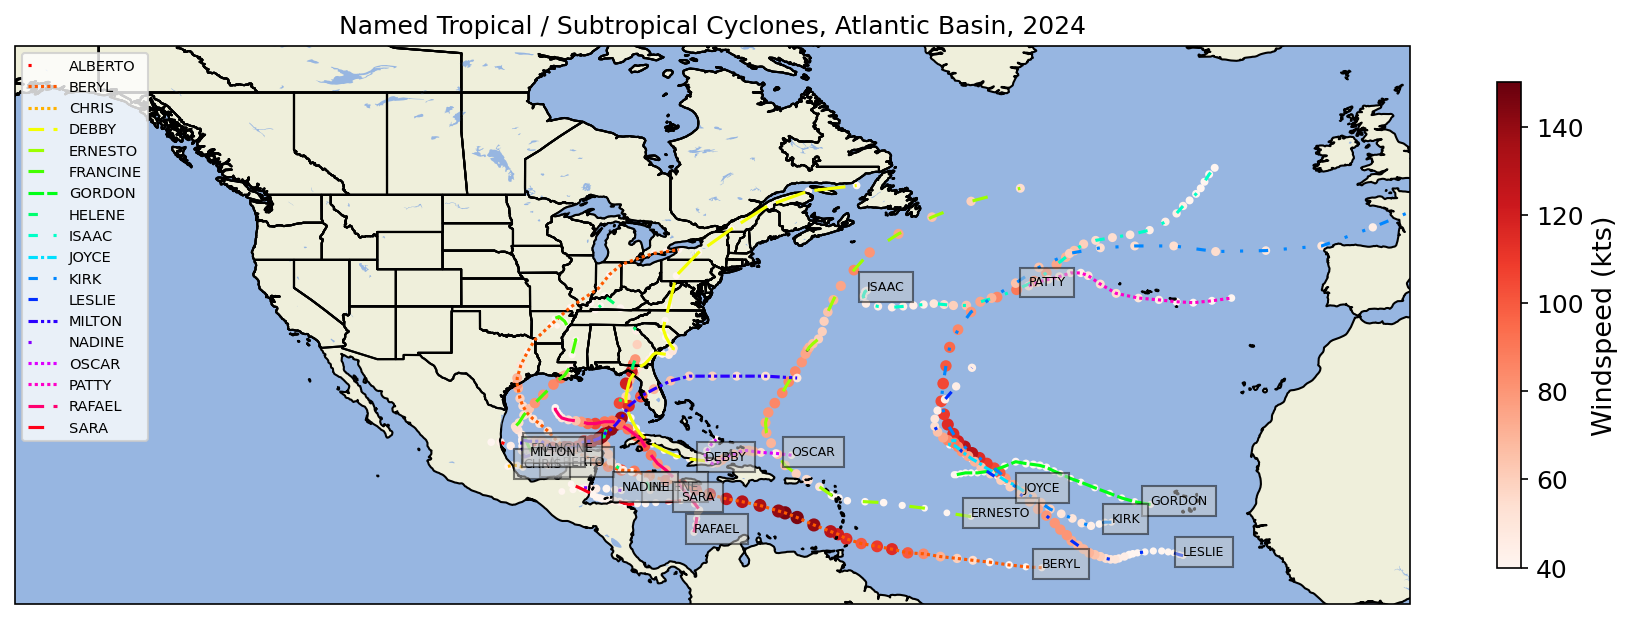
Create another map, this time centered over a smaller region.
regLonW, regLonE, regLatS, regLatN = (-95, -50, 5, 45)# Use medium-scale cartographic features
res = '50m'
fig = plt.figure(figsize=(15,12), dpi=150)
ax = plt.subplot(1,1,1, projection=plot_crs)
ax.set_extent([regLonW, regLonE, regLatS, regLatN], data_crs)
ax.set_facecolor(cfeature.COLORS['water'])
ax.add_feature (cfeature.STATES.with_scale(res))
ax.add_feature (cfeature.LAND.with_scale(res))
ax.add_feature (cfeature.COASTLINE.with_scale(res))
ax.add_feature (cfeature.LAKES.with_scale(res))
ax.add_feature (cfeature.STATES.with_scale(res))
# Loop over each storm
for idx, storm_name in enumerate(dfYearNamed.index.unique()):
storm_data = dfYearNamed[dfYearNamed.index == storm_name]
track_len = len(storm_data)
ax.plot(storm_data['Lon'], storm_data['Lat'], transform=data_crs,
label=storm_name,c=colors[idx],linestyle=linestyles[idx][1])
s = ax.scatter(storm_data['Lon'], storm_data['Lat'], transform=data_crs, c=storm_data['Max_Speed'],
vmin=40, vmax=150, s=storm_data['Max_Speed']/5, cmap='Reds')
# Get the coordinates of the first point in each storm's track, to be used for labeling
lon0, lat0 = storm_data['Lon'].iloc[0], storm_data['Lat'].iloc[0]
# Ensure that we only plot the text box if the coordinates are within the regional extent
if (regLonW < lon0 < regLonE and regLatS < lat0 < regLatN):
ax.text(lon0, lat0, s=storm_name,fontdict=dict(color='black', size=6), bbox=dict(facecolor='#CCCCCC', alpha=0.5))
ax.legend(loc='upper left', fontsize=7)
# Once out of the loop, create and label a colorbar, set the title, and save the figure.
cbar = plt.colorbar(s,shrink=0.55)
cbar.ax.tick_params(labelsize=12)
cbar.ax.set_ylabel("Windspeed (kts)",fontsize=13);
plotTitle = f'Named Tropical / Subtropical Cyclones, Atlantic Basin (Regional subset) {year}'
ax.set_title (plotTitle);
fig.savefig (f'AtlTCs{year}Regional.png')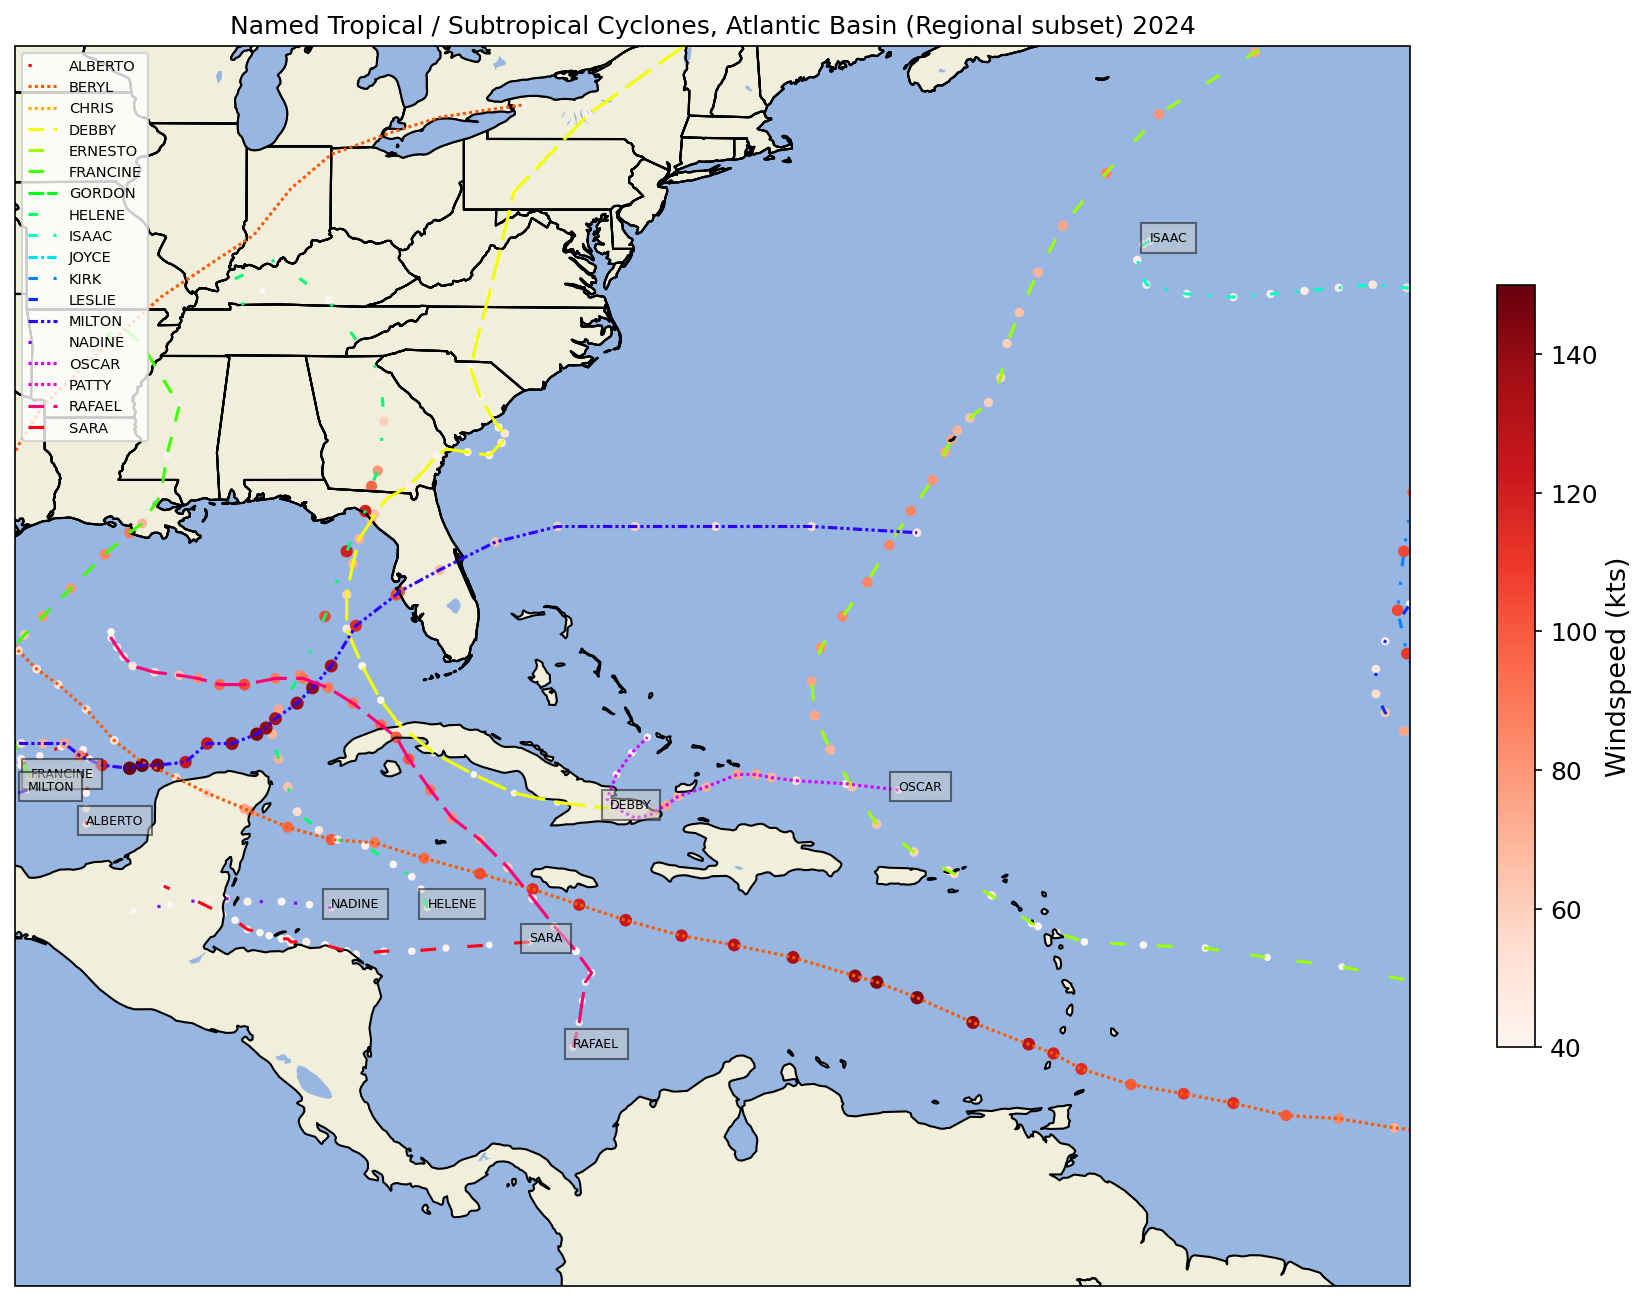
Summary
We’ve done a lot of tweaking to produce a fairly self-explanatory tropical cyclone tracking chart ... but as always there’s room to further improve!
Things to try
- Choose a different year and generate its corresponding track map
- Revise the look of the track map; consider adding text labels such TC symbols, central pressures, and time/date stamps.
- Output a different named storm to a CSV file; then copy the
Helene.ipynbnotebook and generate a similar set of figures for the storm you chose. - Search for and download one of the other HURDAT/Best track archives available from NHC or other sources; try, for example, to create a tracking chart for another ocean basin.
- Instead of a tropical storm, seek out a different trackable, time-stamped feature and generate plots similar to those above (or create your own unique visualizations!).