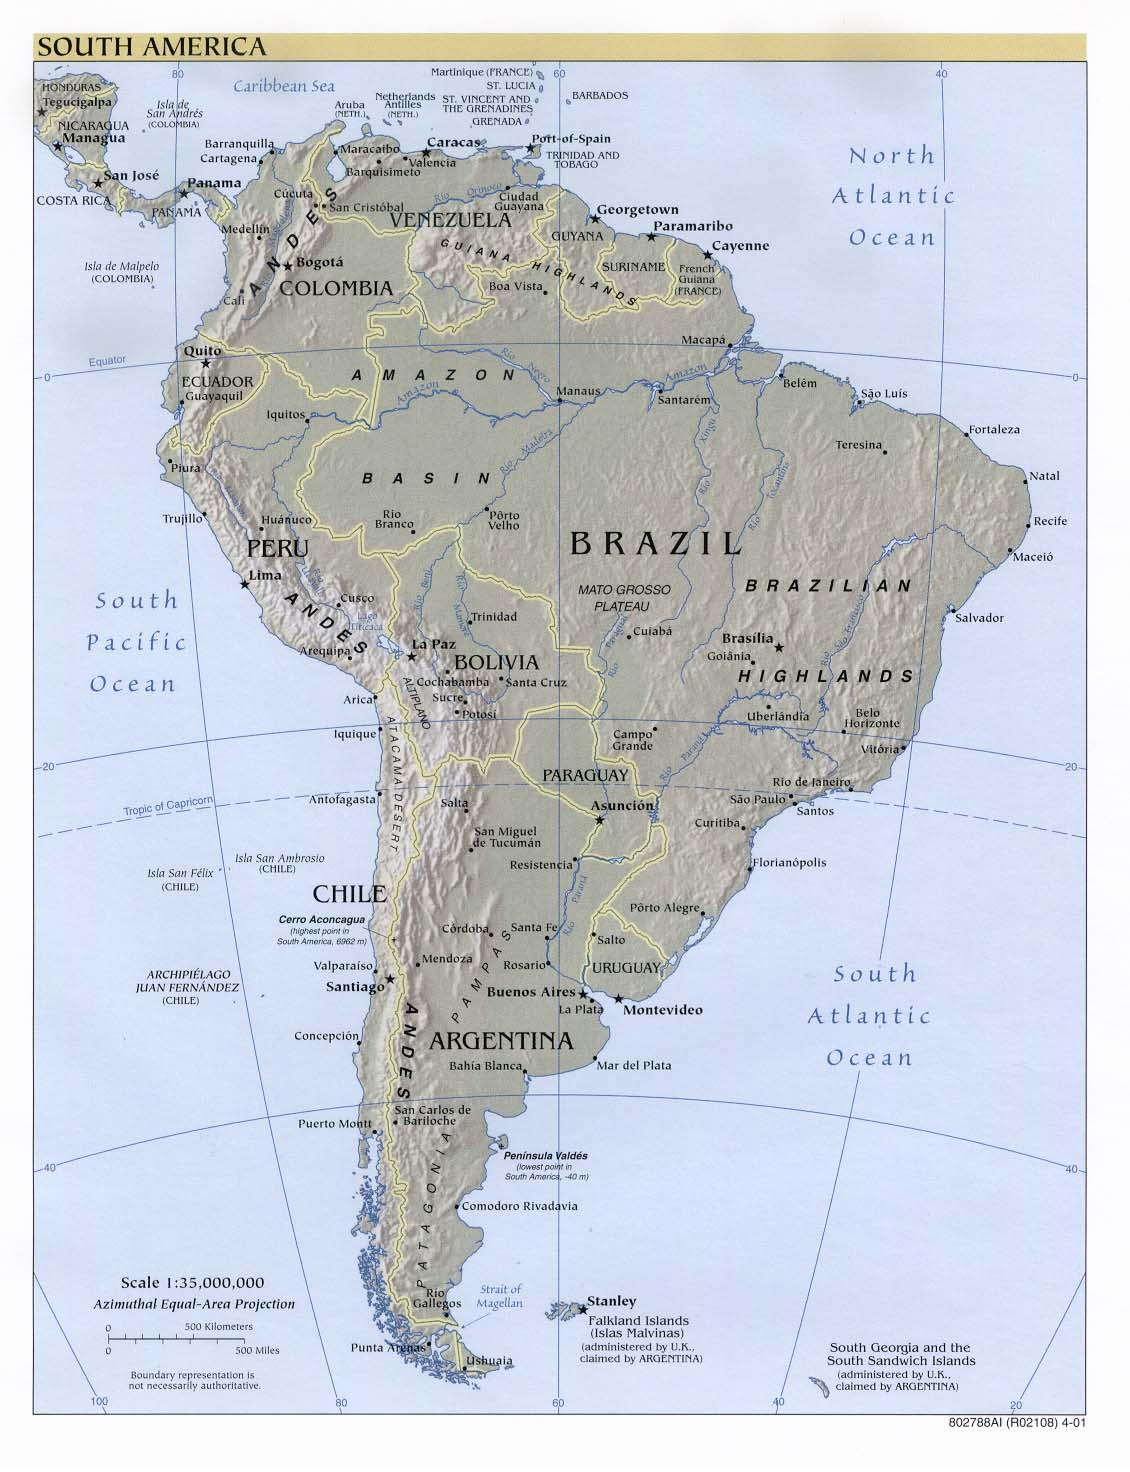
To investigate South American cold air
outbreaks, time series of 00Z 925-mb temperature at eight different South American locations
were computed from the ECMWF ERA-40 dataset for the period
A large
map of
The top
20 coldest dates at 0°, 75°W (defined by the 00Z 925-mb temperature) are listed
in this
table.
1.
Temporal Distribution
The
monthly distribution of cold air outbreaks (defined as the top 100 coldest
925-mb temperatures at 00Z) for the eight different South American locations
can be accessed in the table below.
Monthly
Distribution of Cold Air Outbreaks
2.
Case Study of a Summertime Cold Air Outbreak
Click here
for a look at the 21 December 1980 cold air outbreak that occurred at 15°S,
65°W (see 15°S,
65°W histogram).
3.
Stability Distribution
The
distribution of 925–700-mb temperature differences during cold air outbreaks
(same definition as above) for the eight South American locations can be
accessed below.
(Note: The dry-adiabatic 925–700-mb temperature
difference is 21°C.)
Distribution of 925–700-mb Temperature
Differences
For Top 100 Cold Air Outbreaks
The 20 most
and least stable cold air outbreaks (defined as the most and least negative
925–700-mb temperature differences, respectively, associated with top cold air
outbreaks) for different South American locations are listed below.
20 Most Stable Cold Air Outbreaks (out
of 100)
20 Least Stable Cold Air Outbreaks (out
of 100)
4.
Summary Charts
Some statistical summary charts for the eight South
American locations can be found below:
Sea level
pressure: Mean and median Standard deviation
925-mb
temperature: Mean and median Standard deviation
925–700-mb
temperature difference: Mean and median Standard deviation