All attachments: http://www.atmos.albany.edu/student/heathera/mapdisc_08-31-07/
Hi Folks,
Friday map
discussion resumed for the new 2007-08 academic year on
0000 UTC 10Aug:
Massive ridge
overlies the central and eastern US. Deep easterly shear is present to the
south of the ridge over the
0000 UTC 13Aug:
Aforementioned
PV anomaly moved westward across southern FL and is now located west of Key
West, FL, where it is interacting with low-level vorticity that will eventually
become TS Erin near the southern coast of western Cuba. Cyclonic deep-layer shear indicates that the
PV anomaly is cold core (weak anticyclonic shear prevails over the low-level
vorticity maximum, however).Increase in wind speeds to at buoy 44004
0000 UTC 16Aug:
TS Erin,
embedded in anticyclonic deep-layer shear (850 hPa-DT),
is approaching the south coast of
Anew PV anomaly
that will interact with TC Dean is in the process of forming northeast of the
0000 UTC 19Aug:
The low-level
vorticity maximum that nicely defines TS Erin (very much alive and kicking over
OK and almost better defined than at landfall over TX) can be seen near 35 N
and 100 W. it still has a warm-core structure based on the deep-layer anticyclonic
shear indicated over the low-level vorticity maximum. The PV anomaly that
originally helped to spark the development of the low-level vorticity maximum
that became
The PV anomaly
over the eastern Gulf of Mexico to the northwest of Cuba (it was in the process
of forming 72 h earlier northeast of the Bahamas) is retreating westward in
response to ridging on the poleward side of strengthening TC Dean to the south
of Hispaniola.
0000 UTC 22Aug:
Remnant
low-level vorticity from
The PV anomaly
(cutoff cyclone) being "chased" to the NW by TC Dean is now located
over northern
0000 UTC 24Aug:
Dean low-level
vorticity remnant is getting its "second wind" along the west coast
of
0000 UTC 27Aug:
Dean low-level
vorticity maximum moves NNW over the
KPHX 251151Z09006KT 10SM VCTS BKN090CB OVC130 29/18 A2989 RMK
15027/1116 TSB07
SLP100 FRQ LTGCGIC VCVCTS MOV NW T02890178 10322 20283 53019=
KPHX 251251ZVRB05KT 5SM VCTS +RA FEW027 BKN090CB OVC130 27/19
A2993 RMK AO2
RAB03E18B40 SLP115 FRQ
LTGCGIC OHD ANDVC VCTS SE MOV W CB DSNT SE-SW-W P0012 T02670194=
KPHX 251351Z20011KT 10SM TSRA FEW070 BKN095CB OVC130 25/23
A2995 RMK AO2
SLP122 FRQ LTGCGIC OHD
AND VC TSOHD-SE-SW-W MOV W VIS LWR
KPHX 251451Z00000KT 10SM -TSRA SCT060 BKN095CB OVC120 24/24
A2997 RMK AO2
SLP129 FRQ LTGCGIC OHD
AND VC TS NW-NMOV NW P0007 60024 T02440239 51027=
KLAS 270556Z05003KT 10SM BKN140 BKN200 32/14 A2978 RMK AO2
SLP053 T03170139 10339 20311
51016 $=
KLAS 270656Z10009KT 10SM BKN095 BKN140 32/14 A2980 RMK AO2
SLP060 BKN095 V SCT T03170144
$=
KLAS 270751Z05015G22KT 10SM VCTS -RA BKN095CB BKN140 31/12
A2980 RMK AO2 TSB51RAB51 OCNLLTGCG
$=
KLAS 270756Z06016G22KT 10SM VCTS -RA BKN095CB BKN140 30/13
A2980 RMK AO2 TSB51RAB51
SLP060 OCNL LTGCG VC
E-SE VCTS
KLAS 270803Z05015G22KT 10SM -TSRA FEW024 OVC090CB 29/16 A2981
RMK AO2 OCNL LTGCGCA E-S TSE-S AND OHD P0000 $=
KLAS 270756Z06016G22KT 10SM VCTS -RA BKN095CB BKN140 30/13
A2980=
KLAS 270856Z04012KT 10SM -TSRA FEW022 BKN041 BKN095CB 27/17
A2981 RMK AO2 SLP064 FRQ
LTGCGCA NE-S TS NE-S
AND OHD MOV
KLAS 270915ZVRB05G15KT 5SM +TSRA FEW044 BKN085CB BKN110 25/17
A2986 RMK AO2 PRESRR
E-S 1 1/2 CONS
LTGCGCA OHD AND
KLAS 270956Z03006KT 3SM TSRA BKN023 BKN043 OVC090CB 24/18
A2984 RMK AO2 SLP078
CONS LTGCGCA S-NW TS
NW-NE MOV
KLAS 271022Z32009KT 9SM -TSRA FEW012 BKN032 OVC110CB 23/19
A2983 RMK AO2
KLAS 271032Z04004KT 10SM VCTS FEW012 BKN032 OVC110CB 23/18
A2983 RMK AO2 RAE22 CONS
LTGCGCA VC SW-N VCTS
KLAS 271056Z28009KT 10SM VCTS -RA SCT090CB SCT120 BKN180
23/19 A2985 RMK AO2 SLP082
RAE22B50 CONS LTGCGCA
VC S-N VCTS
KLAS 271156ZCOR 32005KT 10SM VCTS SCT085CB BKN120 23/18 A2984
RMK AO2 RAE01 SLP079 FRQLTGCGCA VC SW-N OCNL LTGCG DSNT
1200 UTC 27Aug:
Remnant PV
anomaly has moved eastward to northern AZ and southern UT. Ridging ahead of it
has reached the western
ANE-SW oriented
PV tail is crossing
1200 UTC 28Aug:
Remnant PV
anomaly moves eastward and weakens. It is probably a stretch to stay that a
figment of the PV anomaly (and/or my imagination) is located near 39 B and 95 W.
PV tail that
had crossed
1200 UTC 29Aug:
The second PV
tail across
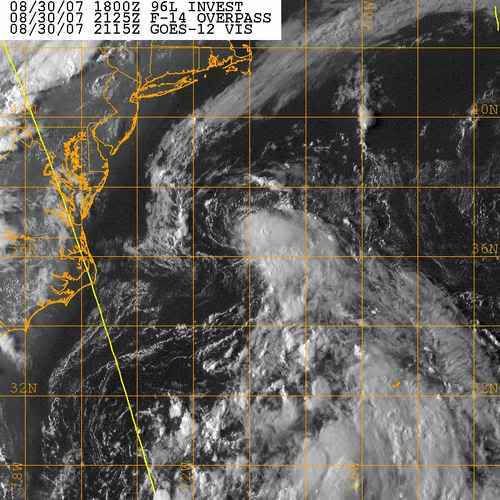
1200 UTC 30Aug:
PV maximum
(manifest by higher pressure) that formed by fracture from the western end of
the aforementioned PV tail is now embedded in anticyclonic deep-layer shear
near 35 N and 70 W. Visible imagery for 1200 UTC 30 Aug provided by Zach Brown in
a post with lots of good links to the tropical storms listserv (see below)shows
an exposed low-level circulation center near 37 N and 70 W with deep convection
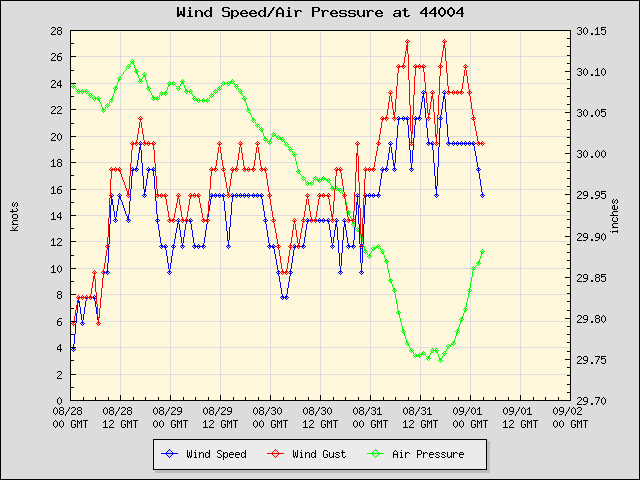
to the SE. Steadily falling sea level pressure at this time seen in the
attached meteogram from buoy 44004 near 38.5 Na and 70.4 W (NCDC buoy link is
given below) is indicative of a developing system.
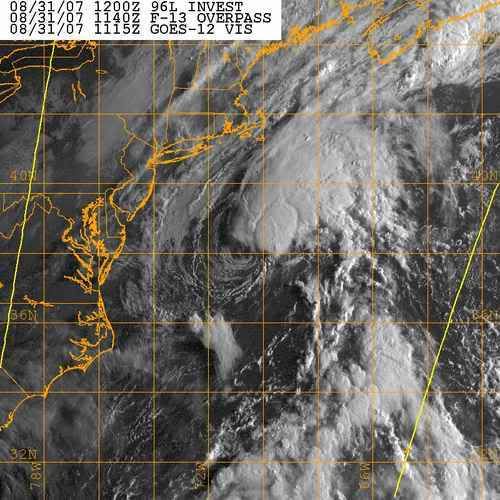
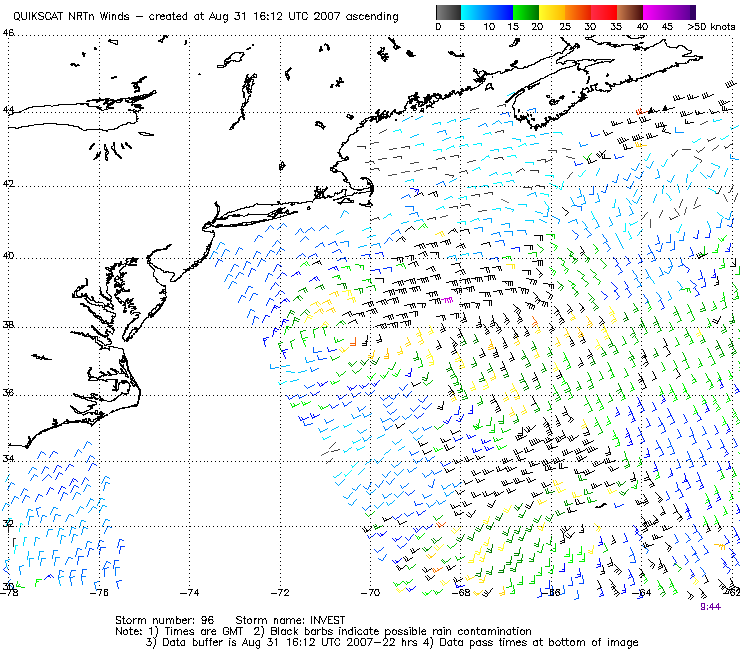
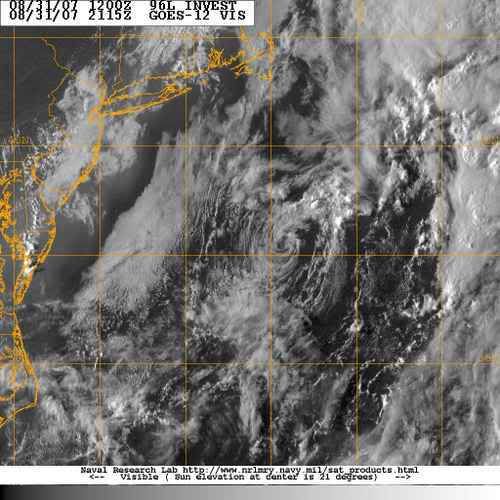
1200 UTC 31Aug:
A visible
satellite image for this time from Zach's link shows a nice low-level but
partially exposed circulation center near 38 N and 71 W with deep convection
downshear to the NE. System looks like a weak TS. Increasing shear ahead of a
deepening upper-level trough seen over the Great Lakes 24 h earlier completely
exposes the low-level center by 2115 UTC as the strongest winds shift to the
northeast quadrant of the storm (see attached 1612 UTC QuikScat
image from Zach). I agree with Zach's inference that a post-season reanalysis might
upgrade the East Coast system to a minimal TS.
Research Issues:
1. Document to what extent was the initial growth of
low-level vorticity just to the south of western
2. Understand why
3. Determine what
caused
4. Investigate to what
extent tropical moisture associated with
5. Decipher the
relationship between TC Dean and the cold-core cutoff upper-level cyclone (PV
anomaly) that remained to the NW of Dean
6. Document the linkage between the poleward flux of tropical
moisture from the remnants of Dean up the
7. Establish to what extent ridging over the Great Lakes on
28-29 Aug may have been an indirect result of the northeastward flux of heat
and tropical moisture ahead of the remnant upper-level cold-core system that
crossed the coast of southern CA near 0000 UTC 27 Aug and whether the likely
associated downstream troughing over New England
could have contributed to a possible weak (unnamed) TS development off the Midatlantic coast on 30-31 Aug.
Lance
To:tropical-storms@tstorms.org
Date: Sat,
From:hurricanewarn1@aol.com
Subject:[Tropical-storms] 96L, A
Possible Candidate For A Post Season Upgrade
Hey all,
An interesting low pressure system paralleled the eastern
seaboard of the
Interesting over the past day. This low maintained a well defined
surface circulation with organized convection from part of Thursday
and into part of Friday, as can be seen
in these 2 visible satellite images.
http://i44.photobucket.com/albums/f34/abunter/96-4.jpg
http://i44.photobucket.com/albums/f34/abunter/96-5.jpg
I couldn't find a QUIKSCAT pass during the peak of the system
unfortunately but, a pass as the system was losing convection revealed winds of
40 kt in the NE quadrant. I would suspect winds were
higher during the peak organization of the system, and solidly minimal-moderate
tropical storm force. Below is the QUIKSCAT pass and a
visible satellite image of the system decaying into a tight swirl.
http://i44.photobucket.com/albums/f34/abunter/96-3.png
http://i44.photobucket.com/albums/f34/abunter/96-6.jpg
Also of note, 96L passed near Buoy 44004 while it was a tight
swirl (well after the storm's peak), and a wind surge of up to 22 kt with a pressure drop down to1007 mb
was observed.
http://i44.photobucket.com/albums/f34/abunter/96-1.png
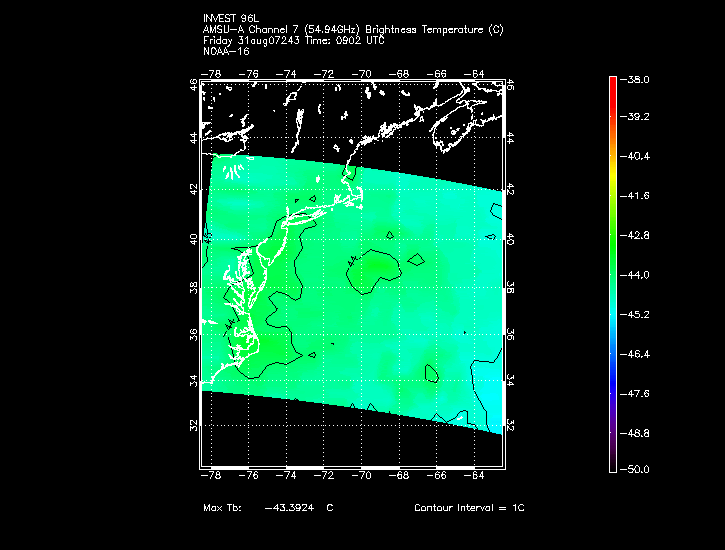
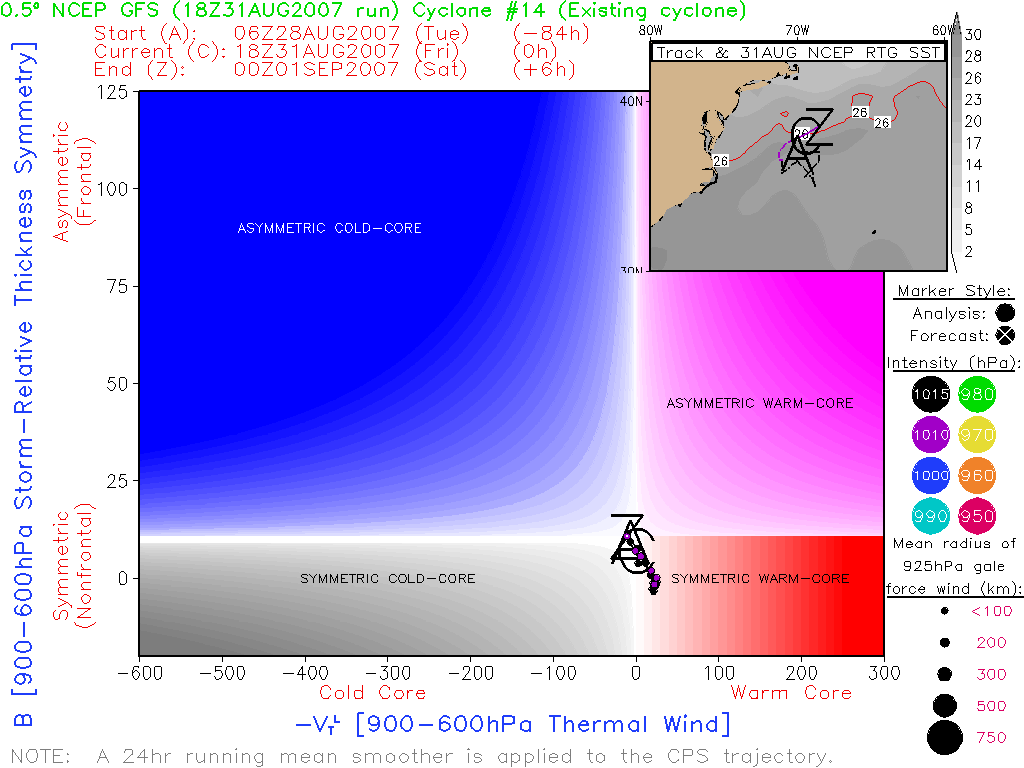
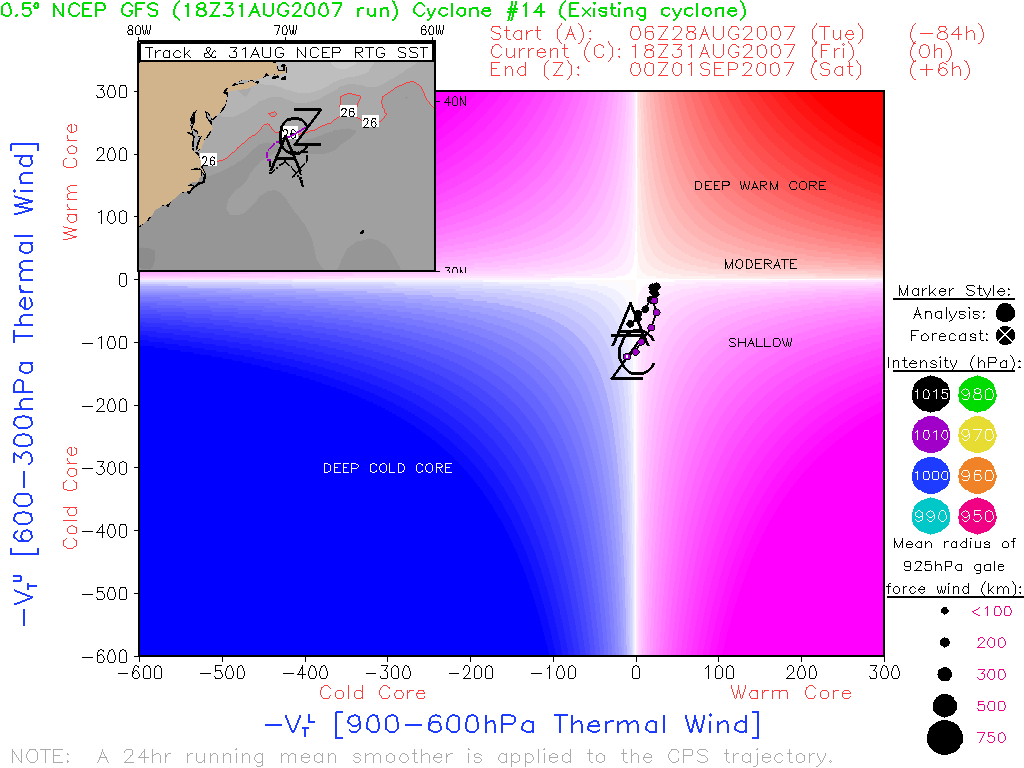
As for the thermodynamic structure of the system, here’s some
AMSU and FSU phase analysis charts. It looks warm core to me.
AMSU:
http://i44.photobucket.com/albums/f34/abunter/96-11.gif
http://i44.photobucket.com/albums/f34/abunter/96-10.gif
FSU phase analysis
http://i44.photobucket.com/albums/f34/abunter/96-8.png
http://i44.photobucket.com/albums/f34/abunter/96-9.png
Overall, a fairly intriguing system,
one that should be considered for an upgrade to a tropical storm after the season. It reminds me a lot of the unnamed
tropical storm last year off of
Sincerely,
Zach Brown
..............................................................
http://www.atmos.albany.edu/facstaff/rmctc/DTmaps/animSelect.php
(RonMcTaggart-Cowan's GFS animation
builder)
Buoy 44004(Hotel): 38.5 N and 70.4 W
http://maps.csc.noaa.gov/hurricanes/
Then "make
tracks" to the "query storm track" sublink
and you will have full access to plotting capability for historical