Map:
The focus
of the
during
the first week of September, (2) the possibility of severe weather from the
Great Lakes southwestward to the Oklahoma/Texas Panhandle on Friday evening,
and
(3) the
evolution and life-cycle of soon-to-be Tropical Storm Gabrielle from a synoptic
perspective. This particular synopsis
email will be limited to a summary
of
(3). A future map discussion will cover
the summer climate summary [which will encompass (1)].
In the
first part of the discussion below, I will describe the evolution of the
synoptic features associated with the development of Gabrielle. In the second part, Heather Archambault will
describe the model performance during this event.
Part I:
To aid in
the discussion of the key synoptic features associated with Gabrielle (part I),
a powerpoint file has been made available for
download at my home page
[http://www.atmos.albany.edu/student/tomjr/gabrielle_synop.ppt]. The dynamic tropopause and 850 hPa potential
temperature maps were obtained from Ron
McTaggart-Cowan's
GFS analysis animations page [http://www.atmos.albany.edu/facstaff/rmctc/DTmaps/animSelect.php]. The GOES-12 satellite imagery were obtained
from NCDC's GIBBS archive page [http://www.ncdc.noaa.gov/oa/rsad/gibbs/gibbs.html],
while the 1-km res visible imagery were obtained from
the CIMSS Tropical Cyclones page [http://cimss.ssec.wisc.edu/tropic2/].
At 0000
UTC 1 September (00Z/01), a trough on the DT was passing through the northeast
US. This trough had a PV tail trailing toward
the southwest to over the
southern
Plains (Slide 1). Ahead of this eastward
moving trough, a surface baroclinic zone was in place from just off the
the Gulf
coast (Slide 2). Although the thermal
gradient across the portion of the surface boundary along the Gulf coast, there
are several regions of low-level
cyclonic
vorticity indicating the presence of a cyclonic wind shift (compare slides 1
and 2). By 00Z/02, a region of cyclonic
low-level vorticity associated with
the
remnant baroclinic zone has remained intact over southern GA and extreme
northern FL. Concurrently, the
upper-level trough over the northeast at 00Z/01 has
moved
eastward to near 65W on 00Z/02, while the southwest part of this trough
remained over the southern Plains...resulting in PV tail (or streamer) thinning
(slide
3). By 00Z/03, the low-level vorticity
feature over the southeast US began slowly drifting eastward toward the GA
coast (slide 4).
At 00Z/04
the upper-level PV tail broke down into sections via continued PV tail thinning
(slide 5). The low-level cyclonic
vorticity structure along the
southeast
12Z/05,
the low-level cyclonic vorticity center was located near 30N, 71W just east of
an upper-level disturbance (formerly part of the initial PV tail). Also
noteworthy
is another upper-level trough that is moving southwestward over the northeast
US and eastern
and
absorbed the upper-level disturbance that was just west of the low-level
cyclonic vorticity feature by 00Z/06 (slide 7).
As this merger of upper-level
disturbances
occurred, the low-level cyclonic vorticity intensified (compare slides 5-7)
possibly reflecting the models interpretation of increased convective
activity
(not shown).
With the
approach of the second upper-level trough by 12Z/06, the low-level vorticity
center became more elongated in a northeast-to-southwest fashion in response
to
increased deep-layer shear (slide 8).
The corresponding satellite image showed an elongated region of
cloudiness ahead of trough #2. There
seems to be a lack
of
organized convection associated with the low-level vorticity center near 29N,
70W perhaps indicating the effects of the trough just to the west and north.
By 00Z
and 12Z/07, however, trough #2 slides off to the east leaving behind the
low-level vorticity center that will soon develop into Gabrielle. As trough #2
moved off
to the east, the deep-layer shear over the low-level vorticity center decreased
from 35-40 knots at 00Z/07 to near 20-25 knots by 12Z/07 (slides 9-10).
At this
time, deep moist convection began to reform over the low-level vorticity
center...perhaps in response to decreased shear (slide 10). At 00Z/08, the
low-level
vorticity center became more symmetric as the convection continued to percolate
(slide 11). NHC officially named the
low-level vorticity center
Gabrielle
at this time.
During
the period 00Z/08 through 00Z/09, Gabrielle moved toward the northwest reaching
the
occurred
because of the southeasterly shear that developed over Gabrielle in response to
the juxtaposition of a diabatically produced ridge just north of Gabrielle
and the
cyclonic upper-level disturbance (the southwest end of the PV tail associated
with trough #2) just southwest of Gabrielle (slides 11-13).
By
06Z/09, Gabrielle was positioned along the
northeasterly
shear was manifest by the approach of a shortwave ridge from the west and the
persistence of an upper-level cyclonic disturbance over and east of FL
(slide
14). The shear, which strengthened to
near 35 knots over Gabrielle (slide 14), resulted in the low-level center
appearing from beneath a region of deep
moist
convection by 17Z/09 (slide 15).
Finishing
up...during 12Z/09-00Z/10 Gabrielle slowly drifted northward along the North
Carolina and Virginia coast (slides 16-18) and began to recurve
out to sea
after
00Z/10 (slide 19) in response to the approach of the next midlatitude system
(represented by the blue dotted line and associated low-level vorticity on
slide
18...low-level
map not shown).
Follow-up
questions/comments/ramblings:
1. One
may ask whether the incipient low-level cyclonic vorticity feature that was
tracked from over the southeast US at 00ZZ/02 to "TC-genesis" time at
00Z/08 was
a
coherent feature or just model analysis hash.
Although the strength of the vorticity maximum itself is probably
untrustworthy, I think there is some validity to
the
analysis of the low-level structure since it showed continuity.
2. Was
the upper-level disturbance (that originated from the initial PV tail at
00Z/01) near 30N, 75W at 12Z/05 important in maintaining the low-level cyclonic
vorticity
structure by keeping the convection percolating?
3. Was
the PV tail associated with trough #2 important in the organization and
subsequent northwestward movement of Gabrielle?
Did it initially help
trigger/organize
convection near the pre-Gabrielle low-level disturbance, then become
inconsequential as diabatic ridging aloft eroded the PV tail and reduced the
deep-layer
shear?
4. This
evolution seems to be a tropical transition-type of TC-genesis.
Cheers,
Tom
*********************
Part II:
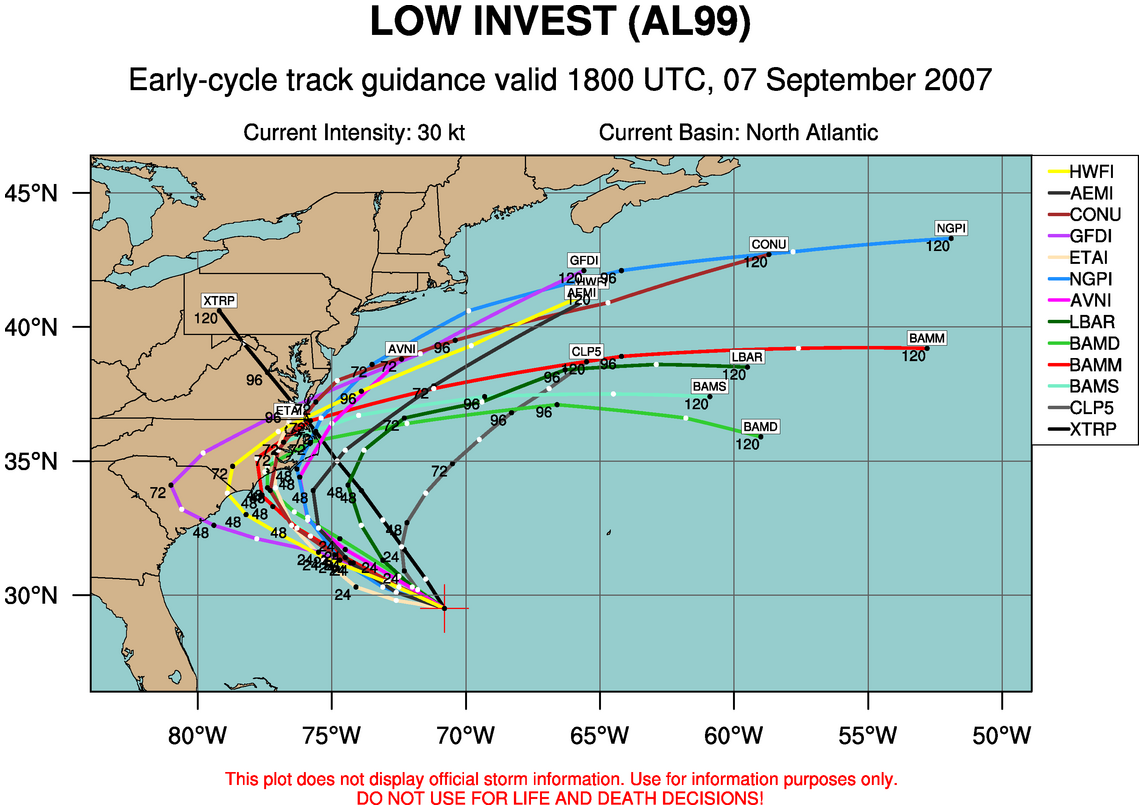
During
map discussion, we noted that the most recently available (1800 UTC 7 Sep)
early-cycle model forecast tracks
(http://www.atmos.albany.edu/student/heathera/gabrielle/aal99_2007090718_track_early.png)
of then-tropical disturbance Gabrielle indicated a fairly large degree of track
uncertainty. A few models were
forecasting a more north-northwest track, and recurvature offshore, and two of
the models had a west-northwest track, bringing the system onshore along the
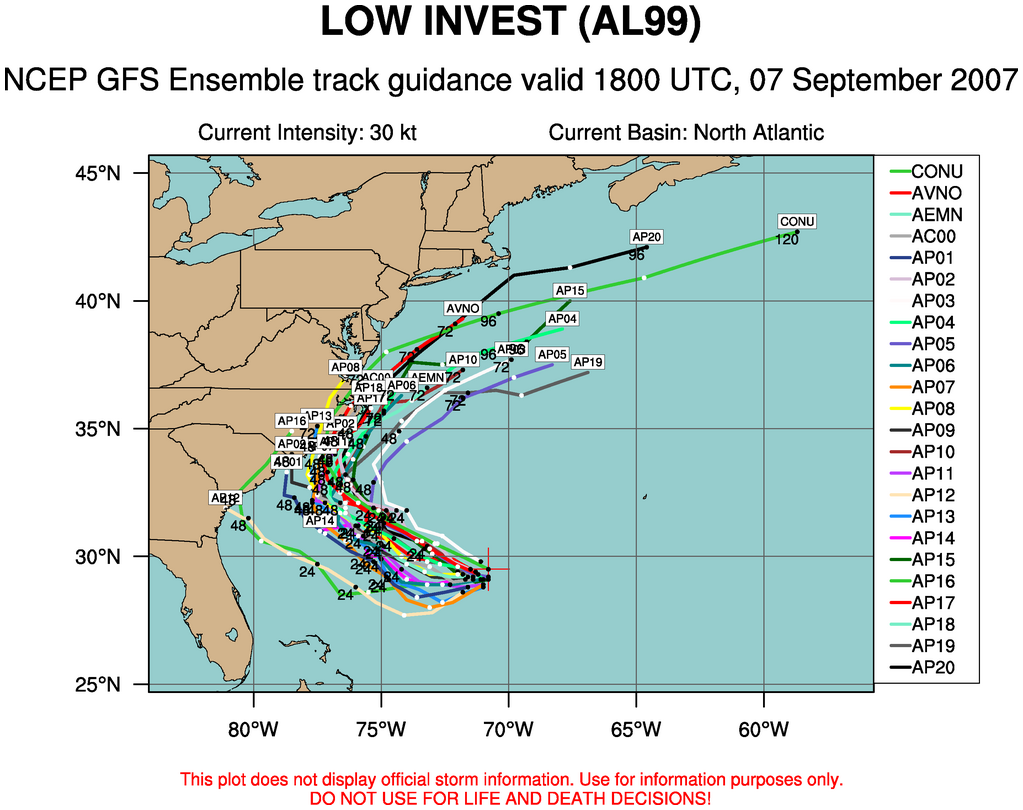
(http://www.atmos.albany.edu/student/heathera/gabrielle/aal99_2007090718_track_gfs.png)
showed a similar spread, with the ensemble consensus taking the storm near or
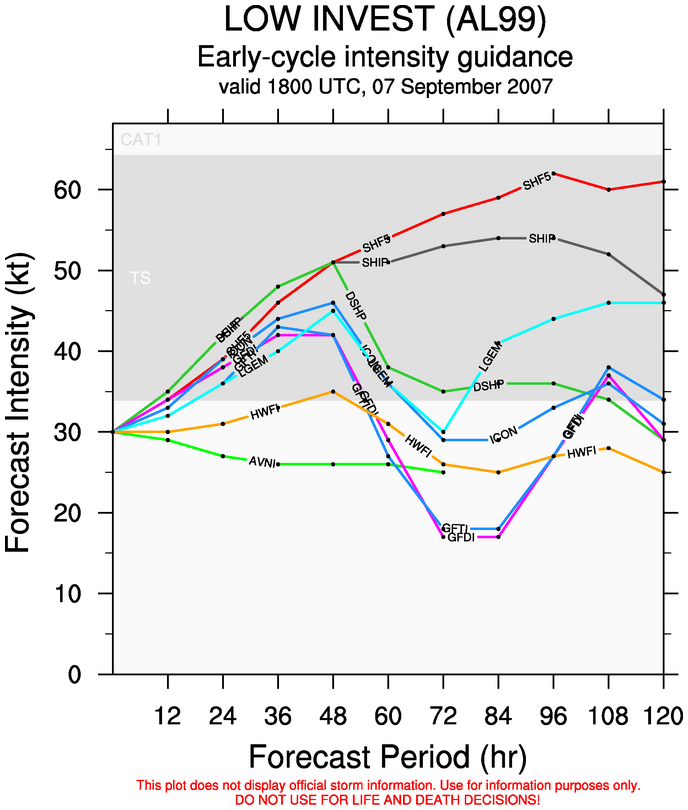
over the Outer Banks of North Carolina coast between 48 and 72h. The consensus of the model forecast
intensities from 1800 UTC 7 Sep
(http://www.atmos.albany.edu/student/heathera/gabrielle/aal99_2007090718_intensity_early.png)
suggested that the system would undergo slow strengthening to a minimal or
moderate tropical storm over the next 60 h.
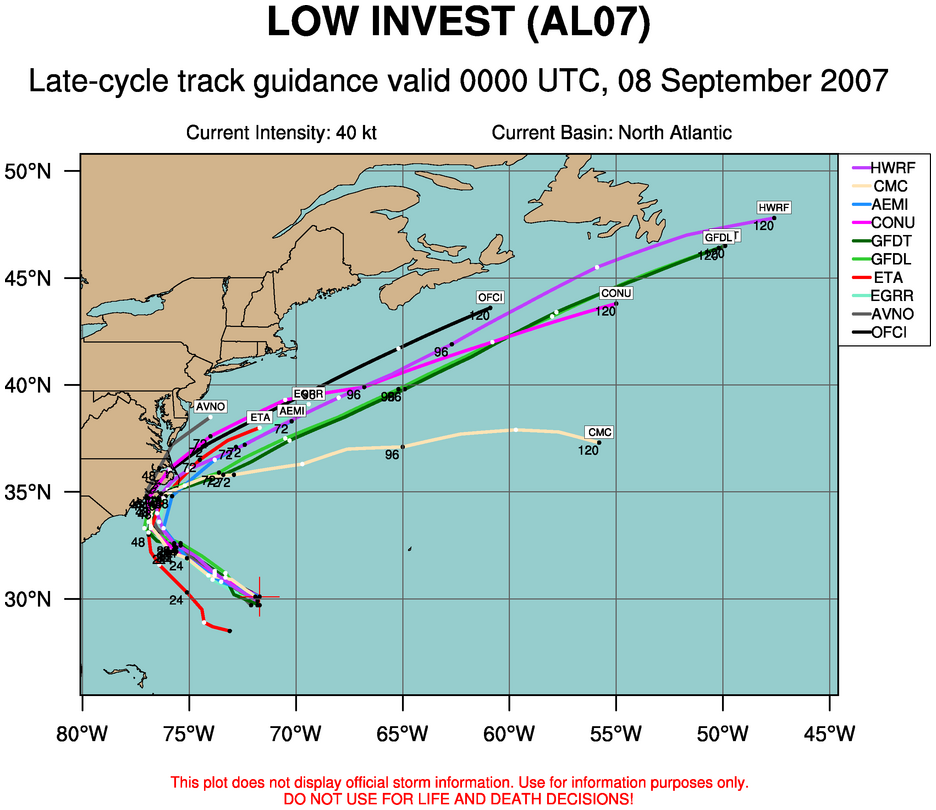
The 0000
UTC 8 Sep run of the GFS ensembles showed a similar spread and consensus as the
1800 UTC, but the 0000 UTC 8 Sep late-cycle model forecast tracks
(http://www.atmos.albany.edu/student/heathera/gabrielle/aal07_2007090800_track_late.png)
indicated reduced uncertainty compared to the 1800 UTC 7 Sep early-cycle
tracks,
with all models bringing Gabrielle onshore or very nearly onshore on the Outer
Banks shortly after 0000 UTC on 10 Sep.
This reduction in model uncertainty
presumably
was related to a reduction in the uncertainty of the future movement of the
western
The first
official track forecast issued for Gabrielle by the National Hurricane Center
(NHC) (http://www.atmos.albany.edu/student/heathera/gabrielle/nhc_forecast_track_9-8_0300UTC.GIF),
released at 0300 UTC 8 Sep when the system was first designated a
subtropical
storm, was very close to the consensus of the different models and the GFS
ensemble members. The NHC intensity
forecast had Gabrielle making landfall
as a
tropical storm with max winds of 50 kt.
According
to the NHC, Gabrielle ultimately made landfall over the NC Outer Banks at 1545
UTC on 9 Sep at it was undergoing recurvature. Gabrielle's track (see
http://www.atmos.albany.edu/student/heathera/gabrielle/Gabrielle_obs_track.gif)
was very close to the first NHC forecast (although landfall was a few hours
earlier than forecast), the consensus of the models, and the consensus of the
GFS ensemble. According to the NHC,
Gabrielle's intensity at landfall was close to 50 kts, meaning that the first
intensity forecast issued by the NHC was also very close to reality.
Overall,
the official track and intensity forecasts issued for TS Gabrielle by the NHC
were excellent, despite the considerable spread in the model forecast track fewer
than 48 h prior to landfall.
Cheers,
Heather
Hello
all,
In the
section of the map discussion regarding the forecasting of
TS
Gabrielle, I neglected to cite the websites from which the images were
originally
taken. Details follow below.
Heather
Plot of
Gabrielle's track: Navy/NRL Tropical Cyclone Page,
http://www.nrlmry.navy.mil/tc_pages/tc_home.html
Plots of
Gabrielle model forecast tracks and intensities: Jonathan Vigh's
Tropical Cyclone Model Guidance Page,
http://euler.atmos.albany.edu/~vigh/guidance/index.htm
Plots of NHC's Gabrielle track forecast (and other archived
information on this system):