Current Status: Operational
Move cursor over map to select satellite imagery animations
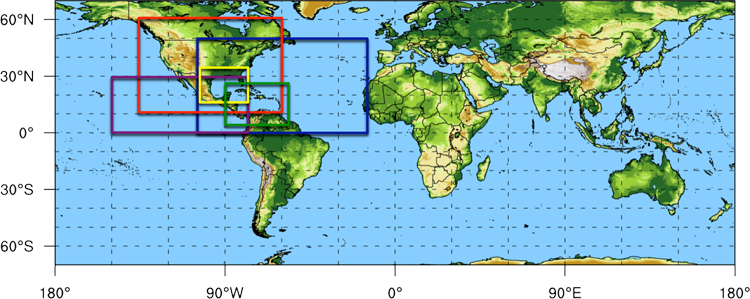
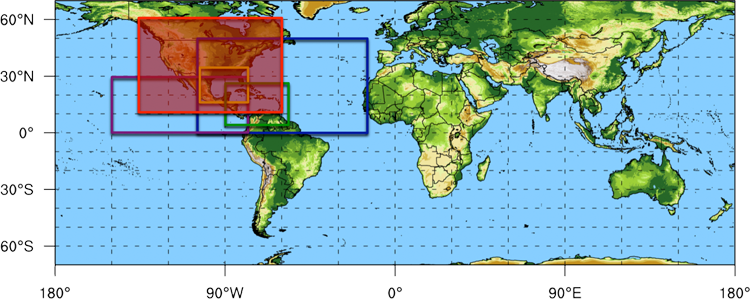
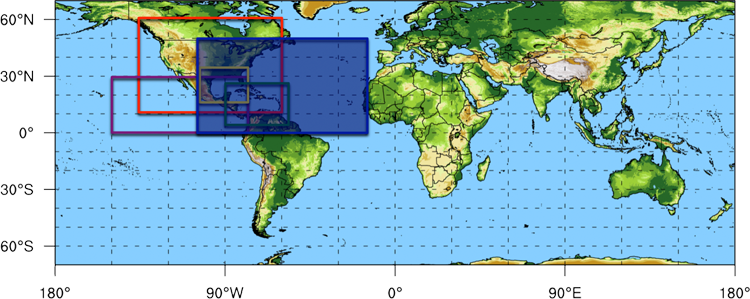
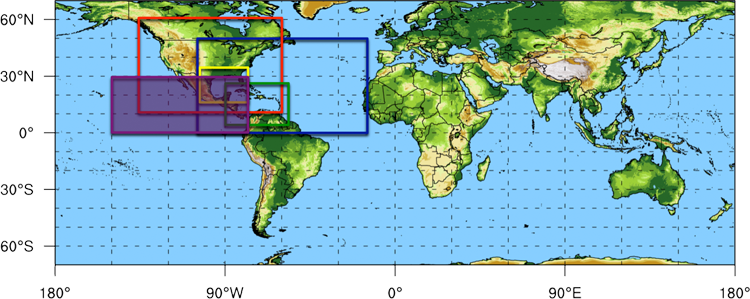
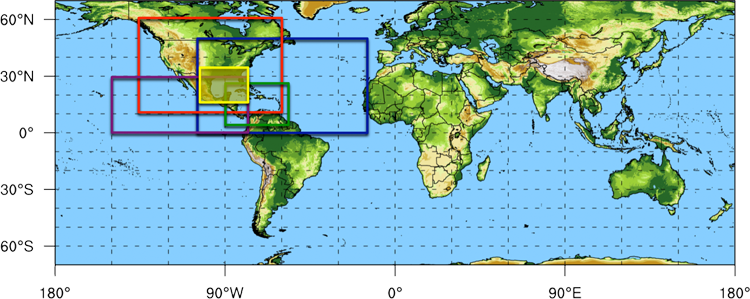
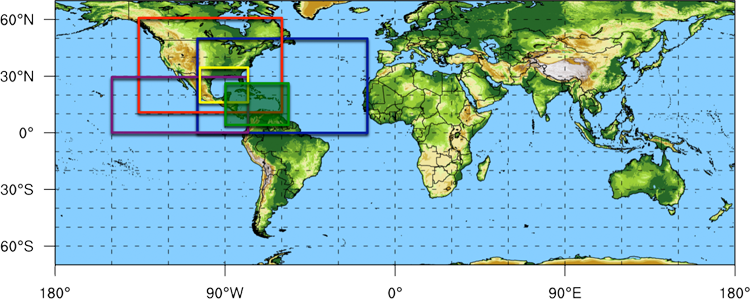
|
- North Atlantic
- Decade
- 1980's
- 1990's
- 2000's
- North America
- Decade
- 1980's
- 1990's
- 2000's
- Northeast Pacific
- Decade
- 1980's
- 1990's
- 2000's
- Gulf of Mexico
- Decade
- 1980's
- 1990's
- 2000's
- Caribbean Sea
- Decade
- 1980's
- 1990's
- 2000's
The above grid boxes are populated with GridSat-B1 satellite data from 1980-2009 in monthly animated loops.
The dataset is obtained from the National Climatic Data Center.
For more information on the dataset, please see the BAMS article on the creation and potential uses of GridSat.
NCAR command language was used to create the images.
Below is a diagram that shows areas that received GridSat coverage from 1980-2009. Note that there are extensive periods of missing data that will also be missing
in the animations above. Use this as a guide to pick what months will be most useful in observing imagery.
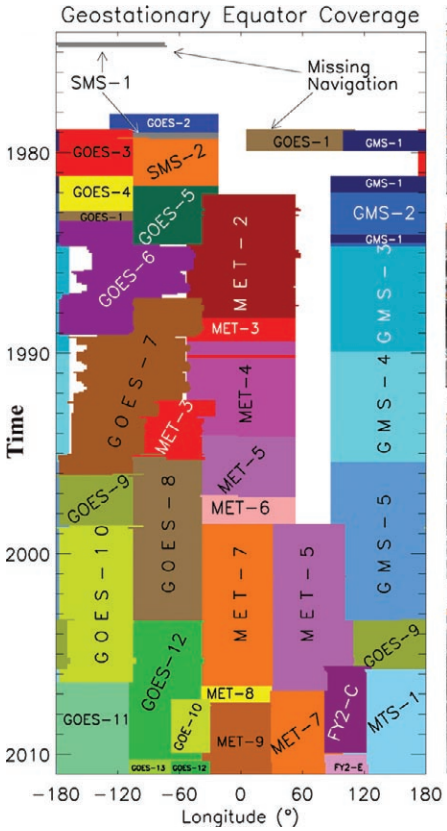
Diagram outlining geostationary satellite coverage at the equator from 1975-2010
(Figure 1a from Knapp et al. 2011)
