| Grain Boundary Migration in OCP |
Click image to enlarge (~1MB) |
|
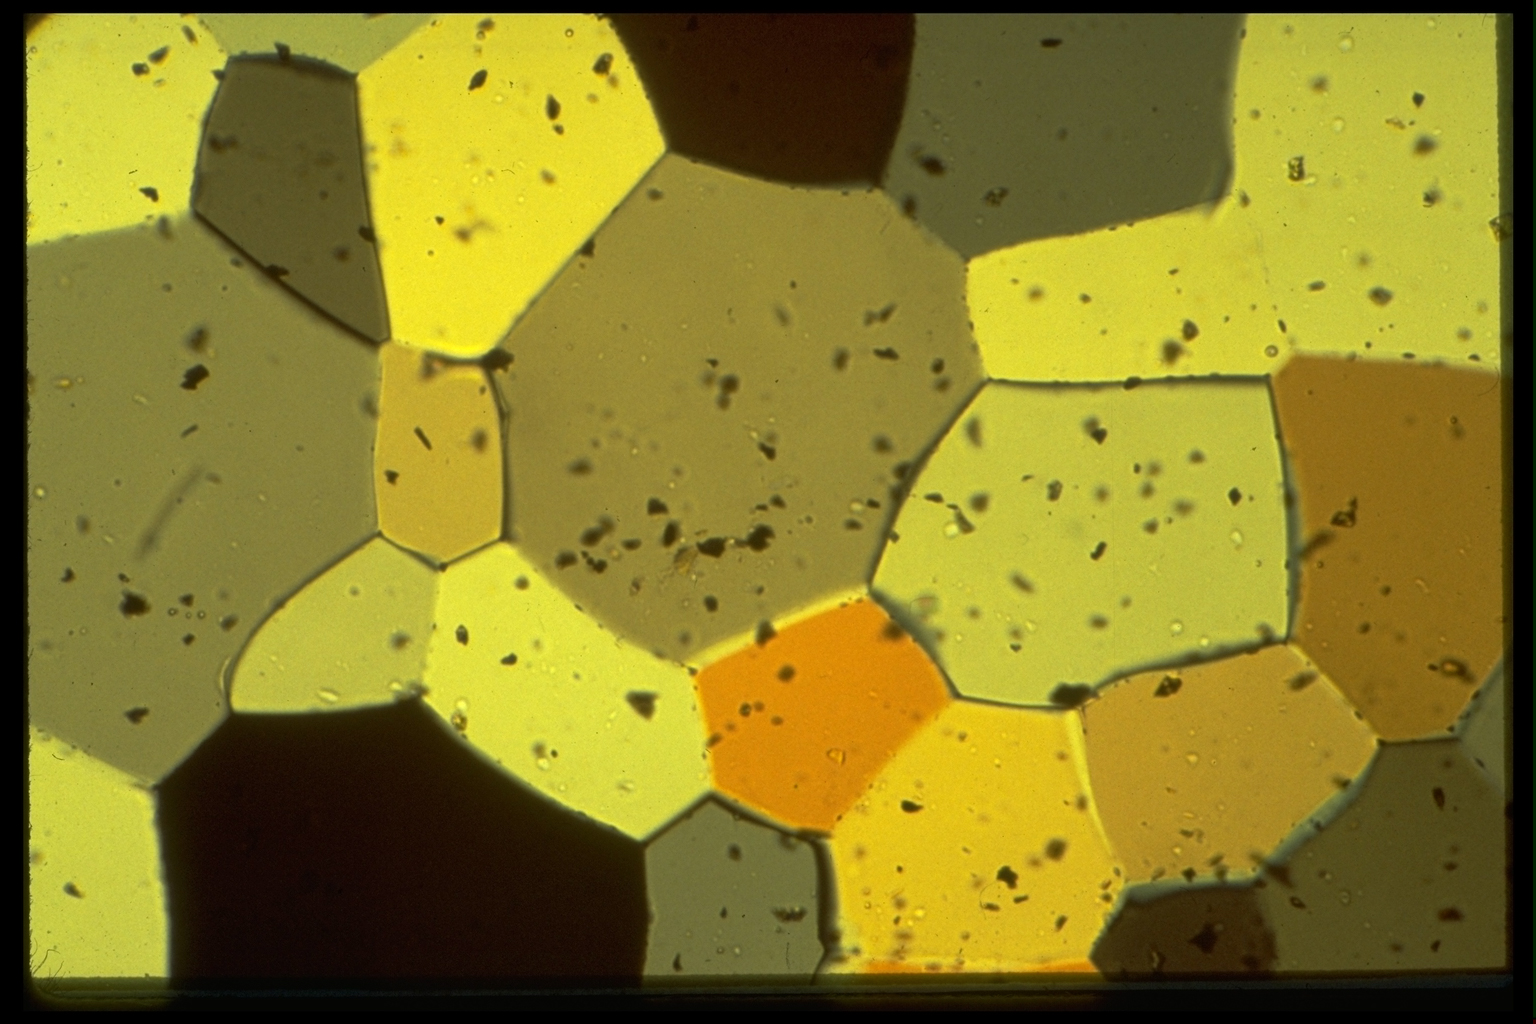
These pictures are at higher magnification again, with the field width equal to about 800µm. Silicon carbide marker particles have been included in the sample to make it easier to see where, and by how much, grain boundaries have migrated through the material. The marker particles are assumed to be surrounded by the same population of OCP molecules in each picture (give or take a few OCP molecules that may be diffusing through the others). The deformation was at room temperature. |
|
| 27. The marker particles are the small black
objects. The ones in-focus are near the top of the sample (nearer the
viewer). The ones out-of-focus are nearer the bottom of the sample. The
sample is about 60µm thick, perpendicular to the screen. During
the deformation, it thickens some. The deformation is a pure-shearing,
with the main shortening direction parallel to the long dimension of
the pictures. The shortening rate was about 7% per hour. One can keep
track of the bulk strain in the next three pictures by measuring the
distance between marker particles, for example the in-focus particle
now at (11,25) and the out-of-focus particle at (77,24). At this undeformed stage, the grains display a nice foam structure and they are optically strain-free. The central tan grain will be referred to as grain 1; its southeasterly, grey neighbor is grain 6. Notice the horizontal northern boundary of grain 6. It passes through an in-focus marker particle, and south of the out-of-focus marker at (78,24). |
|
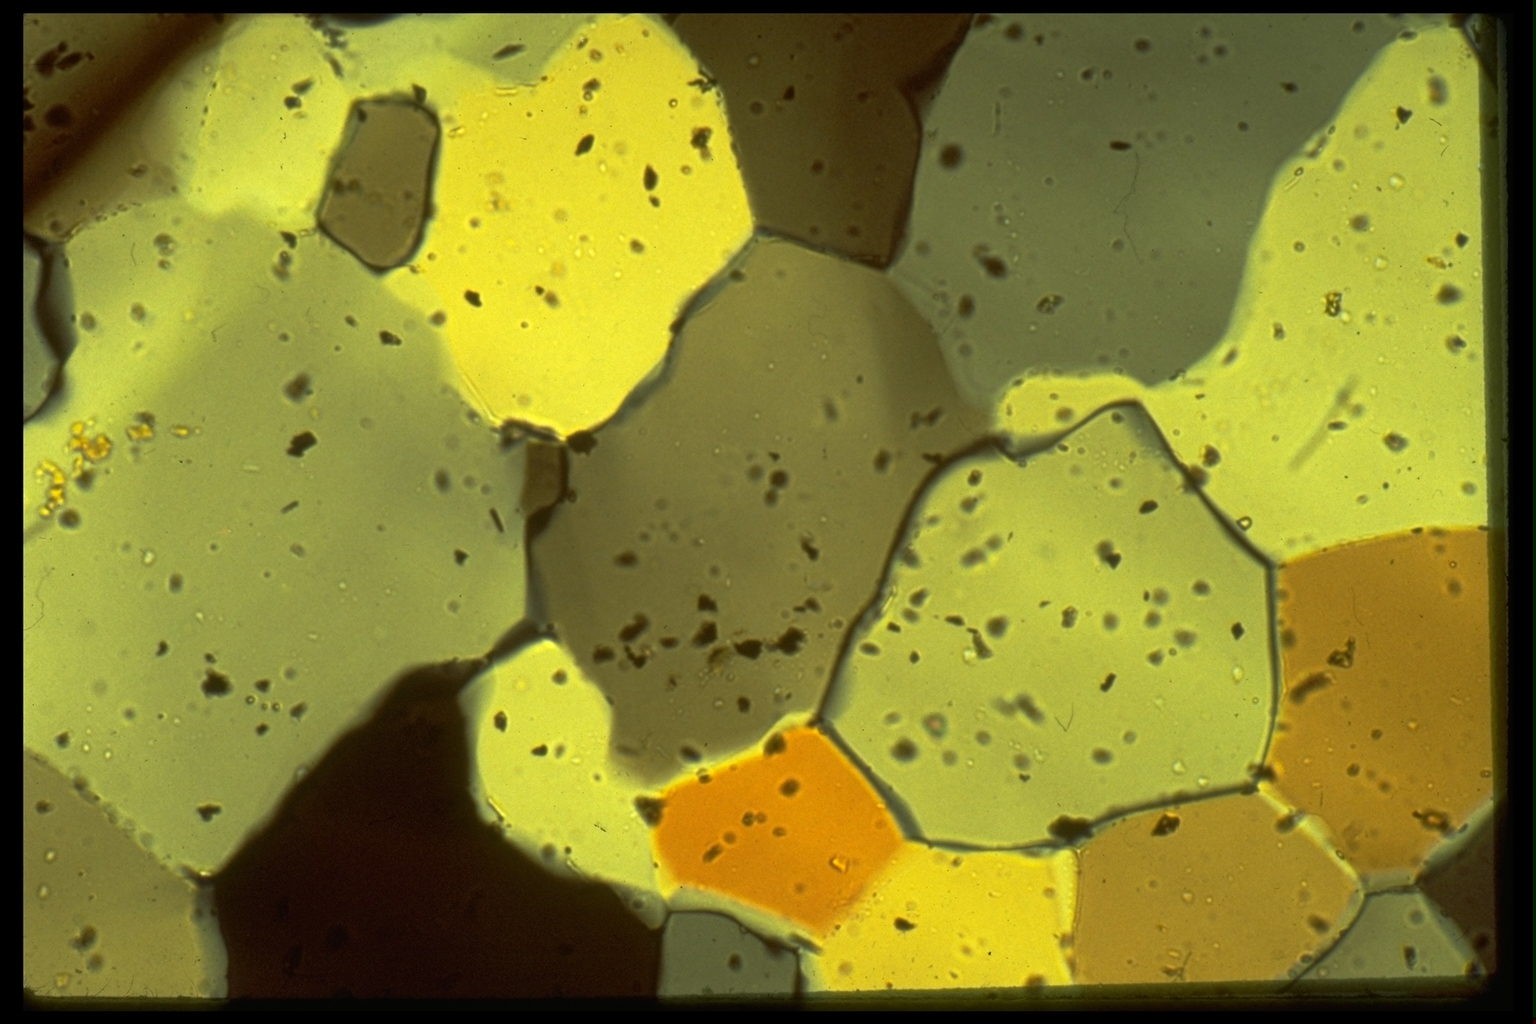
| 28. The northern boundary of grain 6 has now
migrated so that it occupies a new material position. It now passes
through the out-of-focus particle mentioned above. This means that many
molecules of OCP, previously arranged in the lattice orientation of the
yellow grain north of grain 6, have now become arranged on the
differently oriented lattice of grain 6. One can think of the migrating
grain boundary between these grains as a site where molecules are
"decrystallizing" off the retreating yellow lattice and crystallizing
onto the advancing grey lattice. Use the marker particles to discover whether, and in what direction, the other boundaries of grain 6 have migrated. Has grain 6 been strained internally between this picture and the last one? (Trace some marker particles from within grain 6 in each picture and find out whether their configuration has changed.) (ans) While some grains, like 6, are growing at the expense of their neighbors, others are shrinking. See for example, the small brown grain at (37,32). This was a much bigger grain in image 28 (the tan grain at 28,30). See that this grain was "eaten" mainly by the large grey grain west of it. |
|
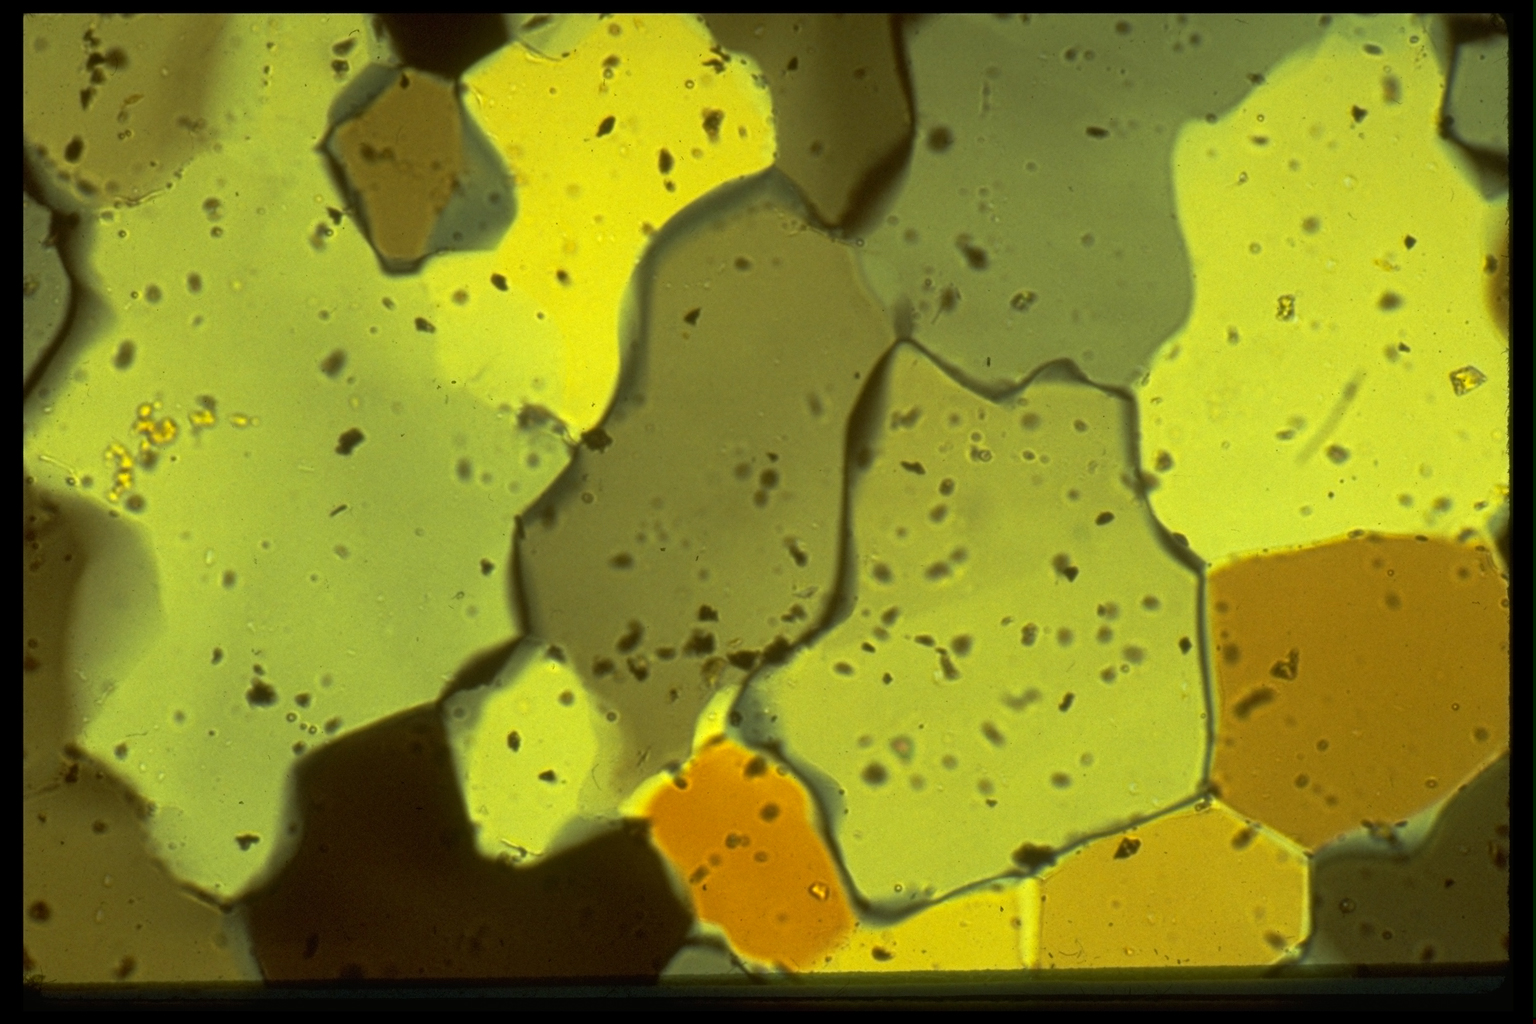
| 29. Grain 6 continues its aggression. Which way
has the boundary between grains 6 and 1 migrated? (ans) Grain 1 is beginning a process called GRAIN MIGRATION, where opposite boundaries of a grain migrate in the SAME direction. What is happening is that OCP molecules are entering grain 1 across its northwest boundary and leaving grain 1 across its southeast boundary. Can you see that if this process goes on long enough, grain 1 will eventually contain NONE of the molecules it started with? The grain is a MIGRATING LATTICE DOMAIN or volume defect, not a material thing. What is the bulk east-west shortening of the sample now? (ans) |
|
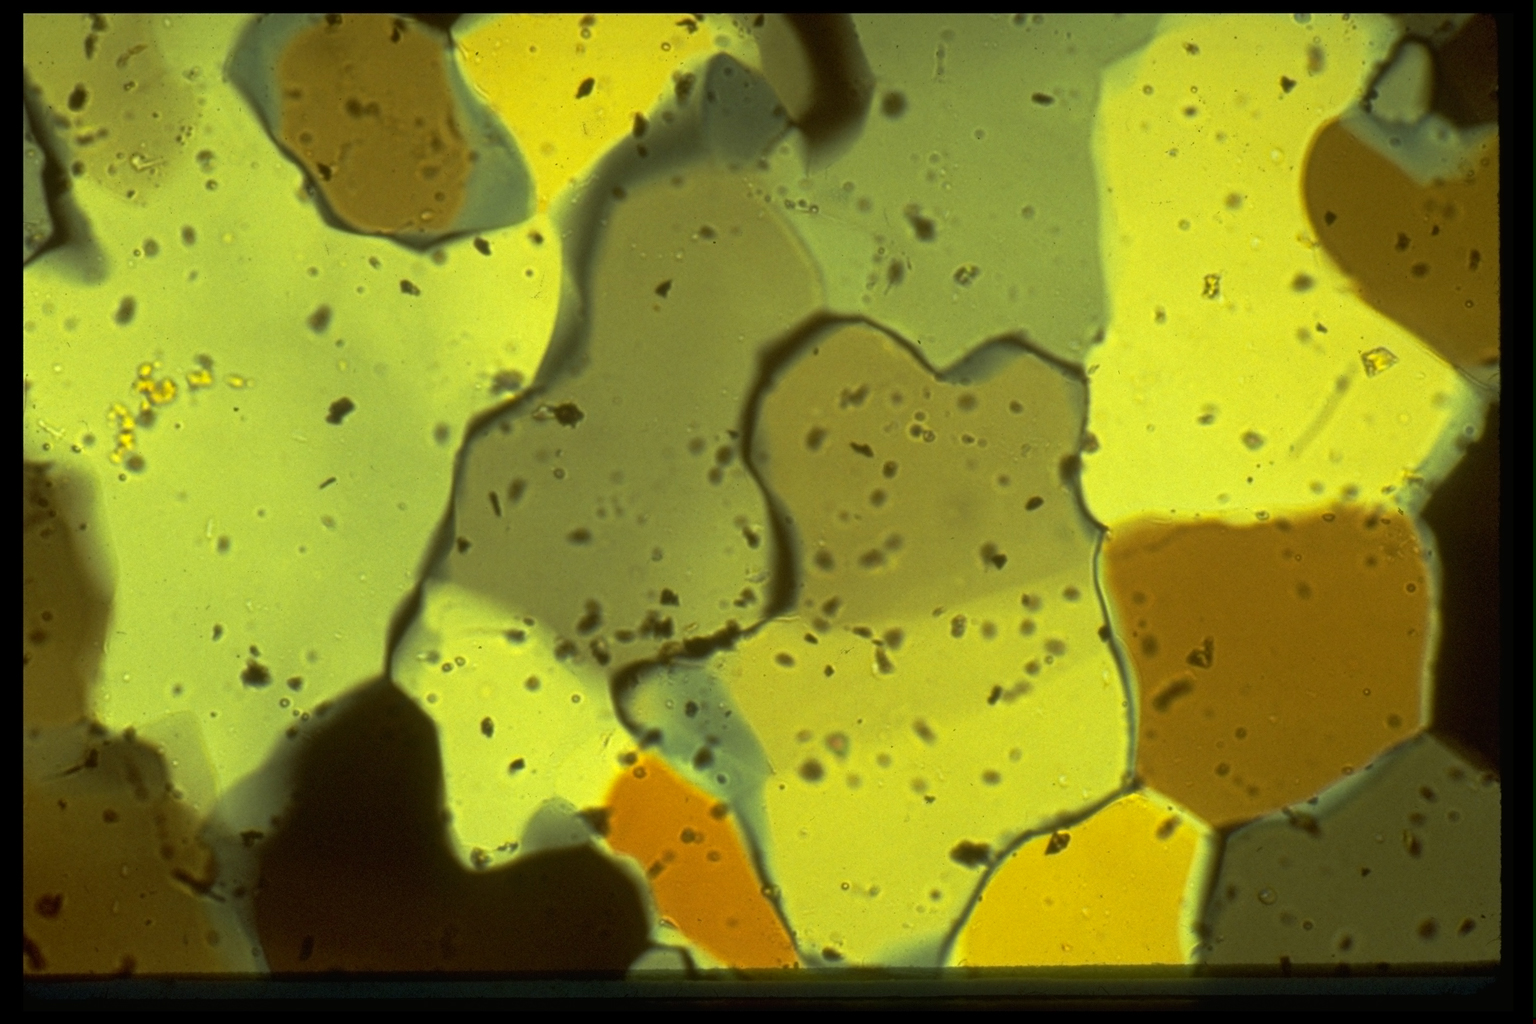
| 30. Grain 6 is still bigger, but note that it has
not been very successful in eating its pumpkin-colored neighbor to the
east. See the division of grain 6 now into three subgrains. (The bluish
area round its western lobe is probably not a subgrain, but a place
where the grain boundary is not steeply-dipping, so one is seeing
through grain 6 and other grains vertically above or below it, giving a
mixed interference color.) The grain around (25,10) is an interesting one. It is growing now, but initially it shrank. |
|
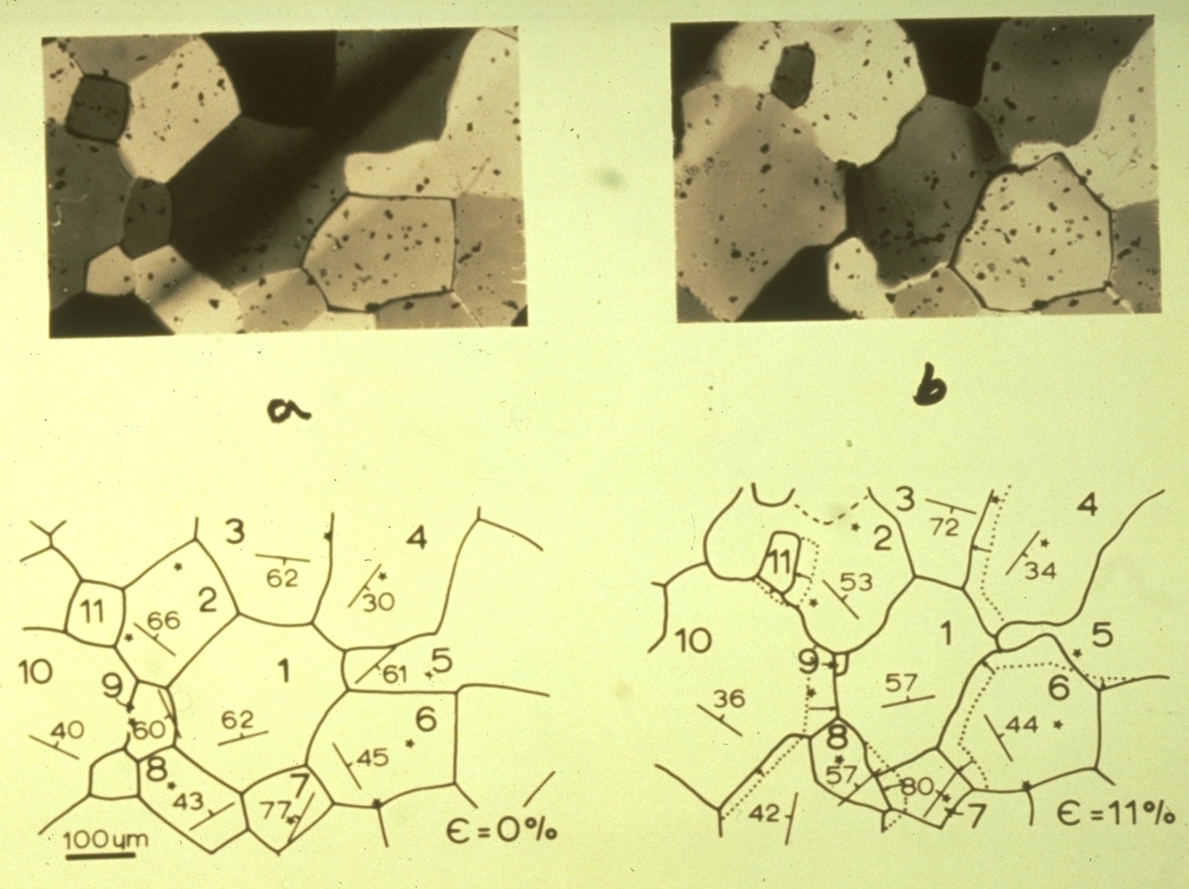
| 31. Black and white photos corresponding to images 27 and 29, and maps showing the grain boundaries and basal plane orientations in the grains (strike and dip symbols). Large numbers are grain numbers. The dotted lines in map (B) show the material positions of the boundaries in the undeformed state (A). Can a rationale be found for the aggressiveness of grain 6 in its lattice orientation? (ans) |
|
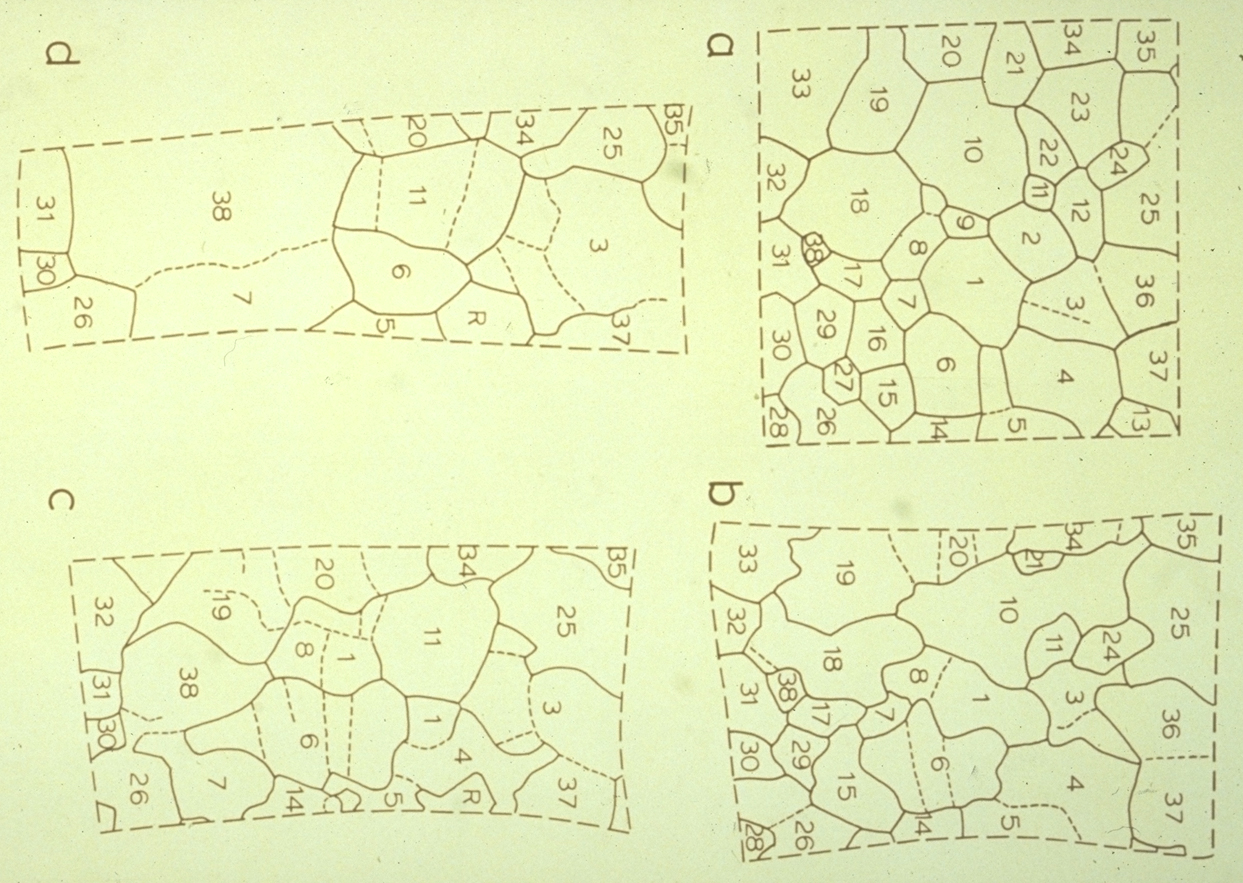
| 32.
Maps showing a larger region of the sample. (A) A square millimeter
of the sample in its undeformed state (image 27). (B)
Stage represented by image 30. (C) and (D) Stages
still more deformed than the stages shown by images 27 and 30. Notice
how grain 6 is eventually subdued by its neighbors. See how grain 11
became a large grain by stage (D) despite its small size in the
undeformed state (A). Notice that the supergrain 38-7 in (D) has developed by COALESCENCE of (originally spatially separated) grains 38 and 7. Grain 1 on the other hand, which is spatially continuous at stages (A) and (B), becomes DISSECTED by stage (C) and is gone by stage (D). Can you see any analogies between these maps of grains, and maps of nations over time? |
|
| (Some further details of the behavior of this OCP sample are given in the review paper Means, 1981. The concept of steady-state foliation. Tectonophysics 78, 179-199, and in Means 1983 - referred to in that paper.) | |