Tropical cloud clusters (TCCs) are large areas of deep convection
in the tropics that can develop into tropical cyclones, a process called "tropical cyclogenesis".
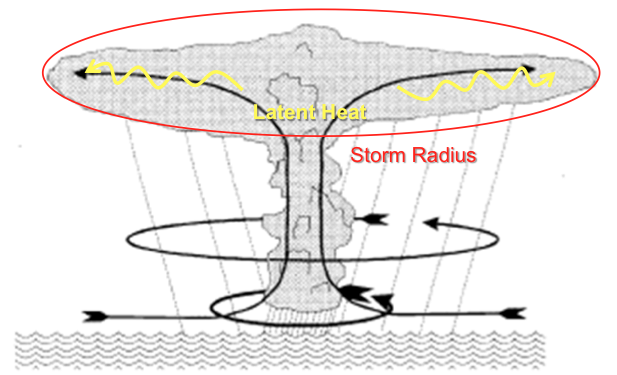
Theoretically, the Rossby Radius of Deformation (RROD) can be a useful parameter in predicting when
this will happen. RROD is defined as the critical radius where latent heat is unable to be dispersed
away from the TCC by gravity waves. Beyond this threshold value, gravity waves disperse the latent heat
too far away to support the intensification of a vortex. In this study, RROD is used in conjunction with
a new TCC dataset to investigate if RROD is a useful parameter in forecasting tropical cyclogenesis. The
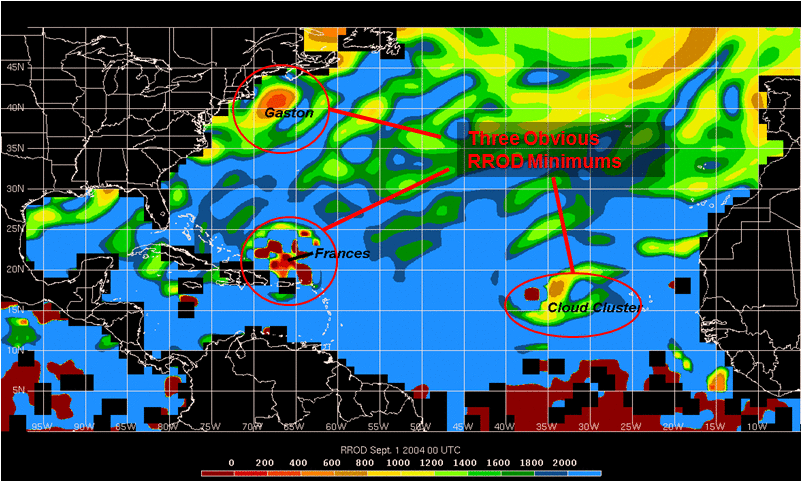
RROD was calculated from model analysis fields for Atlantic Basin TCCs that formed during the 2004-2008
hurricane seasons. The resultant RROD was divided by the radius of the TCC to yield the Rossby Radius Ratio
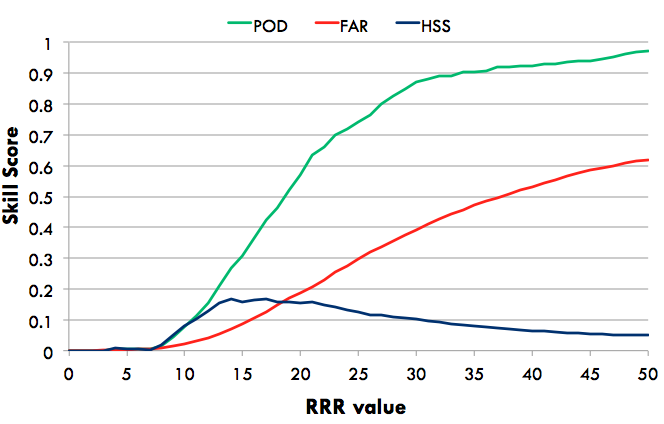
(RRR). Results show that there is a significant difference in RRR between developing and non-developing TCCs,
with roughly 95% of all developing TCCs becoming tropical cyclones with a RRR value of 47 or less. A RRR value
of 47 or less was found in 60% of all non-developing cases. Additionally, using a threshold RRR value of 17
produces the highest Heidke Skill Score. Inputting this predictor into other studies using discriminate
analysis could further improve the prediction of TCG.
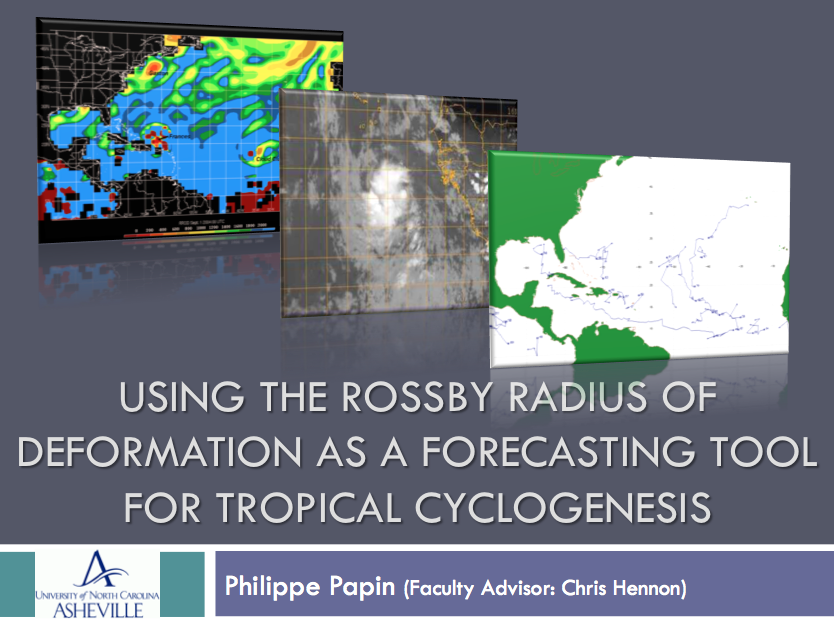
Powerpoint presentation given at the National Conference for Undergraduate Research (Mar 2011)
(Click the image to view Powerpoint presentation)
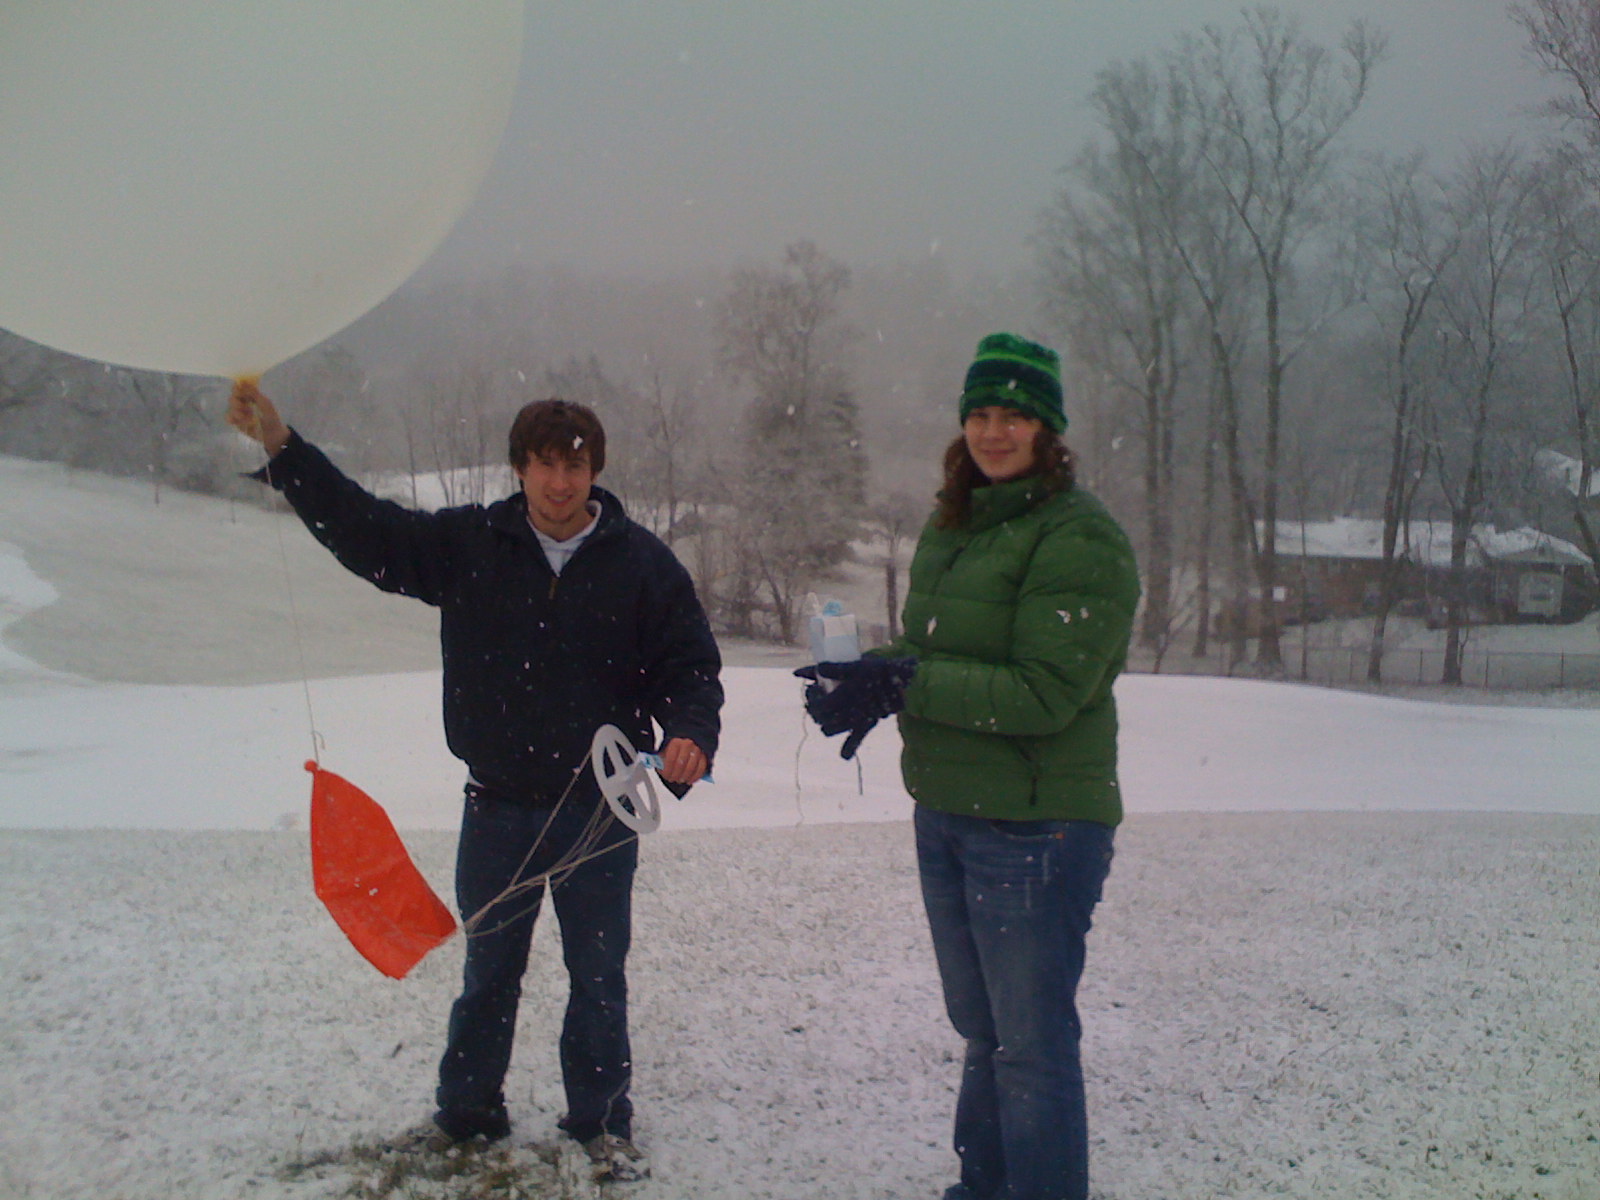
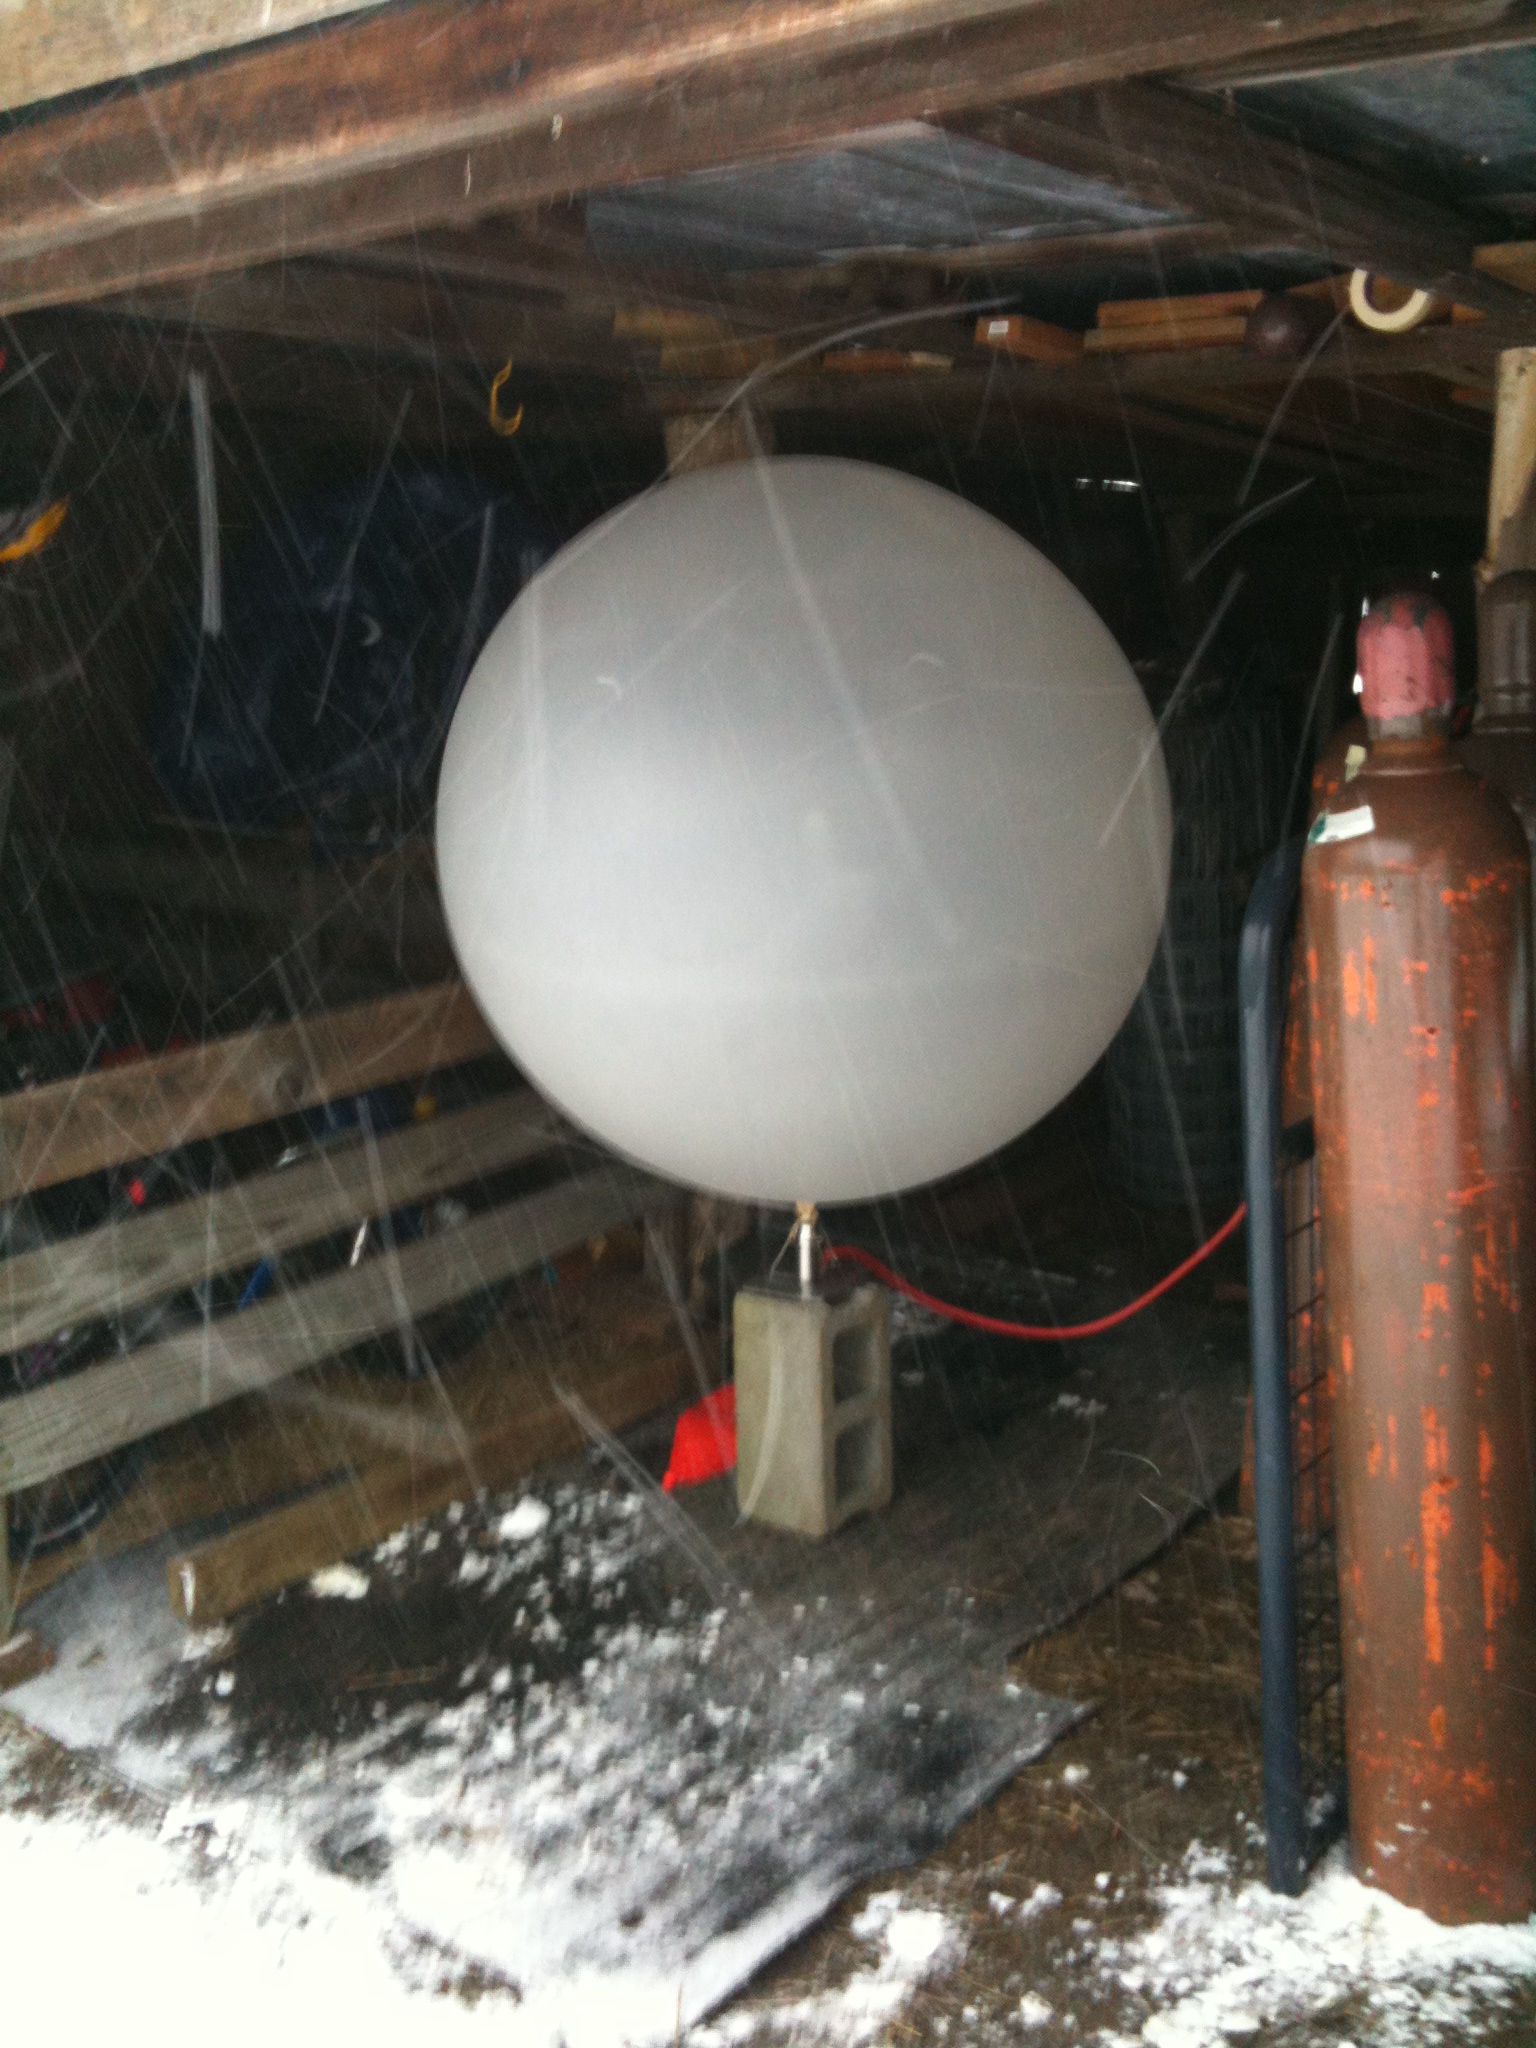
I was fortunate enough to participate in a limited field project (PI:
Dr. Doug Miller)
that involved launching weather balloons over the mountains of western North Carolina during various winter
storms that occurred from 2008-2011. During my four year participation in SEMPE, I helped launch 25+ radiosondes,
collecting sounding data that was used by the National Weather Service and for research purposes. The project is
still ongoing as the next generation of undergrad students at UNCA continue to launch radiosondes in upcoming significant
winter storms as conditions warrant.
For more information, please check out:
- BAMS article that features northwest flow snowfall (NWFS) events and the Appalachian meteorological network used to better understand these occurrences.
- NWFS Discussion Group
- Dr. Doug Miller Webpage
During my time working at the National Environmental Modeling and Analysis Center (NEMAC)
I briefly worked on a programming language specially tallored for making interactive graphs.
Multigraph allows you to interact with a graph, or multiple sets of graphs that can then be
zoomed in, zoomed out, or adjusted up or down on either axis. This is perfect for large, yet very detailed datasets,
where it may be important to look at specifica details without losing all the data that is contained within the graph.
By letting the user choose what range of data they want to view within the graph, the user is able to get a more through
analysis of the data. More recently, the language has been modernized to work in a HTML5 and is easily downloadable to use
on personal or work websites.
- Multigraph Home Page: A link for everything you ever wanted to know about Multigraph.
- Download the Javascript Libraries: Easy to incorporate into your website!
- NCMAC Home Page