Animation Builder
Use the matrix to select the field you wish to animate. Each animation includes a 10-day analysis archive, while a subset of the animations (highlighted in blue) include the most recent 144-hour forecast. The verifying date and time is displayed on the lower part of the image as YYMMDD/HHNNVFFF, where YY=year, MM=month, DD=day, HH=hour, NN=minute, and FFF=forecast hour.
Sutcliffe Development Theory animations:
1000 hPa Height, 1000-500 hPa Thickness, 1000 hPa Geostrophic Relative Vorticity [analysis only]
North America || North Atlantic Basin || Eastern Pacific || Tropical Strip
1000 hPa Height, 1000-500 hPa Thickness, 1000-500 hPa Thermal Vorticity [analysis only]
North America || North Atlantic Basin || Eastern Pacific || Tropical Strip
1000 hPa Height, 1000-500 hPa Thickness, Total RHS Sutcliffe Development theory [analysis and forecast]
North America || North Atlantic Basin || Eastern Pacific || Tropical Strip
1000 hPa Height, 1000-500 hPa Thickness, Term A Sutcliffe Development theory [analysis only]
North America || North Atlantic Basin || Eastern Pacific || Tropical Strip
1000 hPa Height, 1000-500 hPa Thickness, Term B Sutcliffe Development theory [analysis only]
North America || North Atlantic Basin || Eastern Pacific || Tropical Strip
1000 hPa Height, 1000-500 hPa Thickness, Term C Sutcliffe Development theory [analysis only]
North America || North Atlantic Basin || Eastern Pacific || Tropical Strip
Sutcliffe-Petterssen Development Theory animations:
500 hPa Height, Temperature, and Geostrophic Relative Vorticity [analysis only]
North America || North Atlantic Basin || Eastern Pacific || Tropical Strip
700 hPa Height, Temperature, and Vertical Motion [analysis only]
North America || North Atlantic Basin || Eastern Pacific || Tropical Strip
1000 hPa Height, 1000-500 hPa Thickness, and Total RHS Sutcliffe-Petterssen Development Theory [analysis and forecast]
North America || North Atlantic Basin || Eastern Pacific || Tropical Strip
1000 hPa Height, 1000-500 hPa Thickness, and Term A Sutcliffe-Petterssen Development Theory [analysis only]
North America || North Atlantic Basin || Eastern Pacific || Tropical Strip
1000 hPa Height, 1000-500 hPa Thickness, and Term B Sutcliffe-Petterssen Development Theory [analysis only]
North America || North Atlantic Basin || Eastern Pacific || Tropical Strip
1000 hPa Height, 1000-500 hPa Thickness, and Term C Sutcliffe-Petterssen Development Theory [analysis only]
North America || North Atlantic Basin || Eastern Pacific || Tropical Strip
QG Height Tendency Equation animations:
500 hPa Height, Wind, and Geostrophic Absolute Vorticity [analysis only]
North America || North Atlantic Basin || Eastern Pacific || Tropical Strip
700 hPa Height, Temperature, and Wind [analysis only]
North America || North Atlantic Basin || Eastern Pacific || Tropical Strip
500 hPa Height, Temperature, and Wind [analysis only]
North America || North Atlantic Basin || Eastern Pacific || Tropical Strip
300 hPa Height, Temperature, and Wind [analysis only]
North America || North Atlantic Basin || Eastern Pacific || Tropical Strip
500 hPa Height, 700-300 hPa Thickness, and Total RHS Traditional Height Tendency Equation [analysis and forecast]
North America || North Atlantic Basin || Eastern Pacific || Tropical Strip
500 hPa Height, 700-300 hPa Thickness, and Term A Traditional Height Tendency Equation [analysis only]
North America || North Atlantic Basin || Eastern Pacific || Tropical Strip
500 hPa Height, 700-300 hPa Thickness, and Term B Traditional Height Tendency Equation [analysis only]
North America || North Atlantic Basin || Eastern Pacific || Tropical Strip
500 hPa Height, Wind, and Quasigeostrophic Potential Vorticity (QGPV) [analysis and forecast]
North America || North Atlantic Basin || Eastern Pacific || Tropical Strip
500 hPa Height, QGPV, and Total RHS QGPV Height Tendency Equation [analysis and forecast]
North America || North Atlantic Basin || Eastern Pacific || Tropical Strip
QG Omega Equation animations:
700 hPa Height, Relative Humidity, and Vertical Motion [analysis only]
North America || North Atlantic Basin || Eastern Pacific || Tropical Strip
700 hPa Height, 1000-500 hPa Thickness, and Total RHS Traditional Omega Equation [analysis and forecast]
North America || North Atlantic Basin || Eastern Pacific || Tropical Strip
700 hPa Height, 1000-500 hPa Thickness, and Term A Traditional Omega Equation [analysis only]
North America || North Atlantic Basin || Eastern Pacific || Tropical Strip
700 hPa Height, 1000-500 hPa Thickness, and Term B Traditional Omega Equation [analysis only]
North America || North Atlantic Basin || Eastern Pacific || Tropical Strip
700 hPa Height, 1000-500 hPa Thickness, and 700 hPa Geostrophic Relative Vorticity [analysis only]
North America || North Atlantic Basin || Eastern Pacific || Tropical Strip
700 hPa Height, 1000-500 hPa Thickness, and Total RHS Sutcliffe-Trenberth Omega Equation [analysis and forecast]
North America || North Atlantic Basin || Eastern Pacific || Tropical Strip
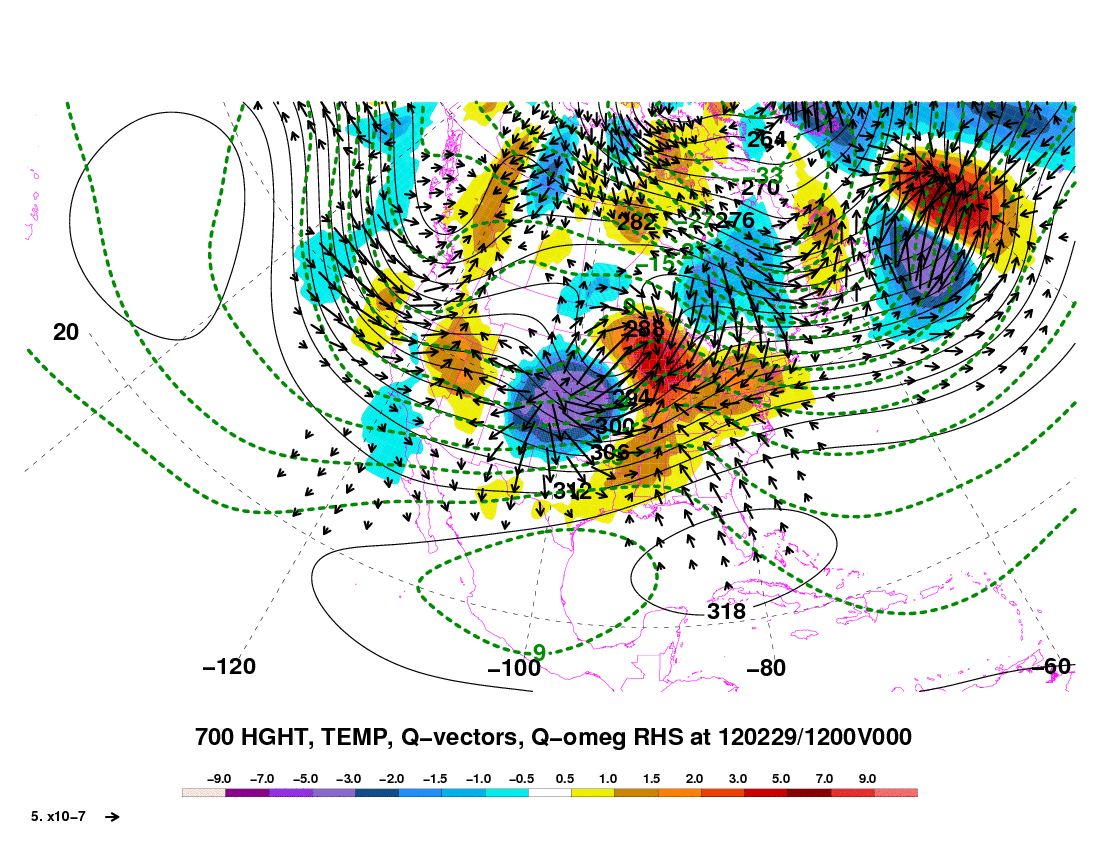
700 hPa Height, Temperature, Q-vectors, and Total RHS Q-vector Omega Equation [analysis and forecast]
North America || North Atlantic Basin || Eastern Pacific || Tropical Strip
700 hPa Height, Temperature, and Total RHS Q-vector Omega Equation [analysis and forecast]
North America || North Atlantic Basin || Eastern Pacific || Tropical Strip
700 hPa Height, Temperature, and Term A Q-vector Omega Equation [analysis only]
North America || North Atlantic Basin || Eastern Pacific || Tropical Strip
700 hPa Height, Temperature, and Term B Q-vector Omega Equation [analysis only]
North America || North Atlantic Basin || Eastern Pacific || Tropical Strip
References
Bluestein, H. B., 1992: Principles of Kinematics and Dynamics. Vol. I. Synoptic-Dynamic Meteorology in Midlatitudes. Oxford University Press, 431 pp.
Bosart, L. F., G. J. Hakim, K. R. Tyle, M. A. Bedrick, W. E. Bracken, M. J. Dickinson, and D. M. Schultz, 1996: Large-Scale antecedent conditions associated with the 12-14 March 1993 cyclone ("Superstorm '93") over eastern North America. Mon. Wea. Rev., 124, 1865-1891.
Carlson, T. N., 1998: Mid-Latitude Weather Systems. Amer. Meteor. Soc., 507 pp.
Durran, D. R., and L. W. Snellman, 1987: The diagnosis of synoptic-scale vertical motion in an operational environment. Wea. Forecasting, 2, 17-31.
Hakim, G. J., L. F. Bosart, and D. Keyser, 1995: The Ohio Valley wave-merger cyclogenesis event of 25-26 January 1978. Part I: Multiscale case study. Mon. Wea. Rev., 123, 2663-2692.
Holton, J. R., 2004: An Introduction to Dynamic Meteorology. 4th ed. Academis Press, 535 pp.
Hoskins, B. J., I. Draghici, and H. C. Davies, 1978: A new look at the omega equation. Quart. J. Roy. Meteor. Soc., 104, 31-38.
Keyser, D., M. J. Reeder, and R. J. Reed, 1988: A generalization of Petterssen's frontogenesis function and its relation to the forcing for vertical motion. Mon. Wea. Rev., 116, 762-780.
Martin, J. E., 2006: Mid-Latitude Atmospheric Dynamics: A First Course. John Wiley & Sons, Ltd, 324 pp.
Petterssen, S., 1956: Motion and Motion Systems. Vol. I. Weather Analysis and Forecasting. McGraw-Hill, 428 pp.
Sanders, F., and B. J. Hoskins, 1990: An easy method for estimation of Q-vectors on weather maps. Wea. Forecasting, 5, 346-353.
Sutcliffe, R. C., 1947: A contribution to the problem of development. Quart. J. Roy. Meteor. Soc., 73, 370-383.
-----, and A. G. Forsdyke, 1950: The theory and use of upper air thickness patterns in forecasting. Quart. J. Roy. Meteor. Soc., 76, 189-217.
Trenberth, K. E., 1978: On the interpretation of the diagnostic quasi-geostrophic omega equation. Mon. Wea. Rev., 106, 131-137.
Questions or Comments? Contact Tom Galarneau.
 - General Description