High-resolution large eddy simulation idealized modeling of convective initiation
December 16, 2020
As a result of the findings in our statistical analysis of the near-cloud RELAMPAGO-CACTI soundings (Nelson et al. (2021), I began to conduct high-resolution (~250-m) idealized large eddy simulations of convective initiation using Cloud Model 1 (CM1; Bryan and Fritsch 2002) to examine the updraft-environment interactions critical for deep moist convection. I initialized the simulations with the composite CI, Fail, and Null soundings from RELAMAPGO-CACTI and performed ~70 experiments using idealized terrain (similar to that in Argentina) with radiation and surface fluxes and flat-terrain with a prescribed warm bubble. These results suggest that caution should be taken when chosing warm bubble sizes/intensities for idealized models and they should not be arbitrary, as convection can easily be created in environments not supportive of convection. Our more complex terrain experiments illustrate that dry air entrainment severely limits the ability for precipitating convection to form, regardless of the strength of CAPE or low-level heating. Preliminary results show that the Null envirionemnt produces a smaller orographic-driven mesoscale updraft and, therefore, smaller/weaker thermals, which further enchance the effects of dry air entrainment. Stay tuned for our forthcoming manuscript!
Statistical analysis of near-cloud environments supporting convective initiation during RELAMPAGO-CACTI
December 16, 2020
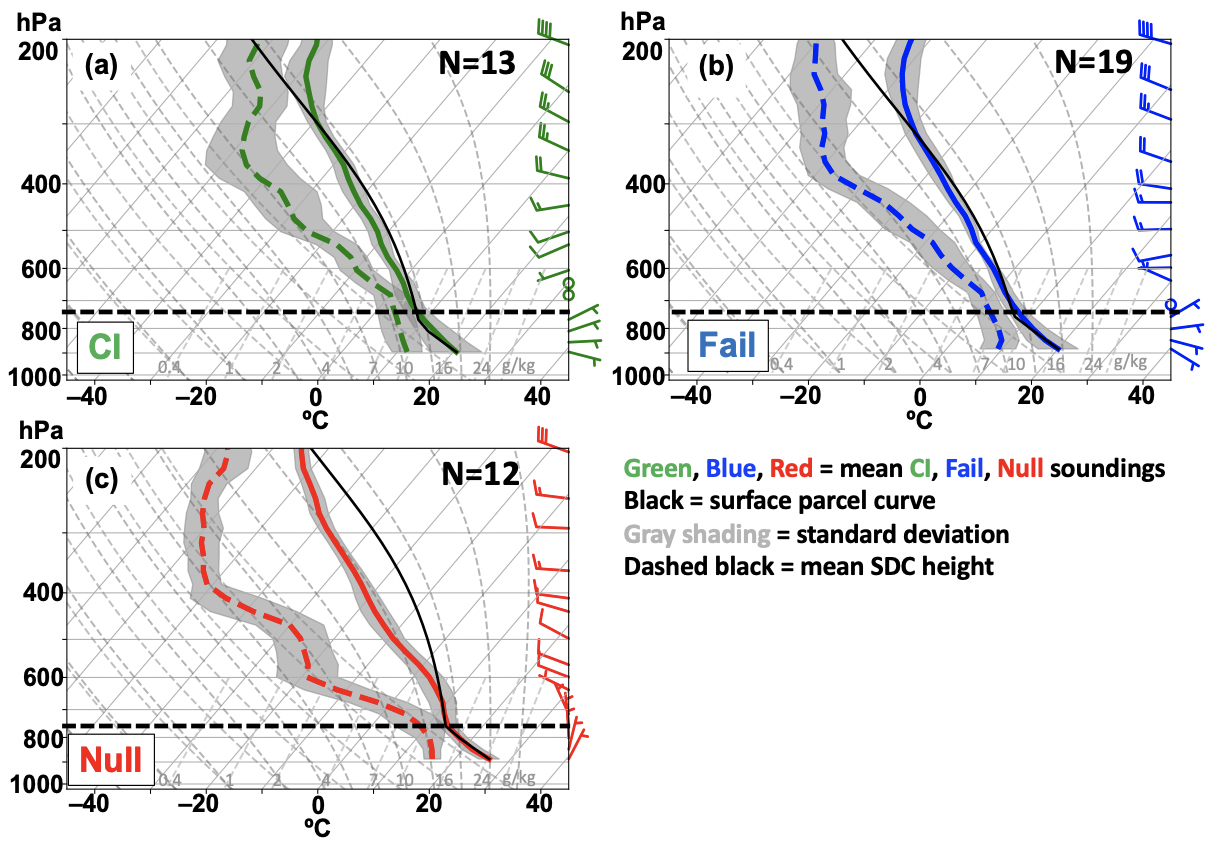
Back at the start of my postdoc postition at University of Colorado - Boulder, I began to analyze near-cloud environmental soundings launched near precipitating convection during the 2018-2019 RELAMPAGO and CACTI field campaigns in the Cordoba and San Rafael regions of Argentina.We began to notice that there was a grouping of events that occurred during the projects: 1.) convection successfully initiated ("CI"); 2.) convection tried to initiate but ultimately decayed ("Fail"); and, 3.) no precipitating convection occurred despite forecasts from high-resolution (3-4 km) WRF-CAMs. We decided to statistically compare these near-cloud environments to discern environmental controls supporting or limiting convection initiation. The novelty of this study is that few studies have examined observations of the near-cloud environment (defined as within 30 km and 30 min of an event by my autocorrelation analysis technique). Rather, previous studies have either used high-resolution modeling or observations far removed from the cloud to ascertain environmental constraints on precipitation formation. Our study found that there is little difference between CI and Fail events, except perhaps that Fail events generally occur 1-2 hr before CI and have slightly larger CIN and ambient upward motion. Null events, arguably, have the most convective potential with large CAPE, little CIN, litte wind shear in the active cloud bearing layer, unstable low-levels, and low LFCs. However, the Null events also have larger dew point depressions (~20 C), stabilizing mid-/upper-levels, higher freezing levels, and evidence of less terrain-driven convergence and possible terrain-wave activity. We hypothesize that dry air entrainment and lack of substantual low-level convergence were paramount to the formation of the Null events. For more information, please see our published manuscript (currently in EOR) at Monthly Weather Review here. Stay tuned for the fully published article soon! Tangential to this manuscript, a manuscript lead by my postdoctoral advisor (Dr. James Marquis) examines convective initiation using dual-Doppler wind retreivals, sounding data, and satellite data.
Development of a prototype pitot-venturi XDD
September 9, 2019
Following the analysis of the TCI experiment dataset (see below), it was discovered that majority of the observed vertical velocity distribution was within +/- 2 m/s, which, coincidentally, is the typical error range for dropsonde-derived vertical velocities. I proposed to revisit and revise an older pitot-static method to obtain the vertical velocity from dropsondes. The pitot-static method was first introduced at NCAR in the 1960's, but had error estimates of approximately 1 m/s. With newer electronics and a revised layout (called a pitot-venturi), vertical velocity errors have been decreased by approximately a factor of four or five (or 0.2 - 0.4 m/s). For more information, please see the published dissertation, here. Stay tuned for our forthcoming manuscript!
The Tropical Cyclone Intensity (TCI) Experiment
July 9, 2016
(Edited: September 6, 2019)
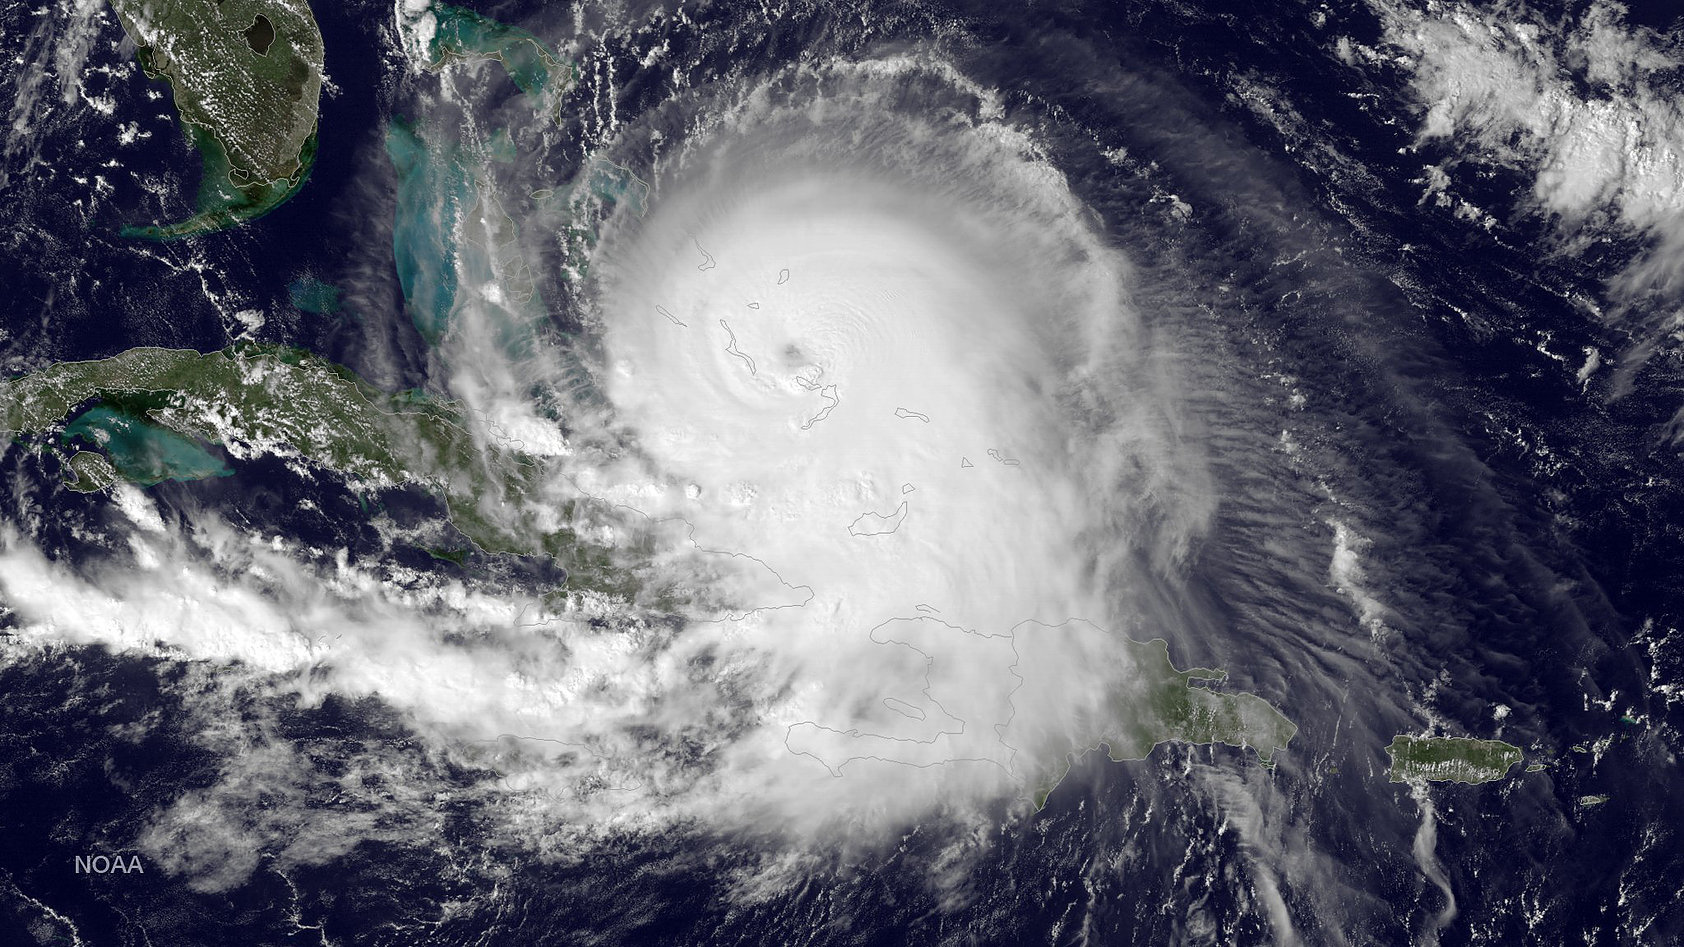
I started working with dropsondes in July 2015 as part of the Office of Naval Research TCI study. Approximately 784 eXpendable Digital Dropsondes (XDDs) were dropped into hurricanes Erika, Marty, Joaquin, and Patricia in 2015. The XDDs, which were developed by Yankee Environmental Systems, were deployed from the High Definition Sounding System (HDSS) onboard a NASA WB-57 aircraft. During TCI, I analyzed the goniometry of the sondes and the antennas on the aircraft. Goniometry is, essentially, a game of angles. It involves analyzing the strength of the signal of the reception of the sonde as a function of aircraft heading.
Afterward, I began to analyze and study XDD-derived vertical velocities from the TCI dataset. The analysis of the vertical velocities culminated into a manuscript evaluating the radial, altitudinal, and shear-relative azimuthal locations of the strongest updrafts and downdrafts in Marty, Joaquin, and Patricia (see Nelson et al. 2019). As a result of the review of the Nelson et al. (2019), I examined the temporal and spatial autocorrelations in the TCI data (see Nelson et al. 2020). The results of the Nelson et al. (2020) study have major implications for the horizontal spacing of dropsondes in future dropsonde-based experiments in tropical cyclones. Using the TCI dataset, I derived and analyzed four versions of the well-known "wind-finding equations" (WFEs) to obtain horizontal wind from dropsonde motion data. It was found that by using a full, "unapproximated", equation set, horizontal wind can be changed by as much as 50% in the upper-levels and eyewall region of the TCs (manuscript being revised for re-submission).
The Relationship Between Environment at TC Genesis and Future TC Intensity
July 11, 2016
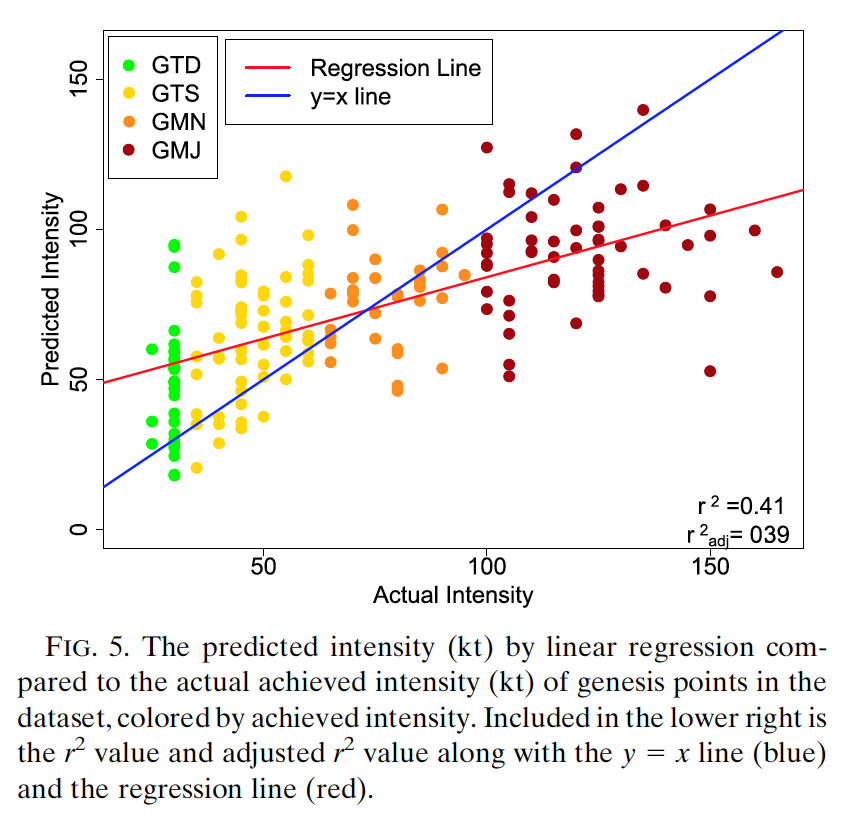
In a joint effort, a group of students and myself analyzed the relationship of the tropical cyclone environment at genesis to its' future subsequent intensity. Through the use of a forward stepwise selection, a multi-parameter linear regression was developed to correlate environmental predictors to maximum intensity. A nested grid of boxes was used to evaluate the spatial distribution of said environmental predictors. This led to the analyzing of composite plots for various environmental parameters based upon bootstrap testing. The bootstrap significant differences were then compared to the regression indicated regions of influence. Overall, it was found that a stronger, more resilient vortex at genesis leads to a stronger future tropical cyclone.
The REHS Model for the SPA-10 at SDSMT
June 14, 2015
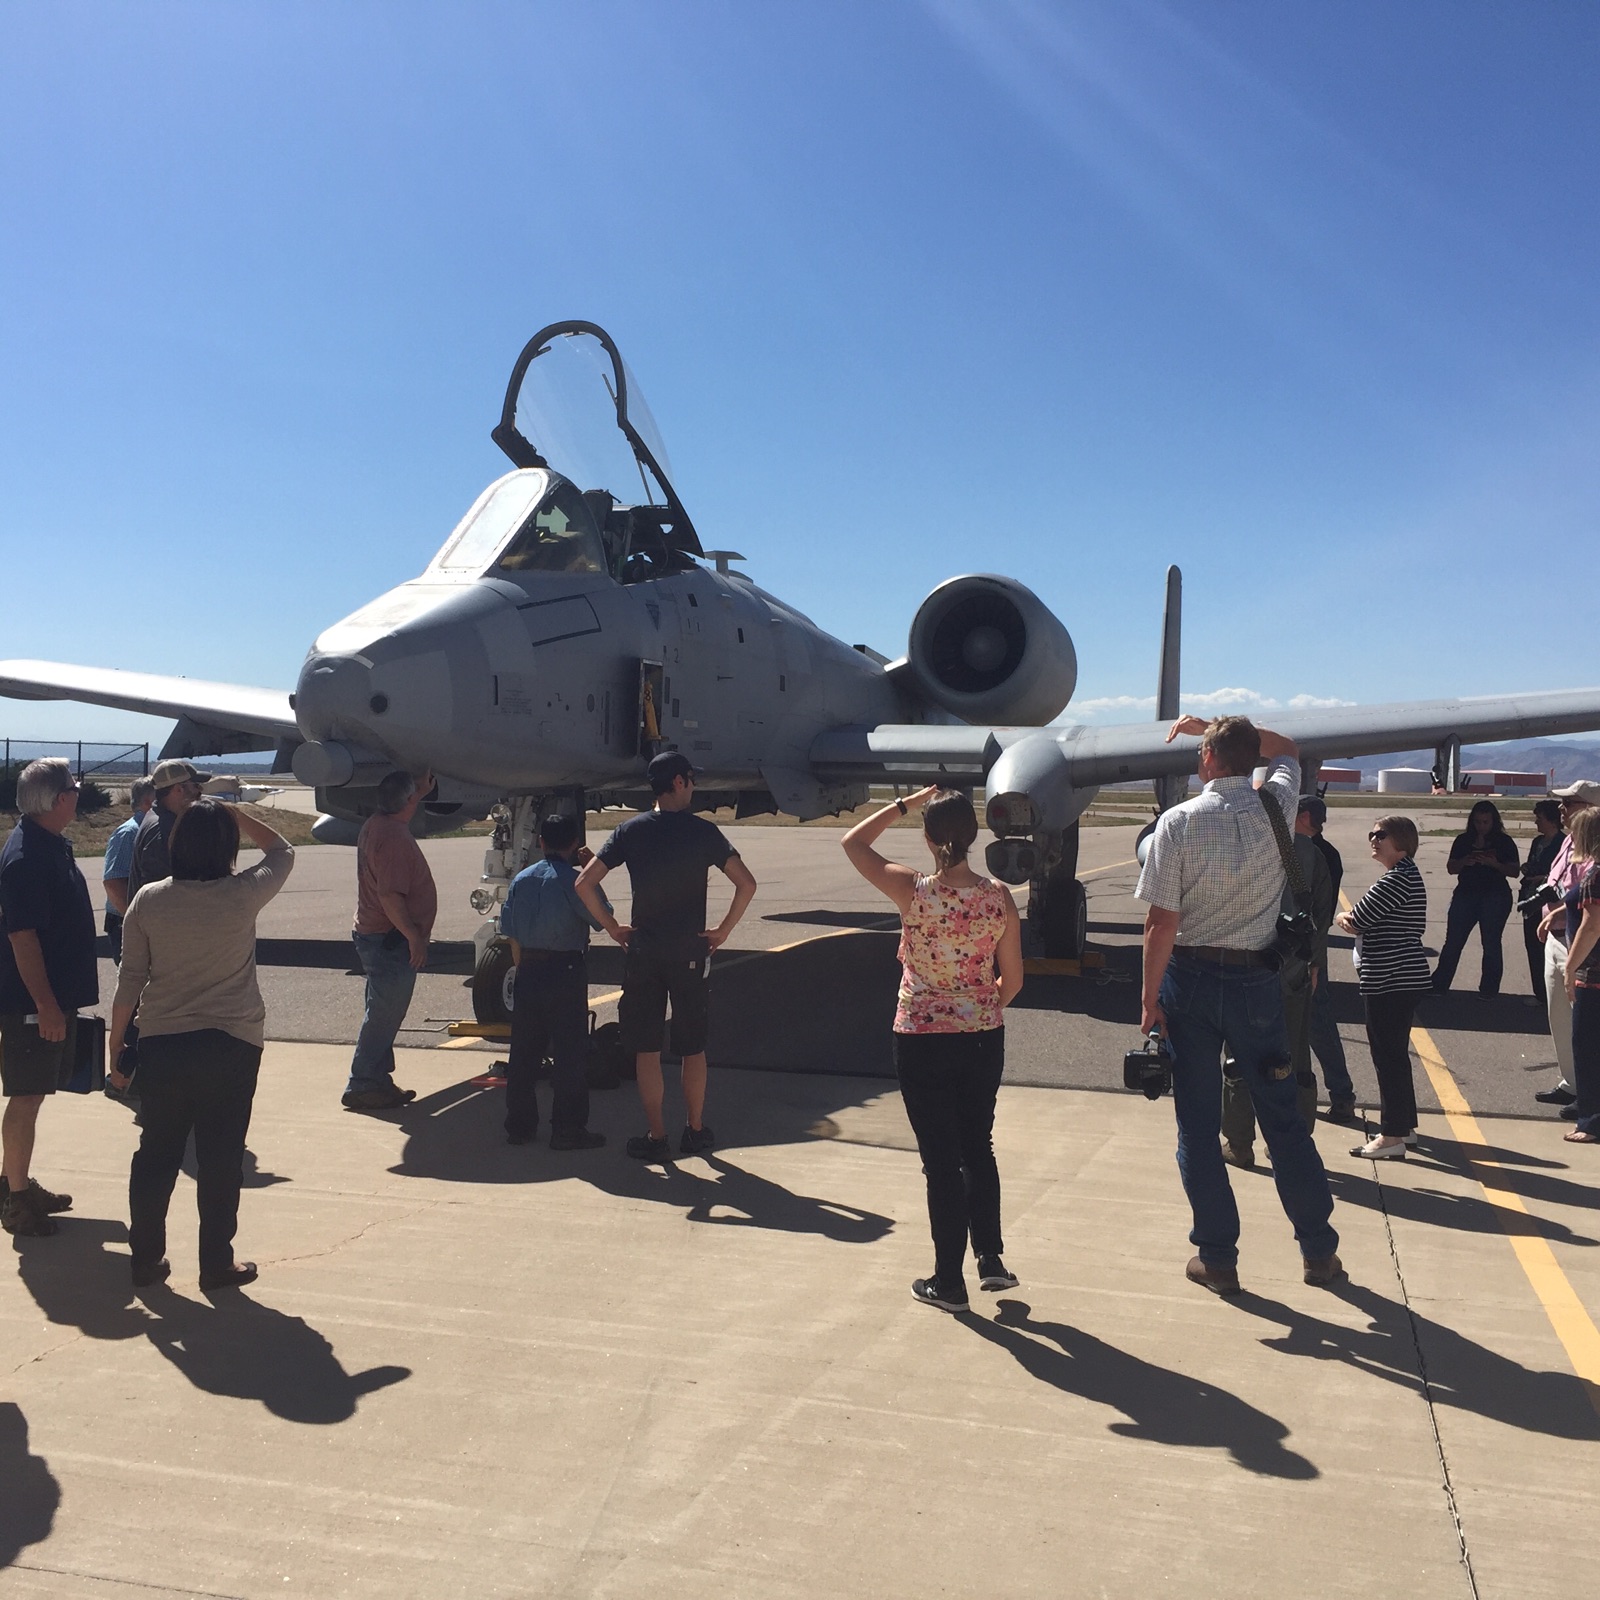
I finished up at SDSMT in 2015 on my Master's research with the storm penetration A-10 aircraft (SPA-10). At first, what started as an analysis of optimum software packages for the SPA-10 project led into the development of a hail size model to aid in mission guidance for the aircraft. The SPA-10 will be able to fly into select areas of thunderstorms to collect valuable in situ data. In order to do so, we need appropriate software that tracks our aircraft's position and displays radar products to guide the pilot to sample areas, while avoiding hazardous condidtions. Specifically, I looked at areas of large hail. In an attempt to predict hail size, a multi-parameter linear regression model was derived from radar predictors available in the TITAN (Thunderstorm, Indentification, Tracking, Analysis and Nowcasting) software suite. This model was called the Radar Estimated Hail Size (REHS) model. While REHS proved to not be effective at diagnosing hail size at the surface, it provided valuable information about hail storms in general and future work to improve statistical based hail size models.
To see an overview of the REHS model and the SPA-10, see my talk from the 2015 Weather Modification Conference here!