Sarah Ditchek
Associate Scientist
Cooperative Institute for Marine and Atmospheric Studies (CIMAS) | University of Miami (UM)
Hurricane Research Division (HRD) | NOAA's Atlantic Oceanographic and Meteorological Laboratory (AOML)
TC Diurnal Pulse Archive
The graphics in this archive use the two objective metrics created by and detailed in Ditchek et al. (2019a) and Ditchek et al. (2019b) to identify pulse type and electric activity in Atlantic basin tropical cyclones (TCs), respectively. For details on data sets used and how to download the graphics in the archive, please see the README. For brief details on the criteria for both objective metrics and their associated terms and definitions, expand the below.
To objectively identify pulse type, four criteria are used:
- Cooling (Warming) Cloud Tops: lower (upper) quartile of 6-h IR BT difference values
- On-The-Clock: spatial location of cloud tops follow the diurnal clock schematic (Ditchek et al. 2019a, Fig. 2b)
- Areal Criterion: upper half of cloud-top areal coverage distribution
- Longevity: number of hours in a given day where the above 3 conditions were satisfied to account for outward propagation
- LLCP (long-lived cooling pulse): days that have on-the-clock cooling cloud tops that satisfy the areal criterion and exist for ≥9 h
- LLWP (long-lived warming pulse): days that have on-the-clock warming cloud tops that satisfy the areal criterion and exist for ≥9 h
- SLCP (short-lived cooling pulse): days that have on-the-clock cooling cloud tops that satisfy the areal criterion and exist for 3–6 h
- SLWP (short-lived warming pulse): days that have on-the-clock warming cloud tops that satisfy the areal criterion and exist for 3–6 h
- NP (no pulse): days that have no identifiable outward-propagating cooling or warming cloud tops, have cooling or warming cloud tops that do not satisfy the areal criterion, or have cooling or warming cloud tops that satisfy the areal criterion but exist for <3 h
- Pulse Lightning Flash Density: upper half of the distribution
- Areal Criterion: upper half of pulse lightning areal coverage distribution
- Longevity: number of hours in a given day where the above 2 conditions were satisfied
- ACT (electrically active pulse): pulses that satisfy both the pulse lightning flash density and areal criterion and exist for ≥9 h
- QUASI (quasi-electrically active pulse): pulses that satisfy both the pulse lightning flash density and areal criterion and exist for 3–6 h
- INACT (electrically inactive pulse): pulses that do not satisfy both the pulse lightning flash density and areal criterion or exist for <3 h
CHOOSE A YEAR
TROPICAL STORM CLAUDETTE (2009)
Lifetime Diurnal Pulse Activity
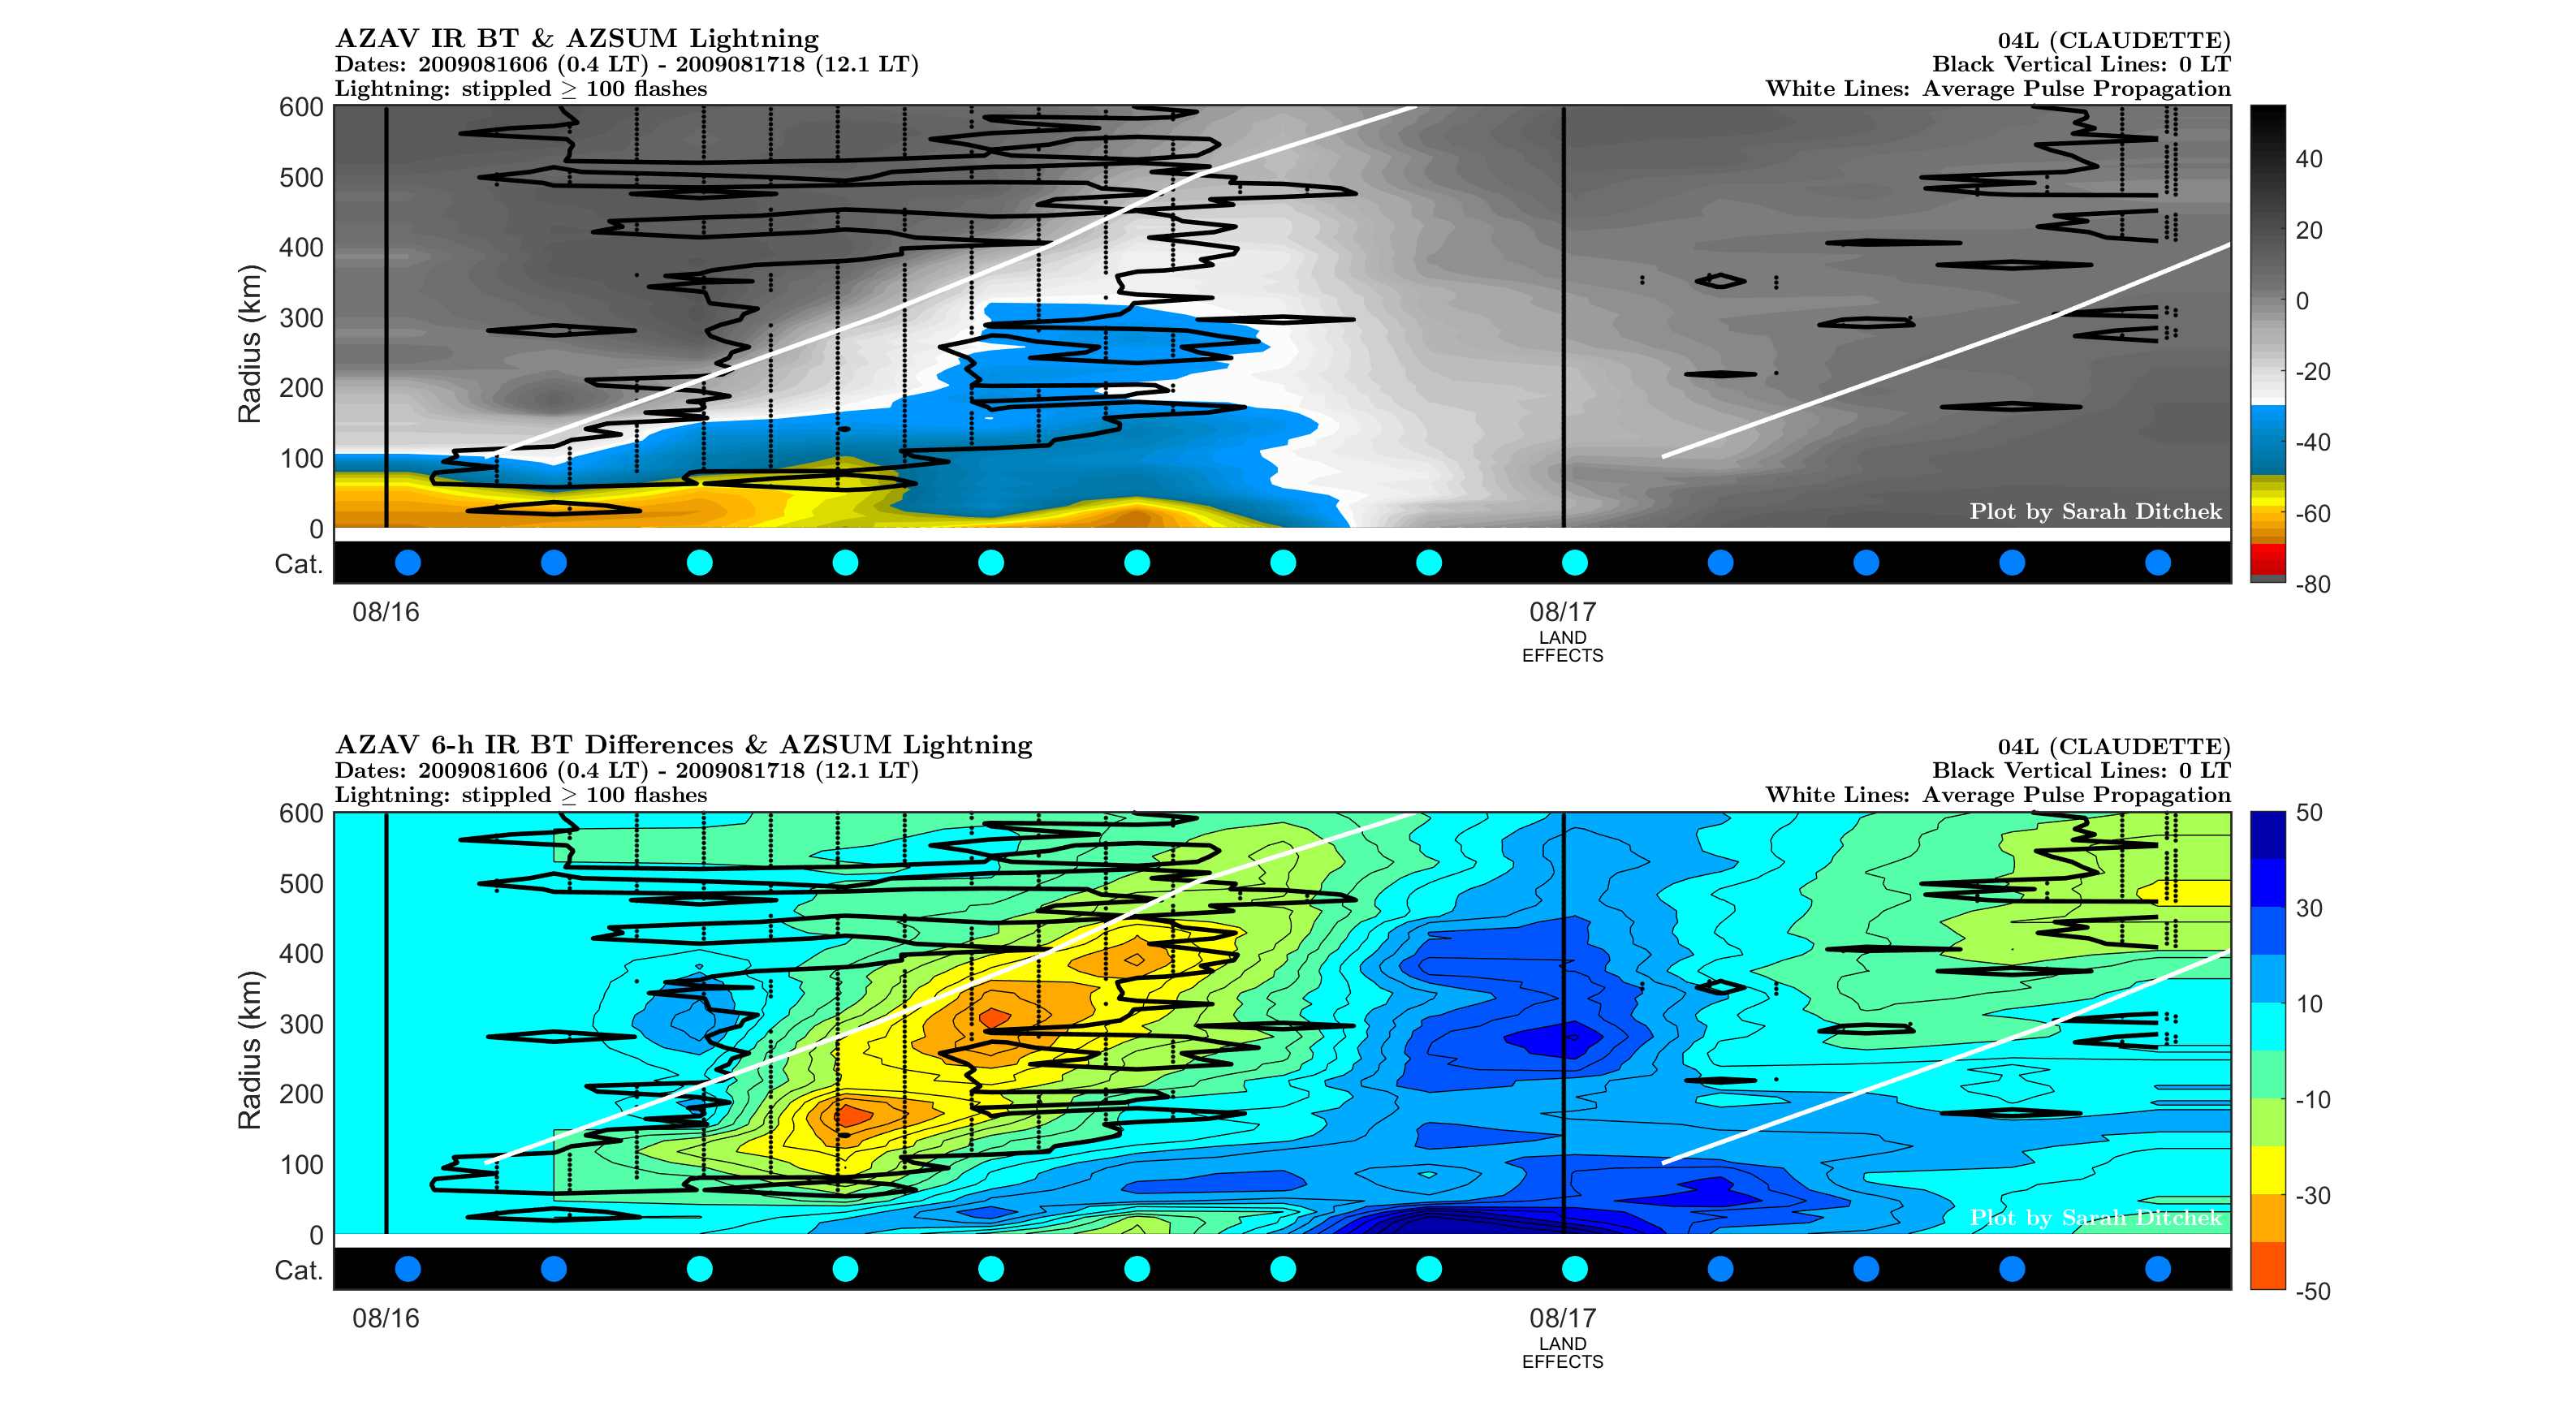
The above graphic depicts the azimuthally summed (AZSUM) WWLLN lightning flash data (stippled for values ≥ 25 flashes) overlaid onto azimuthally averaged (AZAV) GridSat-B1 (top) IR BT (°C) and (bottom) 6-h IR BT differences (°C) over the lifetime of a given storm.
- Black vertical lines correspond to 0 LT on each day.
- White lines indicate the average radius around which the pulse should occur by interpolating the extended version of the Dunion et al. (2014) diurnal clock (Ditchek et al. 2019a, Fig. 2b) to a temporal resolution of 0.1 h.
- Dark gray circles represent times when the storm was designated as a wave (WV), a disturbance (DB), or a low (LO). Dark gray squares represent times when the storm was designated as a subtropical depression (SD) or subtropical storm (SS). Dark gray diamonds represent times when the storm was designated as an extratropical storm (EX). The colored circles represent intensity according to the Saffir–Simpson hurricane wind scale (Simpson 1974) categories: tropical depression (TD; dark blue), tropical storm (TS; cyan), category 1 hurricane (C1; green), category 2 hurricane (C2; yellow), category 3 hurricane (C3; orange), category 4 hurricane (C4; red), and category 5 hurricane (C5; magenta). Intensity data were retrieved from HURDAT2.
- The pulse type (PT) classification (LLCP, LLWP, SLCP, SLWP, NP) and the electric activity (EA) classification (ACT, QUASI, or INACT) for each day are listed under the x-axis labels and were determined by the objective metrics in Ditchek et al. (2019a) and Ditchek et al. (2019b), respectively.
- Note that those two papers created objective metrics only for cases that satisfied the following criteria: 1) storms of tropical depression or greater strength, 2) storms that were not extratropical or subtropical, 3) storm times with storm centers south of 40°N, and 4) storm times before a storm made landfall for greater than 6 h. This archive applies the objective metrics to all storms and storm times for completeness, but additional research needs to be conducted to determine whether robust signals are found for those storms and storm times outside the scope of Ditchek et al. (2019a) and Ditchek et al. (2019b).
- For dates where landfall occurred, if <9 h were spent over ocean, then that date was classified as being impacted by land (LAND EFFECTS), so no pulse type or electric activity classification was given. Note that passage over areas of land for a brief period of time (e.g., the Yucatan Peninsula) was still given pulse type and electric activity classifications if the storm subsequently continued over ocean.
- If there is no text under a date, then the objective metrics could not be run for that date. This occurs when 1) a storm dissipates in the early morning, so there was not enough data available, 2) the storm center was too far north for a storm-centered data retrieval to occur (grids for these storm times were set to zero), or 3) data retrieved had missing values (grids for these storm times were set to zero).
Diurnal Pulse Evolution
Click the image below and use your right and left arrow keys to step through the images.
The above graphics depict GridSat-B1 (left) IR BT (°C) and (right) 6-h IR BT differences (°C) with overlaid WWLLN lightning ± 1.5 h (magenta dots) centered on the IR BT image time.
- Black range rings are overlaid on each image every 100 km from r=100–600 km.
- White range rings indicate the average radius around which the pulse should occur by interpolating the extended version of the Dunion et al. (2014) diurnal clock (Ditchek et al. 2019a, Fig. 2b) to a temporal resolution of 0.1 h.
- The pulse type (PT) classification (LLCP, LLWP, SLCP, SLWP, NP) and the electric activity (EA) classification (ACT, QUASI, or INACT) for each storm time are given in the top right and were determined by the objective metrics in Ditchek et al. (2019a) and Ditchek et al. (2019b), respectively.
- Note that those two papers created objective metrics only for cases that satisfied the following criteria: 1) storms of tropical depression or greater strength, 2) storms that were not extratropical or subtropical, 3) storm times with storm centers south of 40°N, and 4) storm times before a storm made landfall for greater than 6 h. This archive applies the objective metrics to all storms and storm times for completeness, but additional research needs to be conducted to determine whether robust signals are found for those storms and storm times outside the scope of Ditchek et al. (2019a) and Ditchek et al. (2019b).
- For dates where landfall occurred, if <9 h were spent over ocean, then that date was classified as being impacted by land (LAND EFFECTS), so no pulse type or electric activity classification was given. Note that passage over areas of land for a brief period of time (e.g., the Yucatan Peninsula) was still given pulse type and electric activity classifications if the storm subsequently continued over ocean.
- If "null" is listed, then 1) the storm center was too far north for a storm-centered data retrieval to occur (grids for these storm times were set to zero) or 2) data retrieved had missing values (grids for these storm times were set to zero).
- The storm name, intensity, and Saffir–Simpson hurricane wind scale (Simpson 1974) category are also given in the top right. Intensity data were retrieved from HURDAT2. Categories include tropical depression (TD), tropical storm (TS), category 1–5 hurricane (C1–C5), wave (WV), disturbance (DB), low (LO), subtropical depression (SD), subtropical storm (SS), and extratropical storm (EX).
- Shear Magnitude, Classification, and Heading from SHIPS:
- The p=200–850-hPa, r=0–500-km shear magnitude (S; m/s) is given in the top right. It is linearly interpolated to a temporal resolution of 3 h to match the temporal resolution of the GridSat-B1 dataset.
- A shear classification is included to the right of S and is based on the 1982–2017 shear distribution described in Ditchek et al. (2019a) where L is low shear (lower quartile - 4.4 m/s), M is moderate shear (interquartile range - 4.4–10.6 m/s), and H is high shear (upper quartile - 10.6 m/s).
- The shear heading (H; °), defined as the direction the shear vector is pointing towards, is also given in the top right. It is linearly interpolated to a temporal resolution of 3 h to match the temporal resolution of the GridSat-B1 dataset. In the SHIPS dataset, 0° is due north, and westerly shear has a value of 90° (due east).
- If no S or H are provided by SHIPS, the entry will say “null”.
- Note that the 6-h IR BT difference field’s colorbar resembles the conventional IR BT scale, where warmer colors represent colder cloud tops and cooler colors represent warmer cloud tops.