Image and Link Directory
Over the past several months there has been much discussion within the meteorological community on Sandy, from genesis through societal impact. During this time there has been a wealth of resources that have been used to document the storm. This page attempts to collect the most useful imagery in order to properly diagnose the storm's history and eventual outcome. Use these products as tools towards reaching a better understanding of the evolution of Sandy.
I will be attempting to modify this page for ease of view the next few days by adding dates to all these images so you know when they were created.
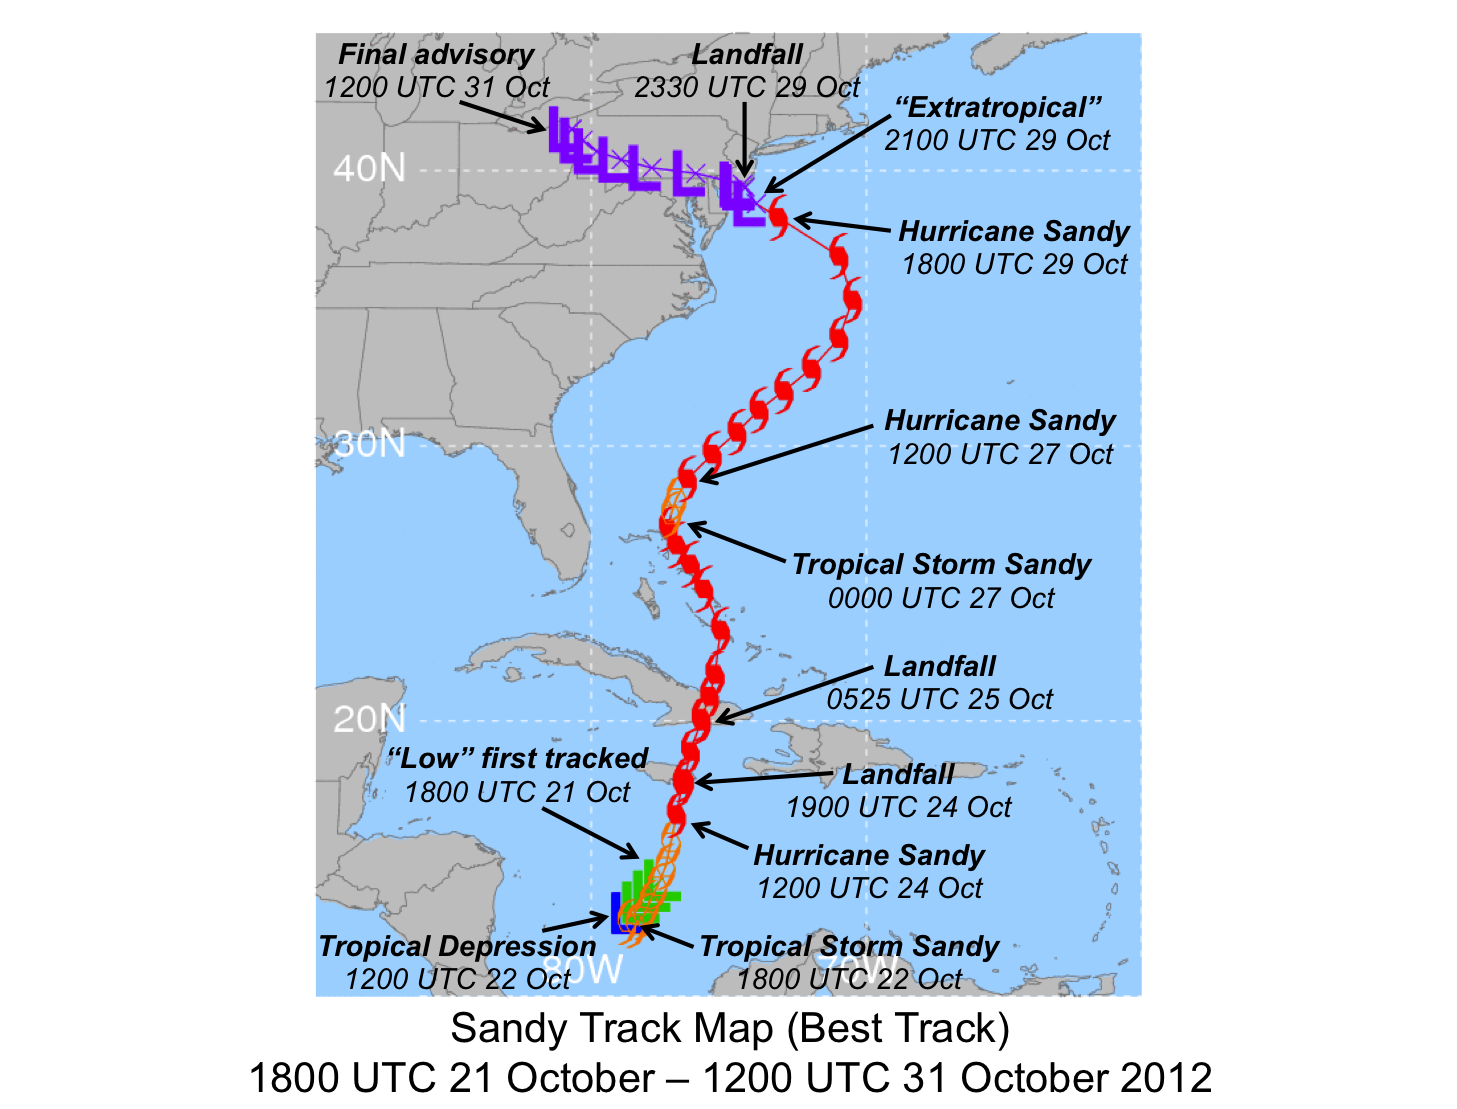
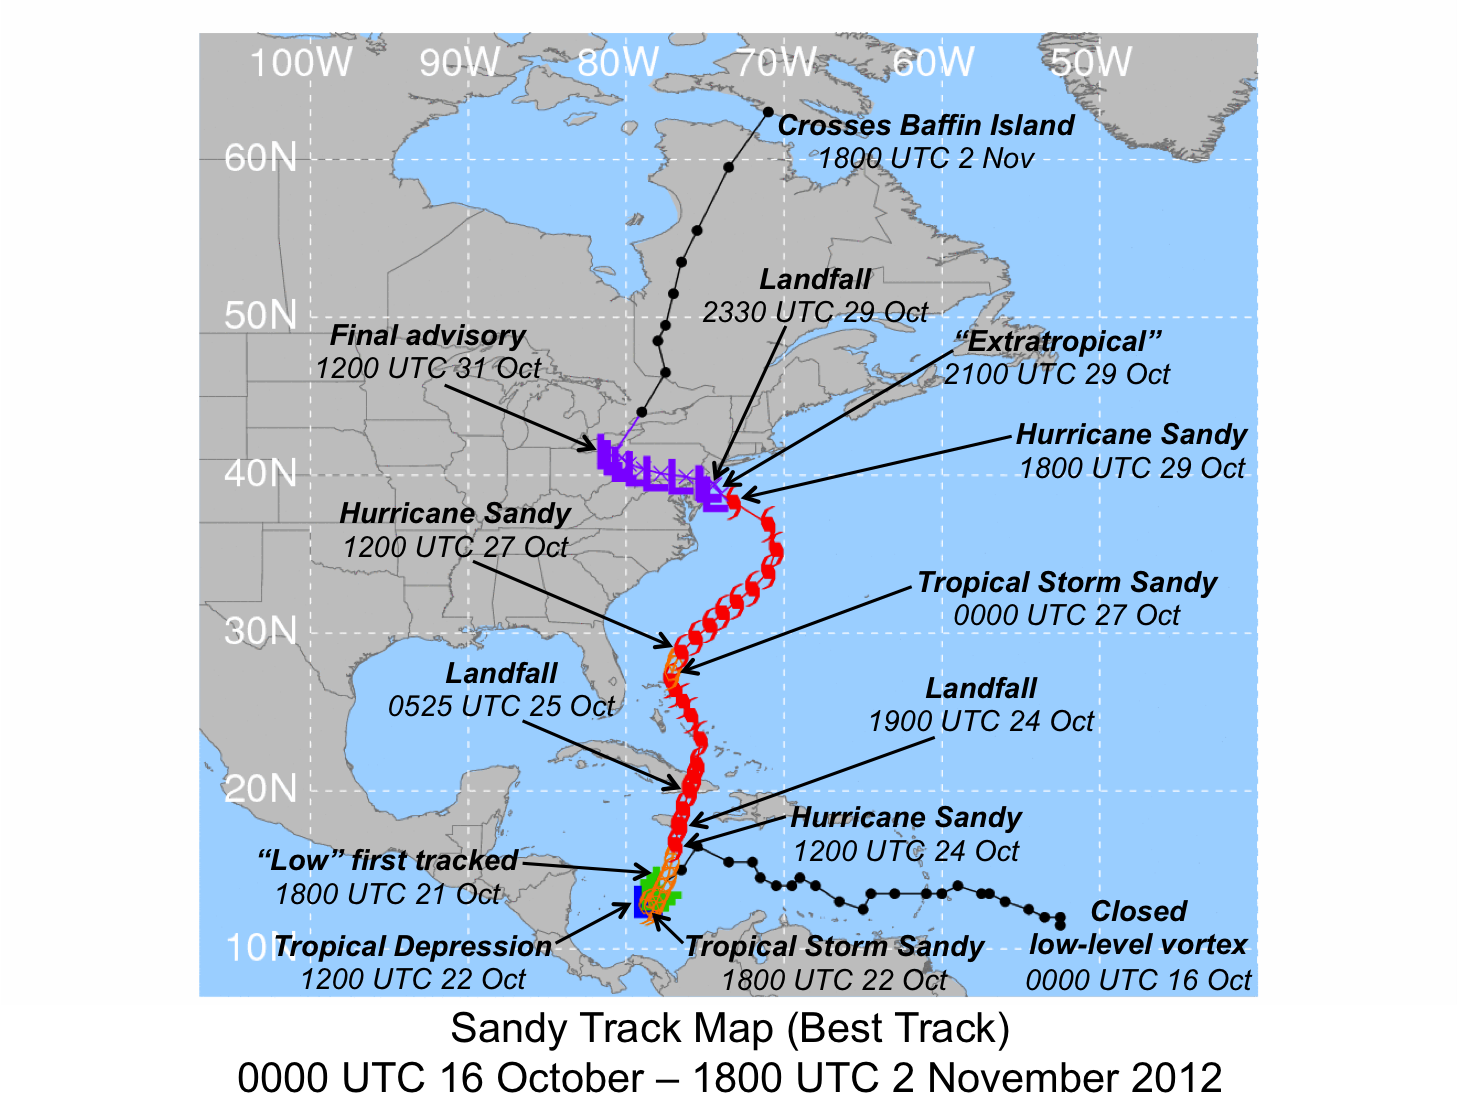
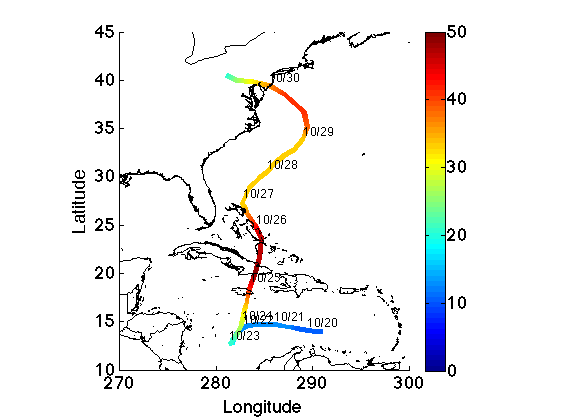
Track Maps
In-House Tracks
- Alicia Bentley(Added 27 Mar 2013) Alicia Bentley (extended)(Added 27 Mar 2013) Brian Tang(Added 27 Mar 2013)
Satellite Imagery
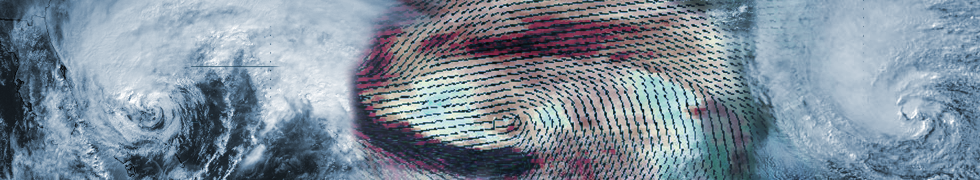
CIMMS Satellite Blog on Sandy
- 24 October 25 October 26 October 27 October 29 October Lifecycle Power Outages Gulf Stream Impact
Navy Research Lab
- WV Imagery in 30 Minute Intervals(Added 27 Mar 2013) IR Imagery in 30 Minute Intervals(Added 27 Mar 2013)
In-House Satellite Imagery
- Storm Relative IR and Visible Loops (Patrick Duran)(Added 26 Feb 2013) Large Scale IR View (Philippe Papin)(Added 12 Feb 2013)
Radar Animations and Imagery
- GEMPAK Radar Animation (27-31 Oct) - (Jaymes Kenyon)
- Reflectivity Loop at KRLX (Charleston, WV) / 2000 ft Winds (Magenta) / 9000 ft Winds (Green) / (28-31 Oct)- (Justin Minder)
- Correlation Coefficient Loop at KRLX (Charleston, WV) / 2000 ft Winds (Magenta) / 9000 ft Winds (Green) / (28-31 Oct)- (Justin Minder)
- Radial Velocity Loop at KRLX (Charleston, WV) / 2000 ft Winds (Magenta) / 9000 ft Winds (Green) / (28-31 Oct)- (Justin Minder)
Presentations and Reports
2013 Annual AMS Meeting
- Research Community Perspective of Life Cycle of Sandy
Townhall Meetings: Sandy Presentations and Discussion
National Hurricane Center
- Hurricane Sandy Tropical Cyclone Report
ECMWF
- The Role of Satellite Data in the Forecasting of Hurricane Sandy(Added 23 Mar 2013)
In-Situ Observations
Dropsondes and Recon Observations
- Hurricane Research Division Hurricane Sandy Page
Dropsondes In Hurricane Sandy
In House Synoptic-Scale Imagery
Hannah Attard
- PV Advection Loops (By Total / Nondivergent / Irrotational Winds) from 200-300 hPa(Added 09 Apr 2013)
Alicia Bentley
- DT Theta / Wind / Low Level Vort 250 hPa Wind / Height / Temp 250 hPa Wind / Thickness / SLP 500 hPa Vort / Temp / Height / Wind 700 hPa PW / Wind / Height / Temp 850 hPa Frontogenesis / Height / Temp 925 hPa Wind / Height / Temp Thermal Vort / Thickness / 925 hPa Height PV1/PV2/PV3 Calculations (.pptx)(Added 20 Feb 2013) Sandy Crossections plotting PV/Theta/Wind (Added 20 Feb 2013)
Hazel Comparison Graphics (Alicia Bentley)
- 250 hPa Wind / Height / Temp 500 hPa Vort / Wind / Height / Temp 700 hPa PW / Wind / Height / Temp 850 hPa Frontogenesis / Height / Temp 925 hPa Wind / Height / Temp 250 hPa Wind / Thickness / SLP
Philippe Papin
- DT Theta / Wind / Low Level Vort 200 hPa Vort / Height / 1000-500 hPa Thickness SLP / PW / 250 hPa Wind / PV / Irr. Wind / 500 hPa Vert. Vel. 500 hPa Vort / Height / Wind / Vert. Vel. 850 hPa Temp / Wind / Vert. Vel. / SLP 925 hPa RH / Height / Wind / Temperature 850 hPa Circulation/ Vort / Wind 10-20 m/s 850 hPa Tangential Winds with Circulation Center and Best Track Center (Added 09 Apr 2013)
Nick Schiraldi
Normalized 800 hPa Height / Anomalous Wind / Precipitable Water
200 hPa Height Anomalies / 300 hPa Wind Anomalies / OLR Anomalies
Larry Gloeckler
DT Theta / Winds / 900-800 Layer Mean Relative Vorticity (Pacific View)
DT Theta / Winds / 900-800 Layer Mean Relative Vorticity (Atlantic View)
200 hPa Geopotential Height / Winds / Anomalous OLR (Atlantic View)
Chip Helms
- Cyclonic and Anticyclonic Center Locations(Added 26 Feb 2013) Vorticity / Okubo-Weiss(Added 26 Feb 2013) Vorticity / Okubo-Weiss (Large-Scale View)(Added 26 Feb 2013) Okubo-Weiss(Added 26 Feb 2013) Divergence(Added 26 Feb 2013) Relative Humidity / Okubo-Weiss(Added 26 Feb 2013) Relative Humidity / Okubo-Weiss (Large-Scale View)(Added 26 Feb 2013) Multi-Plot Hurricane Sandy (850 hPa Wind, Tangential Wind, Meridional Wind, Azimuthal Averages, System Coordinate Plots)(Added 17 Apr 2013)