to the Warm Season Rainfall Climatology of the Southwest United States


Hurricane Lester 1992
Left: 0201 UTC 23 August 1992 IR satellite image of Hurricane Lester
Center: Photograph of Mount Harvard, CO with 40" of snow from the remnants of Lester
Right: 21-25 August 1992 total NCEP/CPC UPD precipitation (mm)
Introduction
This project grew out of a research class conducted by Dr. Lance Bosart at SUNY Albany during the fall of 2002. The objective of this class is to investigate a relevant and under-researched topic in synoptic meteorology. Previous class topics have included the Superstorm of 1993 (Bosart et al. 1996; Dickinson et al. 1997; Schultz et al. 1997) and the Southern Hemisphere split jet (Bals-Elsholz et al. 2001). In the fall of 2002, the topic of choice was the North American monsoon system (NAMS).
While the NAMS is not nearly as strong or as large as its south Asian counterpart, it still features all of the atmospheric circulation characteristics of a monsoon system: 1) a reversal of the north-south temperature gradient due to strong heating of the elevated terrain of the Sierra Madre and Rocky Mountains (Li and Yanai 1996), 2) a northward shift in the axis of the subtropical ridge and westward expansion of the Atlantic Bermuda high (Bryson and Lowry 1955; Tang and Reiter 1984; Higgins et al. 1997), and 3) a reversal of the mean low-level flow over northern Mexico, the Gulf of California and extreme southern Arizona (Bryson and Lowry 1995; Douglas et al. 1993). Associated with these changes in the large scale circulation, moisture is advected into the southwest United States (US) northward from the Gulf of California at low levels and eastward from the Gulf of Mexico at mid-levels (Rasmusson 1967; Carleton et al. 1990; Schmitz and Mullen 1996). With this influx of moisture, the precipitation over the region rapidly increases in late June, peaks in mid-August and slowly wanes through the month of September, as shown by the average (1958-2003) daily precipitation time series over the southwest US shown below (top panel). This warm season, monsoonal precipitation accounts for over 60% of the yearly rainfall in parts of the southwest US (below, lower panel), and thus understanding the mechanisms that produce precipitation during the monsoon is of paramount importance for flood forecasting and water management.

Annual cycle of the average (1958-2003) daily precipitation (blue) for the southwest US. The black solid curve is the 15 day running mean and the black dashed line is the daily average.
As the southwest US lies on the northern fringe of the NAMS region, transient disturbances play a significant role in the rainfall climatology of the region. The most studied transient forcing mechanism for precipitation in the NAMS region is the Gulf of California moisture surge. As first discussed by Hales (1972, 1974), the surges are accompanied by strong southerly flow, higher dew points, cooler temperatures and higher pressure, propagating northward along the Gulf. In recent years, several observational and numerical modeling studies (e.g. Fuller and Stensrud 2000; Anderson et al. 2000; Higgins and Shi 2005; Bordoni and Stevens 2006) have documented 3-5 surge episodes per month, and have found the surges to be associated with tropical easterly waves or eastern North Pacific tropical cyclones (TCs) passing to the south of the Gulf. Half of the surges documented by Anderson et al. (2000) and Higgins and Shi (2005) were associated with south-southeasterly flow around the eastern half of TCs in the eastern Pacific. These storms traveled west-northwest past the mouth of the Gulf of California, rarely crossing 25° N before dissipating.
As the eastern North Pacific is the most active ocean basin for TC development (Molinari et al. 2000) and TCs have been shown to play a large role in transient moisture surges into the NAMS region, an obvious question to ask is whether TCs themselves ever travel far enough north to directly impact the southwest US. Englehart and Douglas (2001) examined the influence of eastern North Pacific TCs on the monsoon seasonal rainfall in western Mexico. They found that an average of 3-4 TCs bring rainfall to the region every summer, accounting for ~30% of the summer rain along the coast, decreasing inland to between 5% and 10% in the Sierra mountains. While individual storms that made landfall along the Baja and Californian coasts have been studied (Farfán and Zehnder 2001; Daida and Barnes 2003; Farfán 2004, 2005; Farfán and Cortez 2005), no long term climatology of TC rainfall in the southwest US has been undertaken.
Data and Methodology
The six-hourly latitude, longitude and intensity for each eastern North Pacific TC from 16 June to 15 October 1958-2003 was obtained from the National Hurricane Center/Tropical Prediction Center (NHC/TPC) best track data set. A subset of storms that crossed 25° N was chosen as a list of potential rainmakers for the southwest US. This choice of latitude is somewhat arbitrary, but was chosen to narrow the field of storms because it represents the southern latitude approximately 600 km from the US border with Mexico. A similar distance of 550 km was used by Englehart and Douglas (2001) to define TC associated rainfall in western Mexico.
Daily total precipitation (from 1200 UTC to 1200 UTC) was taken from the National Centers for Environmental Prediction/Climate Prediction Center (NCEP/CPC) Unified Precipitation Dataset (UPD). Over 5,000 daily rainfall measurements from River Forecast Centers and the Climate Anomaly Database were used to construct the .25° x .25° gridded data set that covers the contiguous United States (20°-60° N, 60°-140° W). No formal evaluation of the UPD appears in the refereed literature, but several studies conducted by students at SUNY Albany indicate that although the mesoscale details of the precipitation are not captured (i.e. specific amounts), the dataset is useful for synoptic scale interpretations such as overall rainfall distribution.
Dynamic and thermodynamic fields were obtained from the six-hourly ERA-40 reanalysis (Uppala et al. 2005) with a horizontal resolution of 1.125 ° x 1.125°. Maps of 700 hPa heights and relative vorticity were used to track the potential rainmaking TCs after they were downgraded and no longer followed by NHC/TPC.
Daily maps of UPD rainfall were plotted from the day before the potential rainmaking TC crossed 25° N for 10 days. The maps, together with the NHC and ERA40 tracks of the storm, were then analyzed to determine on which, if any, days rainfall associated with the TC fell in the region. This analysis revealed 35 east Pacific TCs brought significant rainfall to the southwest US in the 46 years between 1958 and 2003. The table below contains the list of storms, the dates they brought rainfall to the southwest and the states that received more than 25% of their warm season (defined as 16 June - 15 October) rainfall from that TC.
Storm Climatology
The NHC/TPC best tracks of the 35 TCs that impacted the southwest US are shown below. The top panel shows the tracks without labels, while the bottom panel shows the storm tracks labeled by the first letter of the storm name and year (i.e.R89 is H Raymond 1989 ) at the beginning and end of the track.


This project grew out of a research class conducted by Dr. Lance Bosart at SUNY Albany during the fall of 2002. The objective of this class is to investigate a relevant and under-researched topic in synoptic meteorology. Previous class topics have included the Superstorm of 1993 (Bosart et al. 1996; Dickinson et al. 1997; Schultz et al. 1997) and the Southern Hemisphere split jet (Bals-Elsholz et al. 2001). In the fall of 2002, the topic of choice was the North American monsoon system (NAMS).
While the NAMS is not nearly as strong or as large as its south Asian counterpart, it still features all of the atmospheric circulation characteristics of a monsoon system: 1) a reversal of the north-south temperature gradient due to strong heating of the elevated terrain of the Sierra Madre and Rocky Mountains (Li and Yanai 1996), 2) a northward shift in the axis of the subtropical ridge and westward expansion of the Atlantic Bermuda high (Bryson and Lowry 1955; Tang and Reiter 1984; Higgins et al. 1997), and 3) a reversal of the mean low-level flow over northern Mexico, the Gulf of California and extreme southern Arizona (Bryson and Lowry 1995; Douglas et al. 1993). Associated with these changes in the large scale circulation, moisture is advected into the southwest United States (US) northward from the Gulf of California at low levels and eastward from the Gulf of Mexico at mid-levels (Rasmusson 1967; Carleton et al. 1990; Schmitz and Mullen 1996). With this influx of moisture, the precipitation over the region rapidly increases in late June, peaks in mid-August and slowly wanes through the month of September, as shown by the average (1958-2003) daily precipitation time series over the southwest US shown below (top panel). This warm season, monsoonal precipitation accounts for over 60% of the yearly rainfall in parts of the southwest US (below, lower panel), and thus understanding the mechanisms that produce precipitation during the monsoon is of paramount importance for flood forecasting and water management.
Annual cycle of the average (1958-2003) daily precipitation (blue) for the southwest US. The black solid curve is the 15 day running mean and the black dashed line is the daily average.
Average
(1958-2003) warm season (16 June – 15 October)
contribution to the yearly precipitation (%).
As the southwest US lies on the northern fringe of the NAMS region, transient disturbances play a significant role in the rainfall climatology of the region. The most studied transient forcing mechanism for precipitation in the NAMS region is the Gulf of California moisture surge. As first discussed by Hales (1972, 1974), the surges are accompanied by strong southerly flow, higher dew points, cooler temperatures and higher pressure, propagating northward along the Gulf. In recent years, several observational and numerical modeling studies (e.g. Fuller and Stensrud 2000; Anderson et al. 2000; Higgins and Shi 2005; Bordoni and Stevens 2006) have documented 3-5 surge episodes per month, and have found the surges to be associated with tropical easterly waves or eastern North Pacific tropical cyclones (TCs) passing to the south of the Gulf. Half of the surges documented by Anderson et al. (2000) and Higgins and Shi (2005) were associated with south-southeasterly flow around the eastern half of TCs in the eastern Pacific. These storms traveled west-northwest past the mouth of the Gulf of California, rarely crossing 25° N before dissipating.
As the eastern North Pacific is the most active ocean basin for TC development (Molinari et al. 2000) and TCs have been shown to play a large role in transient moisture surges into the NAMS region, an obvious question to ask is whether TCs themselves ever travel far enough north to directly impact the southwest US. Englehart and Douglas (2001) examined the influence of eastern North Pacific TCs on the monsoon seasonal rainfall in western Mexico. They found that an average of 3-4 TCs bring rainfall to the region every summer, accounting for ~30% of the summer rain along the coast, decreasing inland to between 5% and 10% in the Sierra mountains. While individual storms that made landfall along the Baja and Californian coasts have been studied (Farfán and Zehnder 2001; Daida and Barnes 2003; Farfán 2004, 2005; Farfán and Cortez 2005), no long term climatology of TC rainfall in the southwest US has been undertaken.
Data and Methodology
The six-hourly latitude, longitude and intensity for each eastern North Pacific TC from 16 June to 15 October 1958-2003 was obtained from the National Hurricane Center/Tropical Prediction Center (NHC/TPC) best track data set. A subset of storms that crossed 25° N was chosen as a list of potential rainmakers for the southwest US. This choice of latitude is somewhat arbitrary, but was chosen to narrow the field of storms because it represents the southern latitude approximately 600 km from the US border with Mexico. A similar distance of 550 km was used by Englehart and Douglas (2001) to define TC associated rainfall in western Mexico.
Daily total precipitation (from 1200 UTC to 1200 UTC) was taken from the National Centers for Environmental Prediction/Climate Prediction Center (NCEP/CPC) Unified Precipitation Dataset (UPD). Over 5,000 daily rainfall measurements from River Forecast Centers and the Climate Anomaly Database were used to construct the .25° x .25° gridded data set that covers the contiguous United States (20°-60° N, 60°-140° W). No formal evaluation of the UPD appears in the refereed literature, but several studies conducted by students at SUNY Albany indicate that although the mesoscale details of the precipitation are not captured (i.e. specific amounts), the dataset is useful for synoptic scale interpretations such as overall rainfall distribution.
Dynamic and thermodynamic fields were obtained from the six-hourly ERA-40 reanalysis (Uppala et al. 2005) with a horizontal resolution of 1.125 ° x 1.125°. Maps of 700 hPa heights and relative vorticity were used to track the potential rainmaking TCs after they were downgraded and no longer followed by NHC/TPC.
Daily maps of UPD rainfall were plotted from the day before the potential rainmaking TC crossed 25° N for 10 days. The maps, together with the NHC and ERA40 tracks of the storm, were then analyzed to determine on which, if any, days rainfall associated with the TC fell in the region. This analysis revealed 35 east Pacific TCs brought significant rainfall to the southwest US in the 46 years between 1958 and 2003. The table below contains the list of storms, the dates they brought rainfall to the southwest and the states that received more than 25% of their warm season (defined as 16 June - 15 October) rainfall from that TC.
| Year |
Storm Name |
Dates |
States receiving >25% of summer rain |
| 1958 |
TS
10 |
9/10
- 9/14 |
AZ
CO NM UT |
| H
11 |
10/4
- 10/6 |
AZ |
|
| 1959 |
H
10 |
9/11
- 9/15 |
AZ
CA NV |
| 1960 |
H
Diana |
8/19
- 8/23 |
AZ
CO |
| 1962 |
TS
Claudia |
9/22
- 9/26 |
AZ
CA NM NV |
| 1963 |
TS
Jen-Kath |
9/17
- 9/21 |
AZ
CA NV UT |
| 1965 |
H
Emily |
9/4
- 9/7 |
UT |
| 1966 |
H
Kirsten |
9/28
- 10/2 |
- |
| 1967 |
H
Katrina |
9/1
- 9/5 |
AZ
CA NV |
| 1968 |
TS
Hyacinth |
8/19
- 8/21 |
AZ |
| H
Pauline |
10/2
- 10/5 |
AZ
CA UT |
|
| 1970 |
TS
Norma |
9/3
- 9/7 |
AZ
CO NM UT |
| 1971 |
H
Olivia |
9/29
- 10/1 |
AZ
CA CO NM UT |
| 1972 |
H
Hyacinth |
9/6
- 9/10 |
CA
CO |
| H
Joanne |
10/5
- 10/7 |
AZ
CA CO NM UT |
|
| 1976 |
H
Kathleen |
9/10
- 9/12 |
AZ
CA NV |
| H
Liza |
10/1
- 10/3 |
NV
UT |
|
| 1977 |
H
Doreen |
8/15
- 8/18 |
AZ
CA NV UT |
| TS
Glenda |
9/26
- 9/28 |
AZ |
|
| H
Heather |
10/6
- 10/8 |
AZ
CA |
|
| 1982 |
H
Olivia |
9/24
- 9/28 |
CA
NV UT |
| 1983 |
H
Manuel |
9/18
- 9/20 |
CA |
| 1984 |
H
Marie |
9/9
- 9/12 |
AZ
CA NV |
| H
Norbert |
9/25
- 9/27 |
AZ |
|
| 1986 |
H
Newton |
9/23
- 9/26 |
AZ
CA CO NV UT |
| 1989 |
H
Raymond |
10/4
- 10/6 |
AZ
CO NM |
| 1992 |
H
Lester |
8/21
- 8/25 |
AZ
CA CO NM UT |
| 1993 |
H
Hilary |
8/26
- 8/30 |
AZ
CACO NM UT |
| 1995 |
H
Ismael |
9/14
- 9/16 |
NM |
| 1996 |
H
Fausto |
9/14
- 9/16 |
AZ
UT |
| 1997 |
H
Nora |
9/24
- 9/27 |
AZ
CA NV |
| 1998 |
H
Isis |
9/3
- 9/7 |
AZ
CA NV UT |
| 1999 |
H
Hilary |
9/22
- 9/24 |
AZ
CA |
| 2003 |
H
Igancio |
8/26
- 8/29 |
AZ
CA NV |
| H
Marty |
9/24
- 9/26 |
AZ |
Storm Climatology
The NHC/TPC best tracks of the 35 TCs that impacted the southwest US are shown below. The top panel shows the tracks without labels, while the bottom panel shows the storm tracks labeled by the first letter of the storm name and year (i.e.R89 is H Raymond 1989 ) at the beginning and end of the track.
As can be seen in the
figures, all of the southwest rainmakers cross 25°N as
tropical systems, but only slightly more than half cross
30°N, and a mere 26% (9/35) have the end of
their tropical tracks over the continental US. This
sharp decrease in storms north of 25°N is
mainly due to the sharp decrease in sea surface
temperatures and increase in vertical wind shear as the
storms move north. Indeed, using the best track data
and 1° x 1° grid boxes, the figure below
indicates that the return rate for a TC of any intensity
to the US/Mexico border is 5 years (figure provided by M.
Dickinson).

To put these rare
events in context with TC activity in the eastern
North Pacific as a whole, the plot below shows the
tracks of all TCs that formed east of 160°
W and did not cross the Date Line from 16 June to 15
October 1958-2003. The tracks in red are the TCs
that brought rainfall to the southwest US.

There are a total of 565 tracks on the plot, indicating that only 6% of all east Pacific TCs impact the US. This number is not surpring considering the mean genesis position (15.3° N, 110.7° W) and motion (slightly north of due west) of east Pacific storms. TCs that eventually affect the southwest US form ~7° further east than the mean (significant at the 99.9% level), but only .6° further north (significant at the 90% level). The mean motion of these storms is initially west-northwest or northwest and they begin to curve north or even northeast between 20° N and 25° N.
The TCs that affect the soutwest are also unique in the time of the season they are most likely to strike. The two plots below show the number of days on which rainfall associated with a TC fell in the southwest (left panel) and the number of days at least one TC was active in the east Pacific (right panel). The days have been grouped into two week periods from 16 June to 15 October.


By far, the most likely time for TC rainfall in the southwest US is during the month of September. This peak in rainfall occurs during the late season, secondary peak in the number of east Pacific TCs in late August and September. The number of TC days and the number of days with TC rainfall drops significantly during the first two weeks in October. The peak in the east Pacific TC season is during the last two weeks of July, but no TCs during the 46 years studied hit the southwest during this period. This discrepancy suggests that the large scale flow pattern necessary to turn the storms northward is much more likely at the end of the TC season, as the atmosphere transitions to a fall pattern in the North Hemisphere.
Rainfall distributions
The 35 TCs that brought rainfall to the southwest US possess a wide variety of rainfall distributions from southwest-northeast oriented streaks extending well into the central US, to isolated blobs along the US/Mexico border. Plots of the storm total precipitation (mm) and percent contribution to the warm season for each TC are shown on the following pages: 1950s, 1960s, 1970s, 1980s, 1990s, and 2000s. The storm total precipitation maps may also be viewed grouped according to two common precipitation distributions: Southwest-Northeast swath and California-Nevada track.
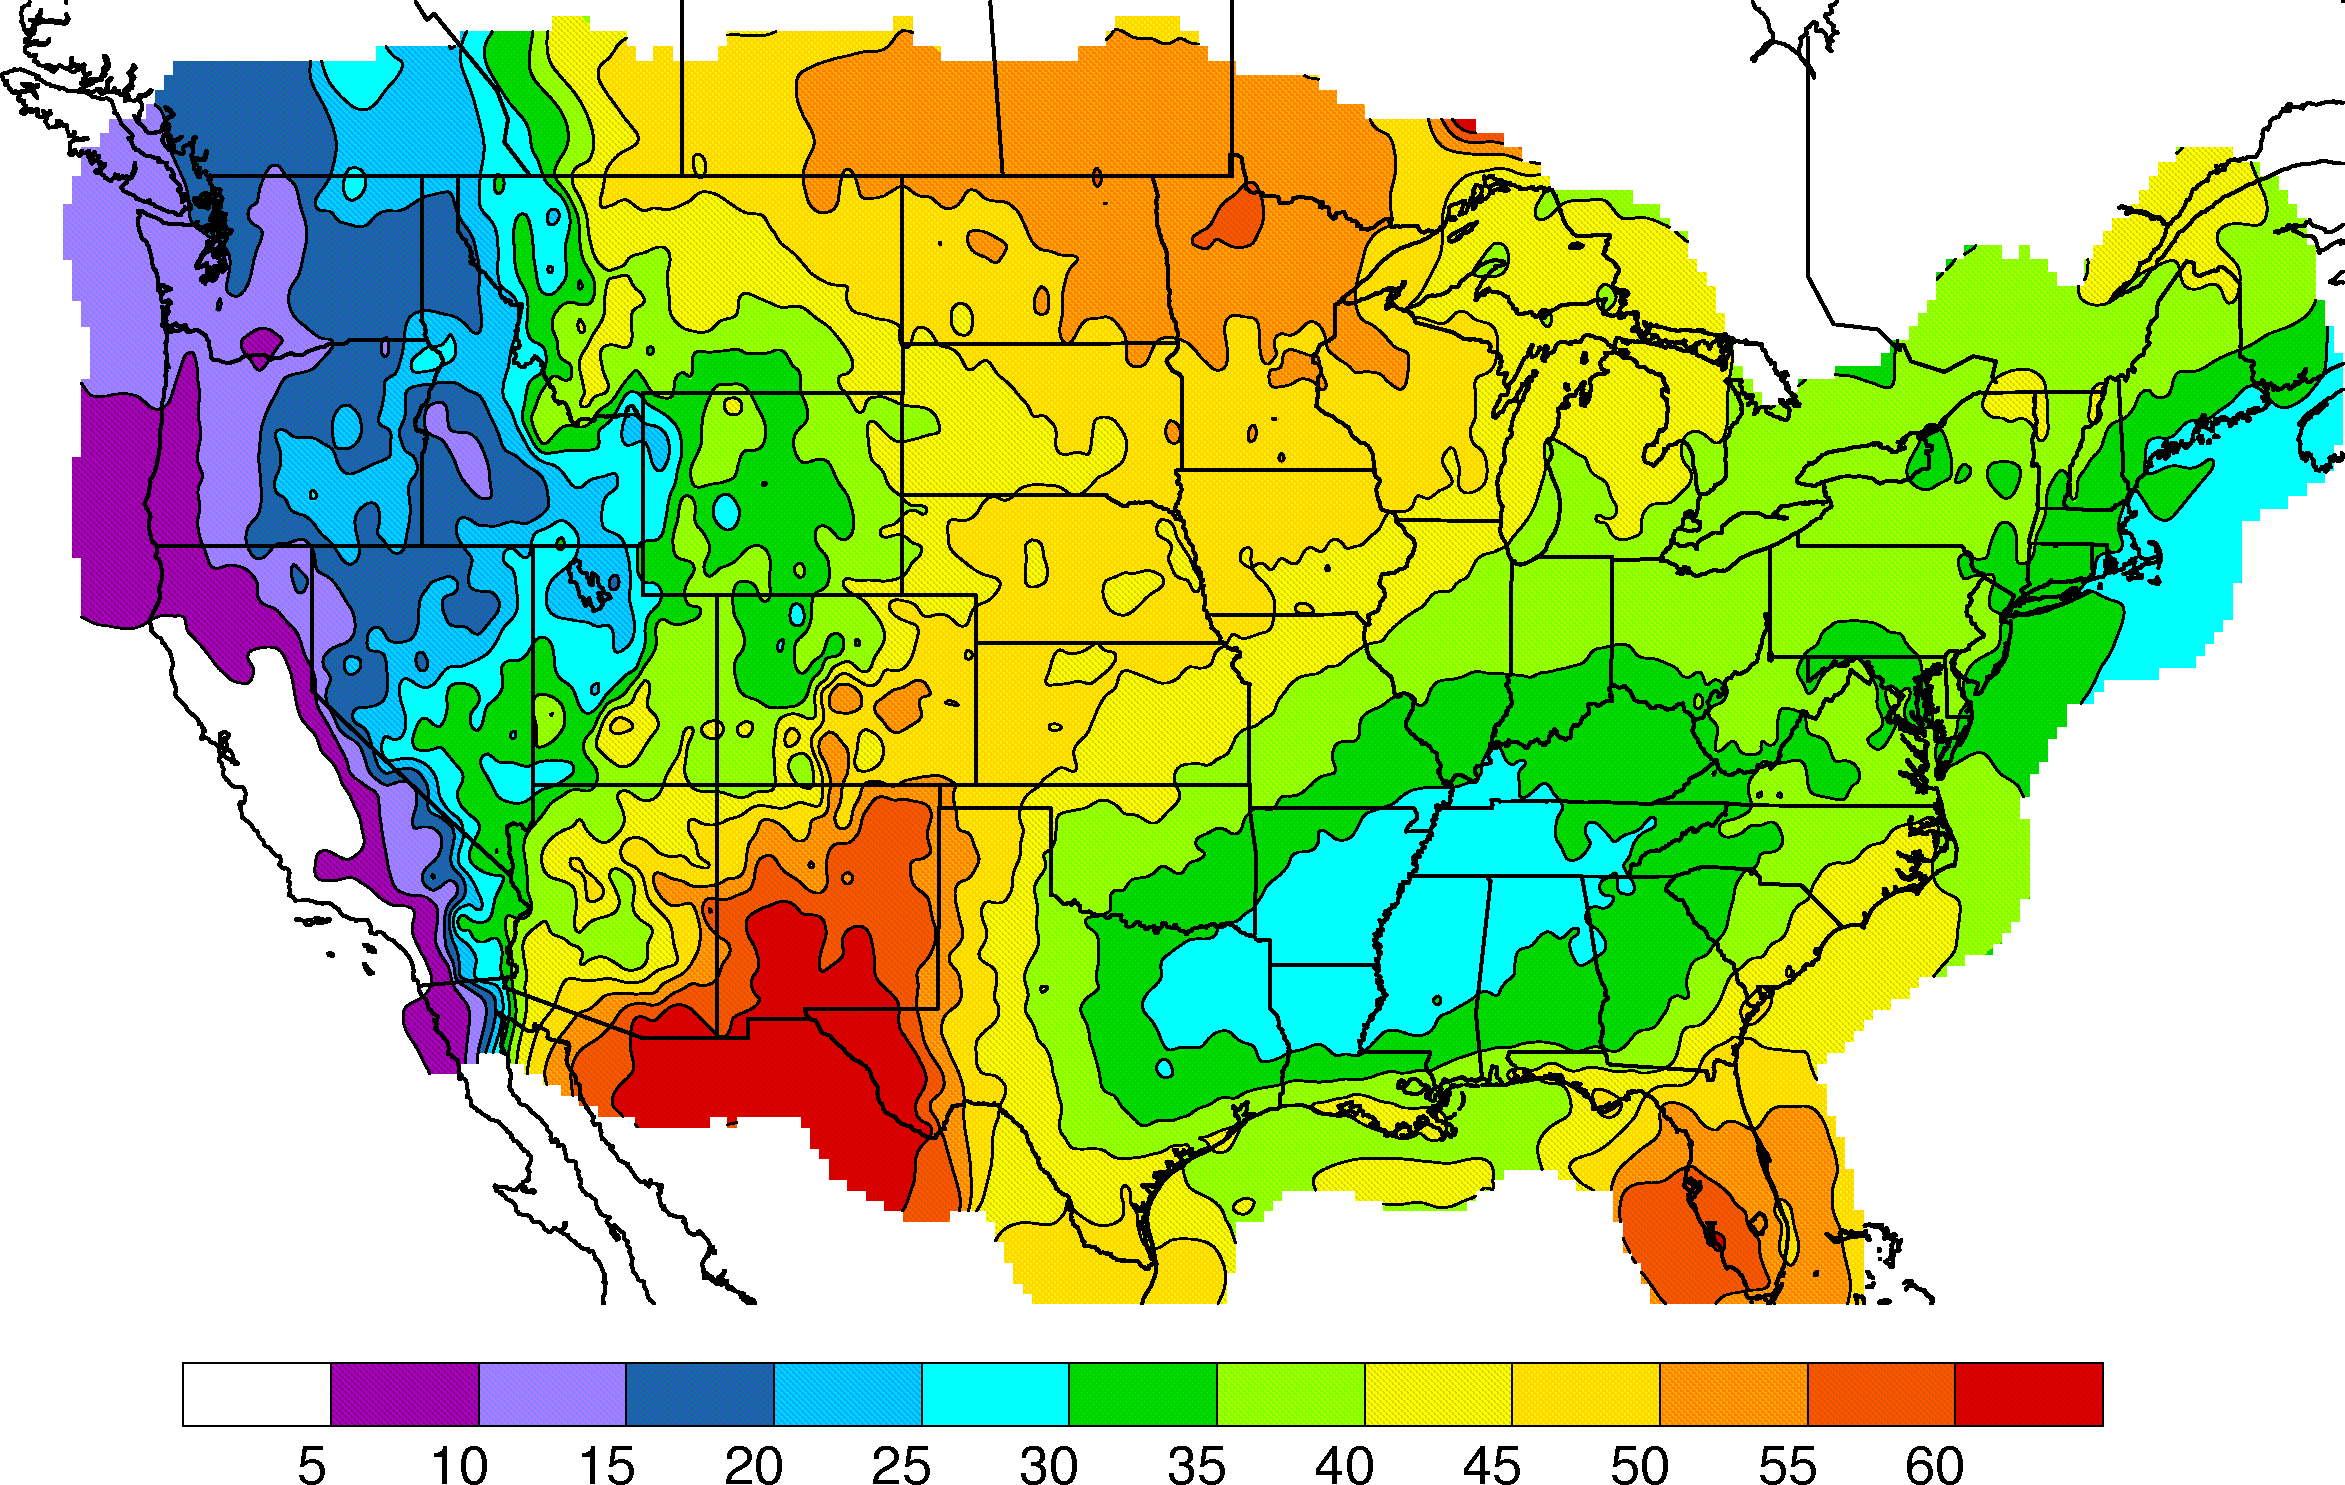
Despite the large variation in the distribution of TC precipitation in the southwest, if the percent contribution of each TC to the warm season precipitation total is averaged over all 35 storms (top panel below), the two main precipitation tracks pointed out above are evident: one extending northeast from extreme southwest Arizona, through the northwest corner of New Mexico and into southwestern Colorado, and the other extending north-northwest from southern to central California and into southern Nevada. The average contribution of TCs to the warm season precipitation increases from east to west, accounting for less than 5% of the rainfall in eastern New Mexico and increasing to more than 20% in extreme western Arizona and southern California to the Pacific Ocean. This east to west gradient mirrors the gradient in average warm season precipitation totals in this region (bottom panel below) which range from over 200 mm in the east to less than 25 mm along the Pacific coast.

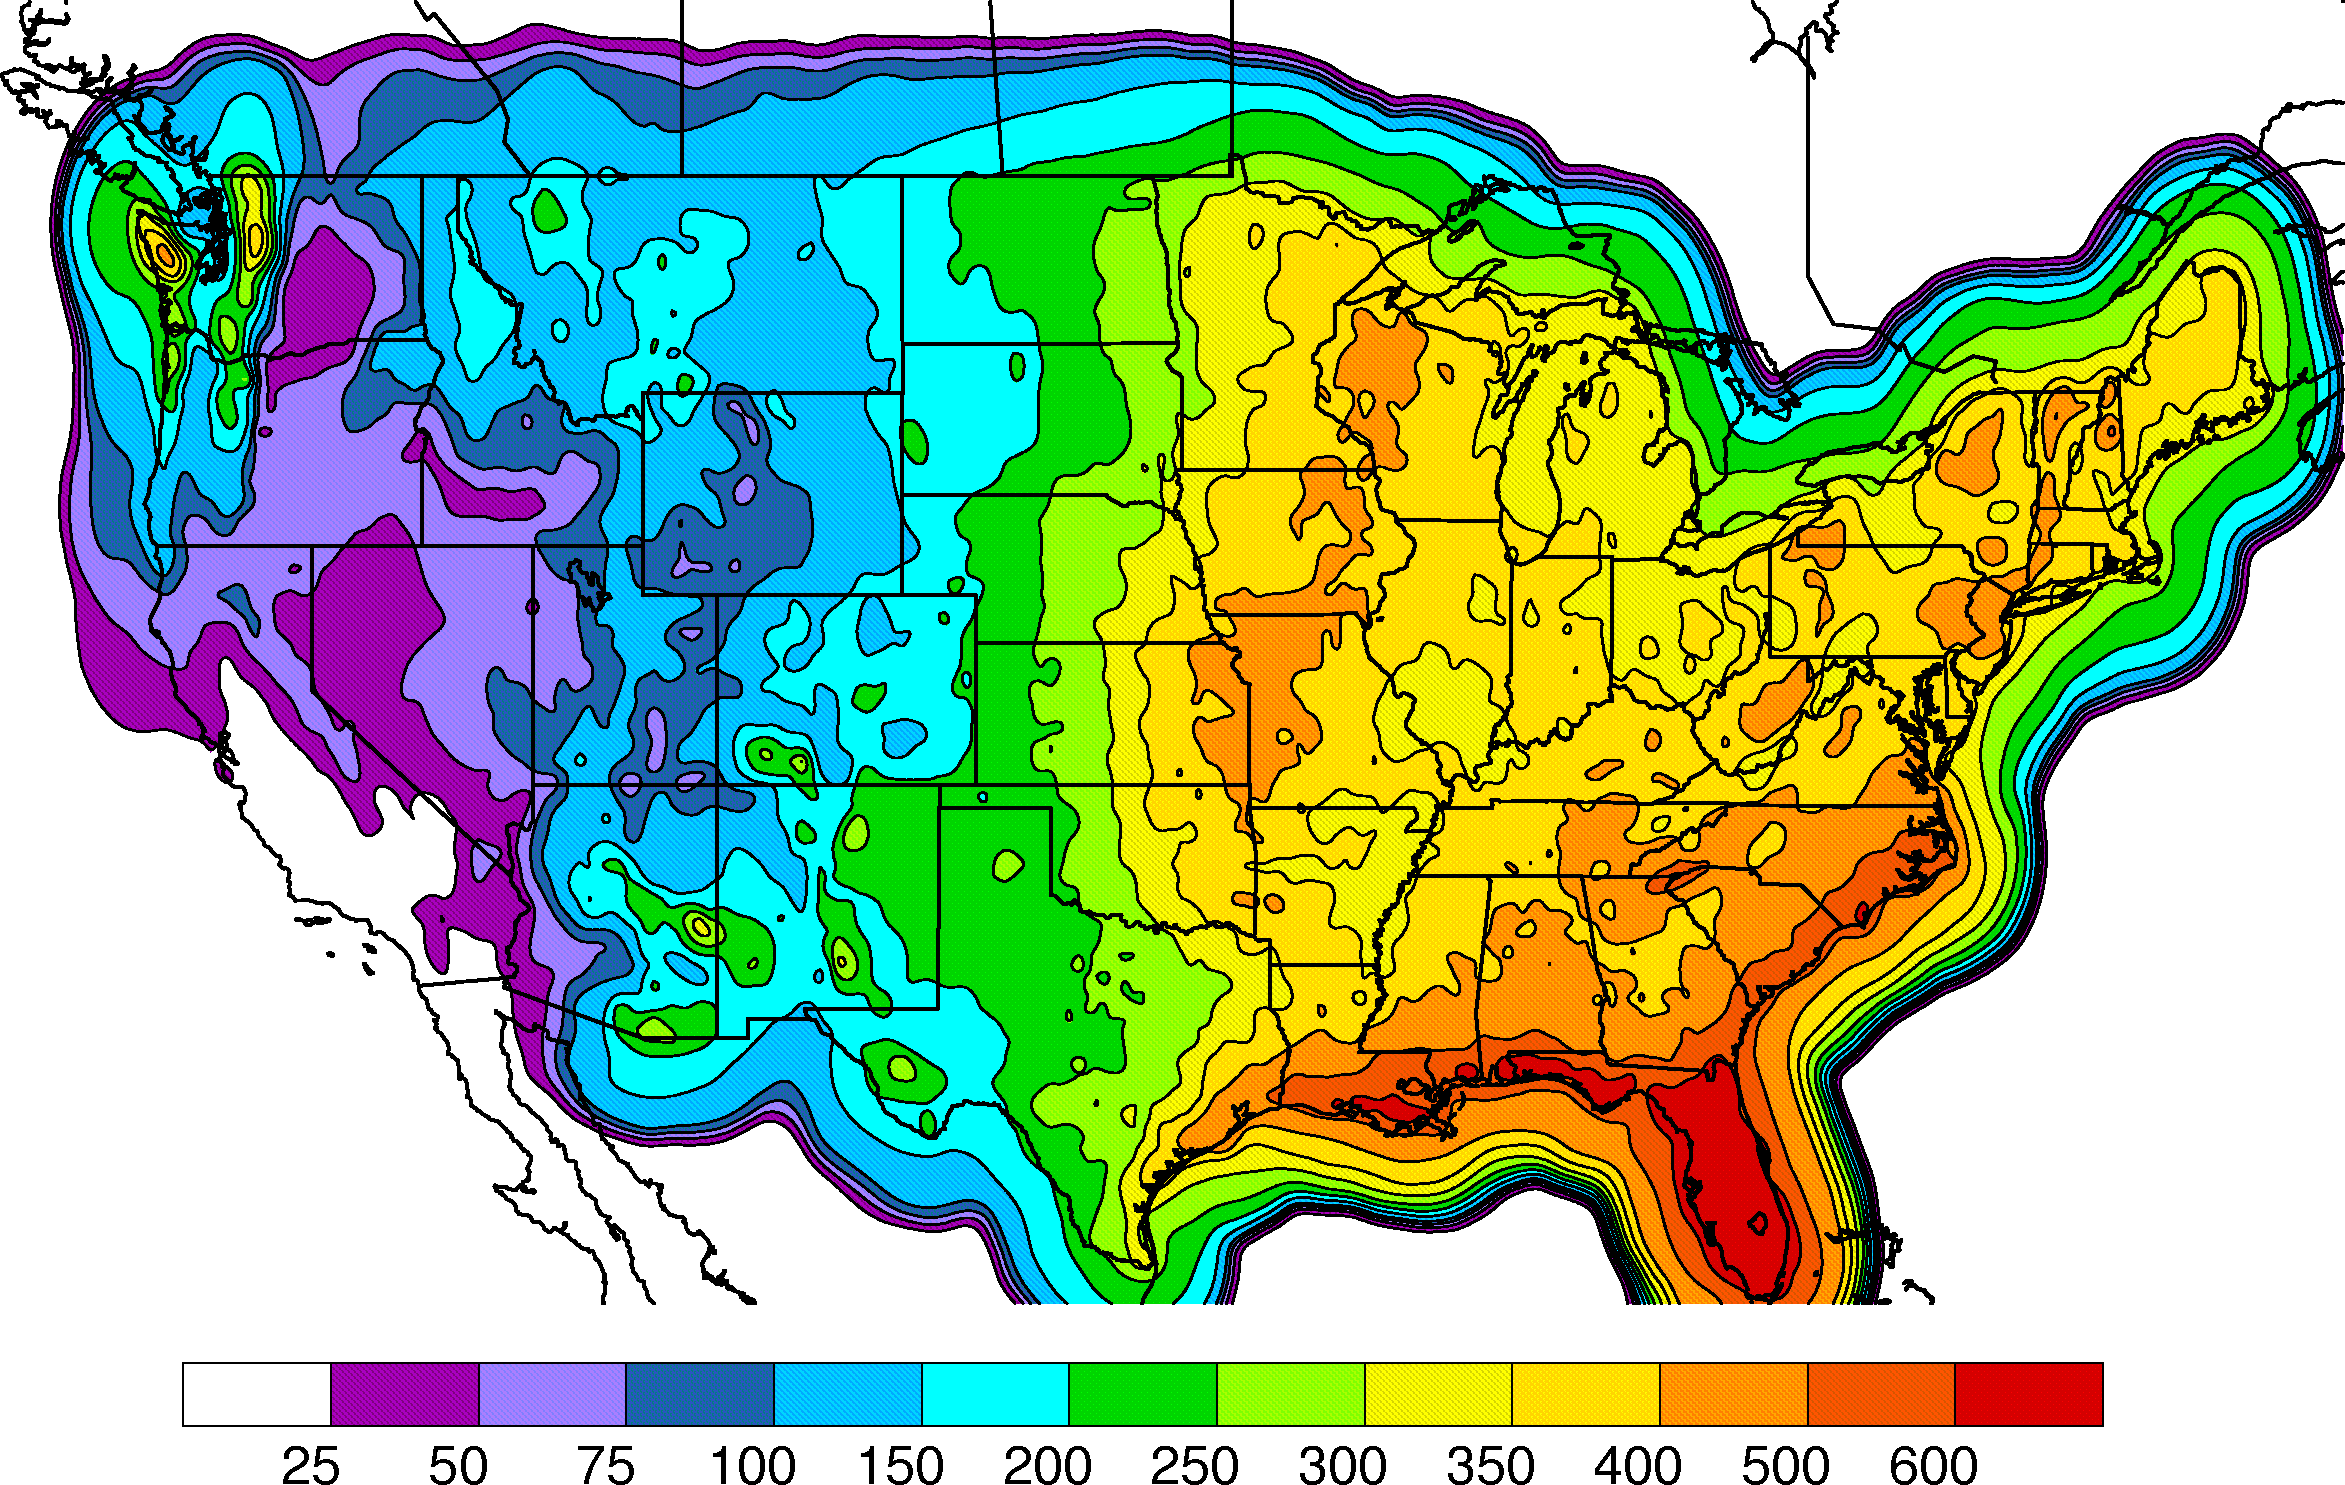
Average (1958-2003) warm season (16 June – 15 October) UPD total precipitation (mm)
Case studies
Hurricane Joanne (1972)
DT pressure (hPa; shaded), DT winds (kts; barbs), and 700 hPa relative vorticity (x10-5 s-1; black contours) LOOP
Hurricane Kathleen (1976)
DT pressure (hPa; shaded), DT winds (kts; barbs), and 700 hPa relative vorticity (x10-5 s-1; black contours) LOOP
Hurricane Marie (1984)
DT pressure (hPa; shaded), DT winds (kts; barbs), and 700 hPa relative vorticity (x10-5 s-1; black contours) LOOP
GOES-6 IR satellite images (every 12 hrs; 00 UTC 9/6 - 9/12) LOOP
Hurricane Hilary (1993)
DT pressure (hPa; shaded), DT winds (kts; barbs), and 700 hPa relative vorticity (x10-5 s-1; black contours) LOOP
Hurricane Nora (1997)
UPD precipitation total (mm), 24-27 September 1997 MAP
DT pressure (hPa; shaded), DT winds (kts; barbs), and 700 hPa relative vorticity (x10-5 s-1; black contours) LOOP
Pacific Ocean DT pressure (hPa; shaded), DT winds (kts; barbs), and 700 hPa relative vorticity (x10-5 s-1; red contours) LOOP
Pacific Ocean DT potential temperature (K;shaded), DT winds (kts; barbs), and 700 hPa relative vorticity (x10-5 s-1; black contours) LOOP
Pacific Ocean 1000-500 hPa thickness (hm; dashed blue contours), 1000 hPa height (hm; solid black contours), and 700 hPa relative vorticity(x10-5 s-1; shaded) LOOP
1000-500 hPa thickness (hm; dashed blue contours), 1000 hPa height (hm; solid black contours), and 700 hPa relative vorticity(x10-5 s-1; shaded) LOOP
700 hPa relative vorticity (x10-5 s-1; solid black contours), relative humidity (%; shaded), and omega (microbars s-1; dashed red
contours) LOOP
Hurricane Isis (1998)
UPD precipitation total (mm), 3-7 September 1998 MAP
DT pressure (hPa; shaded), DT winds (kts; barbs), and 700 hPa relative vorticity (x10-5 s-1; black contours) LOOP
1000-500 hPa thickness (hm; dashed blue contours), 1000 hPa height (hm; solid black contours), and 700 hPa relative vorticity(x10-5 s-1; shaded) LOOP
700 hPa relative vorticity (x10-5 s-1; solid black contours), relative humidity (%; shaded), and omega (microbars s-1; dashed red
contours) LOOP
There are a total of 565 tracks on the plot, indicating that only 6% of all east Pacific TCs impact the US. This number is not surpring considering the mean genesis position (15.3° N, 110.7° W) and motion (slightly north of due west) of east Pacific storms. TCs that eventually affect the southwest US form ~7° further east than the mean (significant at the 99.9% level), but only .6° further north (significant at the 90% level). The mean motion of these storms is initially west-northwest or northwest and they begin to curve north or even northeast between 20° N and 25° N.
The TCs that affect the soutwest are also unique in the time of the season they are most likely to strike. The two plots below show the number of days on which rainfall associated with a TC fell in the southwest (left panel) and the number of days at least one TC was active in the east Pacific (right panel). The days have been grouped into two week periods from 16 June to 15 October.
By far, the most likely time for TC rainfall in the southwest US is during the month of September. This peak in rainfall occurs during the late season, secondary peak in the number of east Pacific TCs in late August and September. The number of TC days and the number of days with TC rainfall drops significantly during the first two weeks in October. The peak in the east Pacific TC season is during the last two weeks of July, but no TCs during the 46 years studied hit the southwest during this period. This discrepancy suggests that the large scale flow pattern necessary to turn the storms northward is much more likely at the end of the TC season, as the atmosphere transitions to a fall pattern in the North Hemisphere.
Rainfall distributions
The 35 TCs that brought rainfall to the southwest US possess a wide variety of rainfall distributions from southwest-northeast oriented streaks extending well into the central US, to isolated blobs along the US/Mexico border. Plots of the storm total precipitation (mm) and percent contribution to the warm season for each TC are shown on the following pages: 1950s, 1960s, 1970s, 1980s, 1990s, and 2000s. The storm total precipitation maps may also be viewed grouped according to two common precipitation distributions: Southwest-Northeast swath and California-Nevada track.
Despite the large variation in the distribution of TC precipitation in the southwest, if the percent contribution of each TC to the warm season precipitation total is averaged over all 35 storms (top panel below), the two main precipitation tracks pointed out above are evident: one extending northeast from extreme southwest Arizona, through the northwest corner of New Mexico and into southwestern Colorado, and the other extending north-northwest from southern to central California and into southern Nevada. The average contribution of TCs to the warm season precipitation increases from east to west, accounting for less than 5% of the rainfall in eastern New Mexico and increasing to more than 20% in extreme western Arizona and southern California to the Pacific Ocean. This east to west gradient mirrors the gradient in average warm season precipitation totals in this region (bottom panel below) which range from over 200 mm in the east to less than 25 mm along the Pacific coast.
Average
percentage of the southwest
Average (1958-2003) warm season (16 June – 15 October) UPD total precipitation (mm)
Hurricane Joanne (1972)
DT pressure (hPa; shaded), DT winds (kts; barbs), and 700 hPa relative vorticity (x10-5 s-1; black contours) LOOP
Hurricane Kathleen (1976)
DT pressure (hPa; shaded), DT winds (kts; barbs), and 700 hPa relative vorticity (x10-5 s-1; black contours) LOOP
Hurricane Marie (1984)
DT pressure (hPa; shaded), DT winds (kts; barbs), and 700 hPa relative vorticity (x10-5 s-1; black contours) LOOP
GOES-6 IR satellite images (every 12 hrs; 00 UTC 9/6 - 9/12) LOOP
Hurricane Hilary (1993)
DT pressure (hPa; shaded), DT winds (kts; barbs), and 700 hPa relative vorticity (x10-5 s-1; black contours) LOOP
Hurricane Nora (1997)
UPD precipitation total (mm), 24-27 September 1997 MAP
DT pressure (hPa; shaded), DT winds (kts; barbs), and 700 hPa relative vorticity (x10-5 s-1; black contours) LOOP
Pacific Ocean DT pressure (hPa; shaded), DT winds (kts; barbs), and 700 hPa relative vorticity (x10-5 s-1; red contours) LOOP
Pacific Ocean DT potential temperature (K;shaded), DT winds (kts; barbs), and 700 hPa relative vorticity (x10-5 s-1; black contours) LOOP
Pacific Ocean 1000-500 hPa thickness (hm; dashed blue contours), 1000 hPa height (hm; solid black contours), and 700 hPa relative vorticity(x10-5 s-1; shaded) LOOP
1000-500 hPa thickness (hm; dashed blue contours), 1000 hPa height (hm; solid black contours), and 700 hPa relative vorticity(x10-5 s-1; shaded) LOOP
700 hPa relative vorticity (x10-5 s-1; solid black contours), relative humidity (%; shaded), and omega (microbars s-1; dashed red
contours) LOOP
Hurricane Isis (1998)
UPD precipitation total (mm), 3-7 September 1998 MAP
DT pressure (hPa; shaded), DT winds (kts; barbs), and 700 hPa relative vorticity (x10-5 s-1; black contours) LOOP
1000-500 hPa thickness (hm; dashed blue contours), 1000 hPa height (hm; solid black contours), and 700 hPa relative vorticity(x10-5 s-1; shaded) LOOP
700 hPa relative vorticity (x10-5 s-1; solid black contours), relative humidity (%; shaded), and omega (microbars s-1; dashed red
contours) LOOP