Climatological Figures
//Decadal 850 hPa Temperature Changes // 1000-500 hPa Thickness // NH Mean Flow Patterns //
// SH Mean Flow Patterns // Tropics Mean Flow Patterns // Global Climo of 850 and 200 hPa Anticyclones //
//Strong El Nino and Strong La Nina Comparison // Atlantic Multidecadal Oscillation (AMO) // Precipitable Water //
//Global Rainfall Maps // Drought vs. Wet Year over Plains // Drought vs. Wet Year over UK //
//Asiatic Summer Monsoon // Record Heat in AZ/NM/OK June 1994 // Midwest Record Heat 14-15 Jul 1954
// Midwest Record Cold 1-5 Feb 1996 // Alaskan Record cold 16-29 Dec 1961 //Record Western US Cold Jan 1949 //
//Record Central/Eastern US Cold Jan 1977 //Superstorm 13-14 Mar 1993 // La Reunion World Record Rains //
//Super Outbreak 3 April 1974 // CA Fires of 22-23 Oct 2007 // NH July 2010 Circulation and Pakistan Floods //
//Summer 2011 //Autumn 2010 // Autumnal Warming & Sea Ice Impacts in the NH //
//Recent Extreme Weather and Climate Events // Albany's Longest Heatwaves //
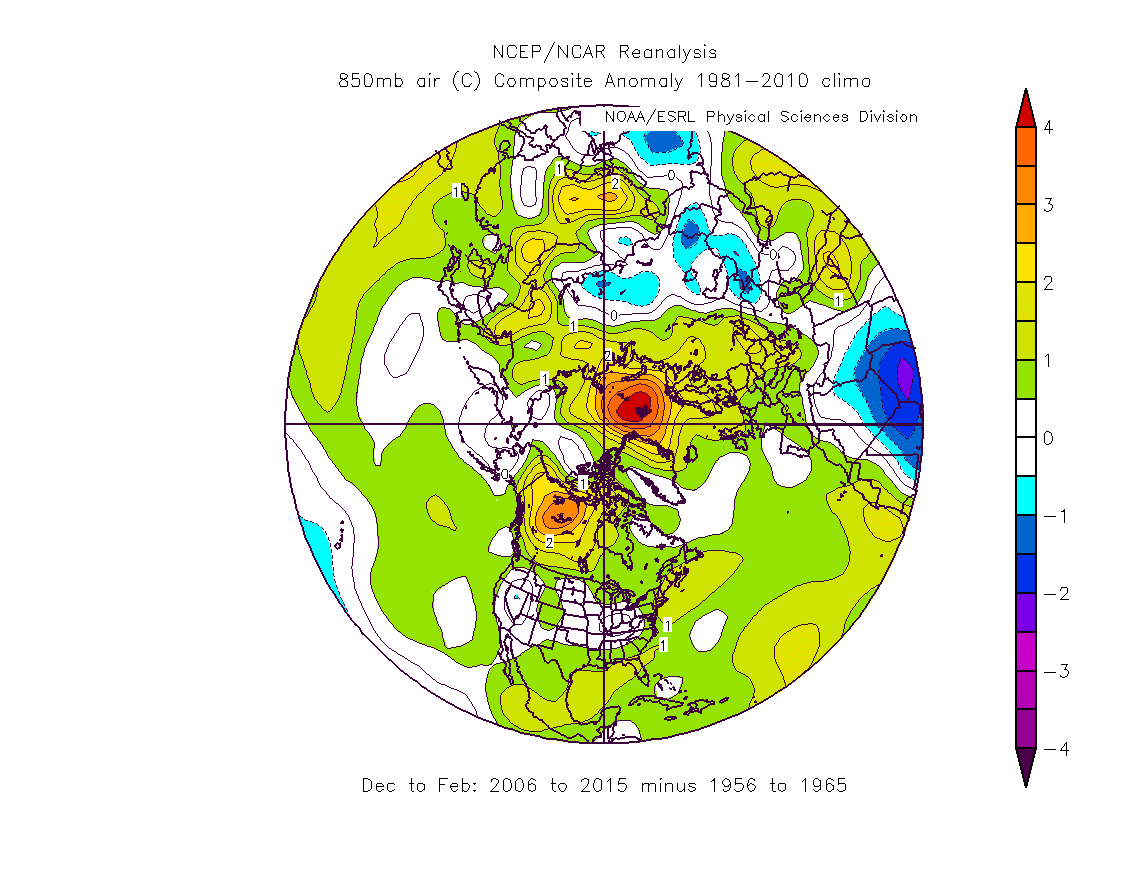
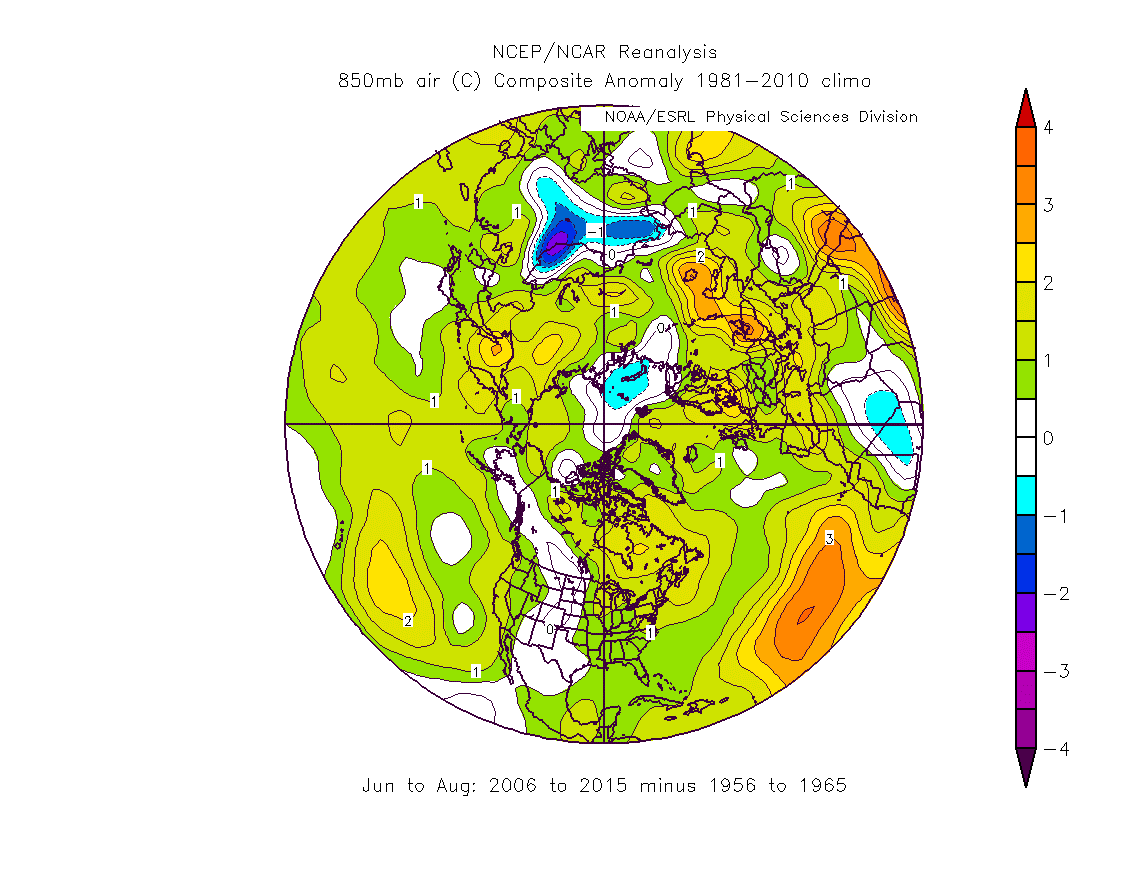
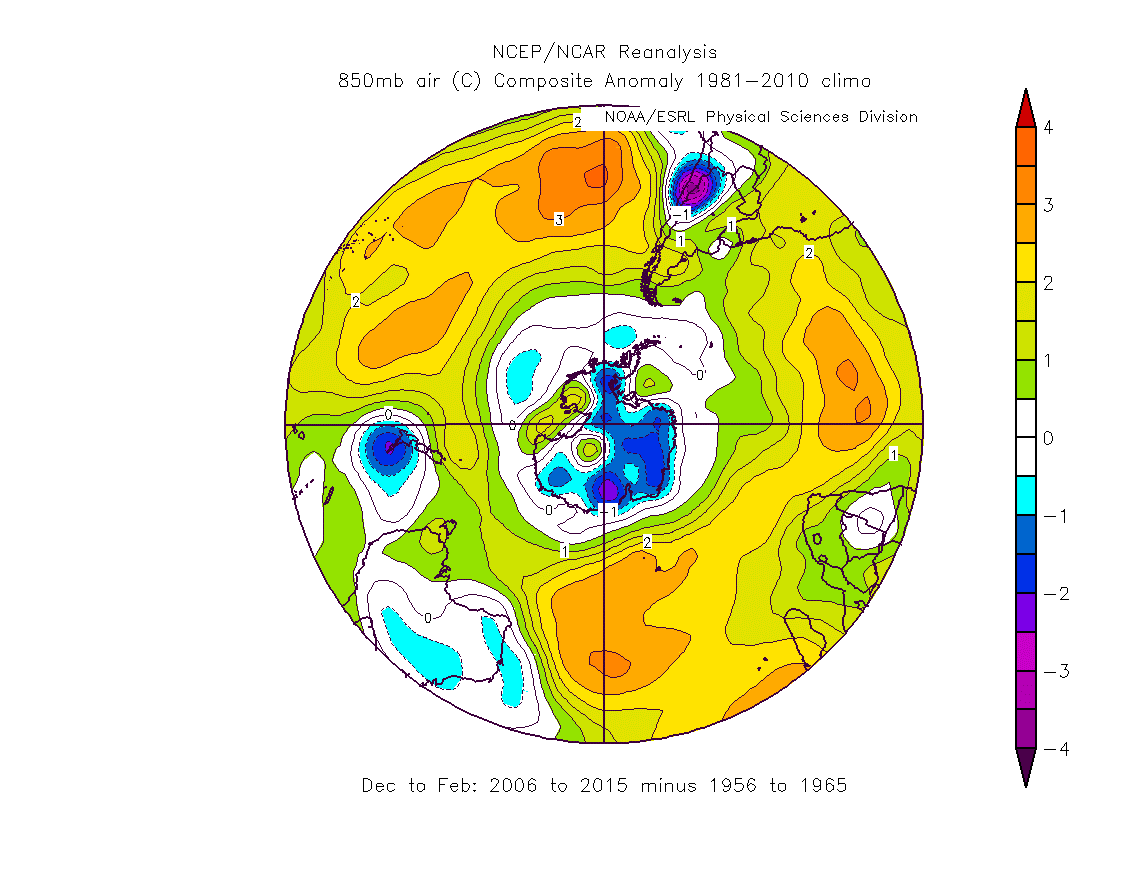
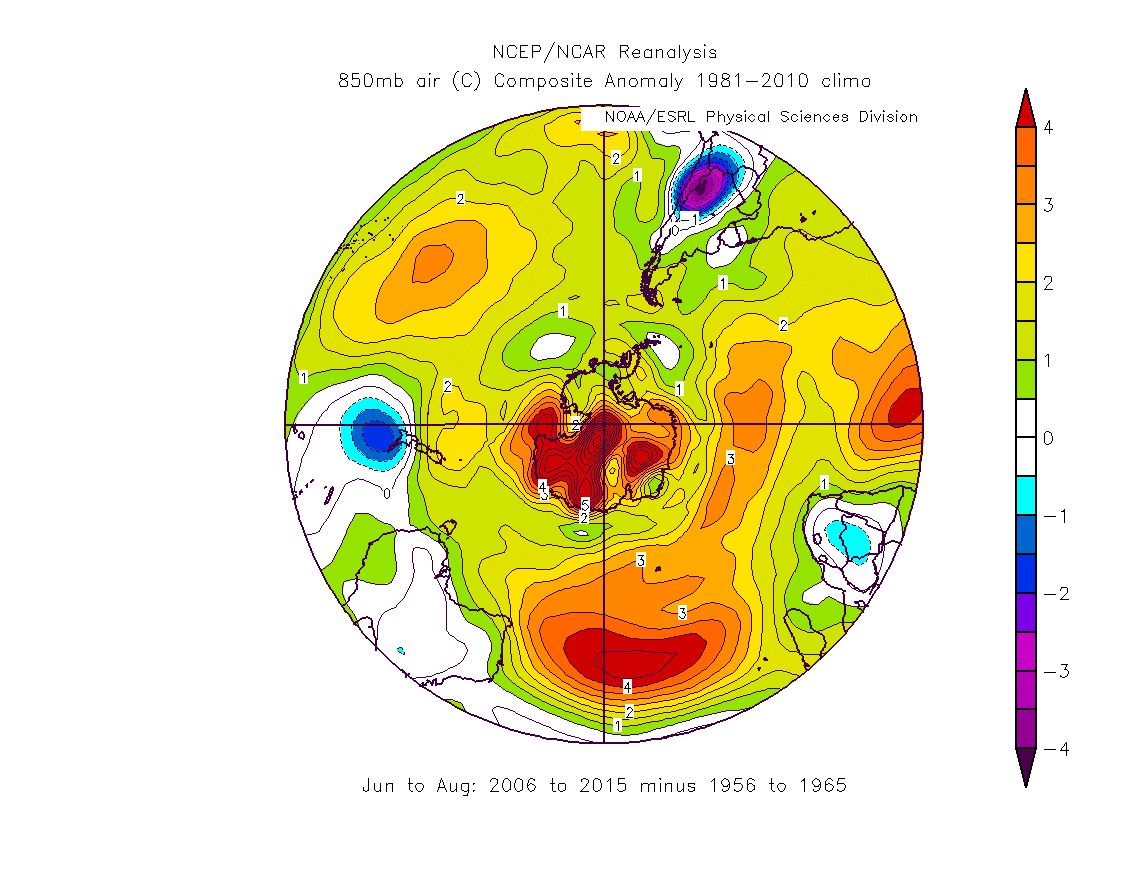
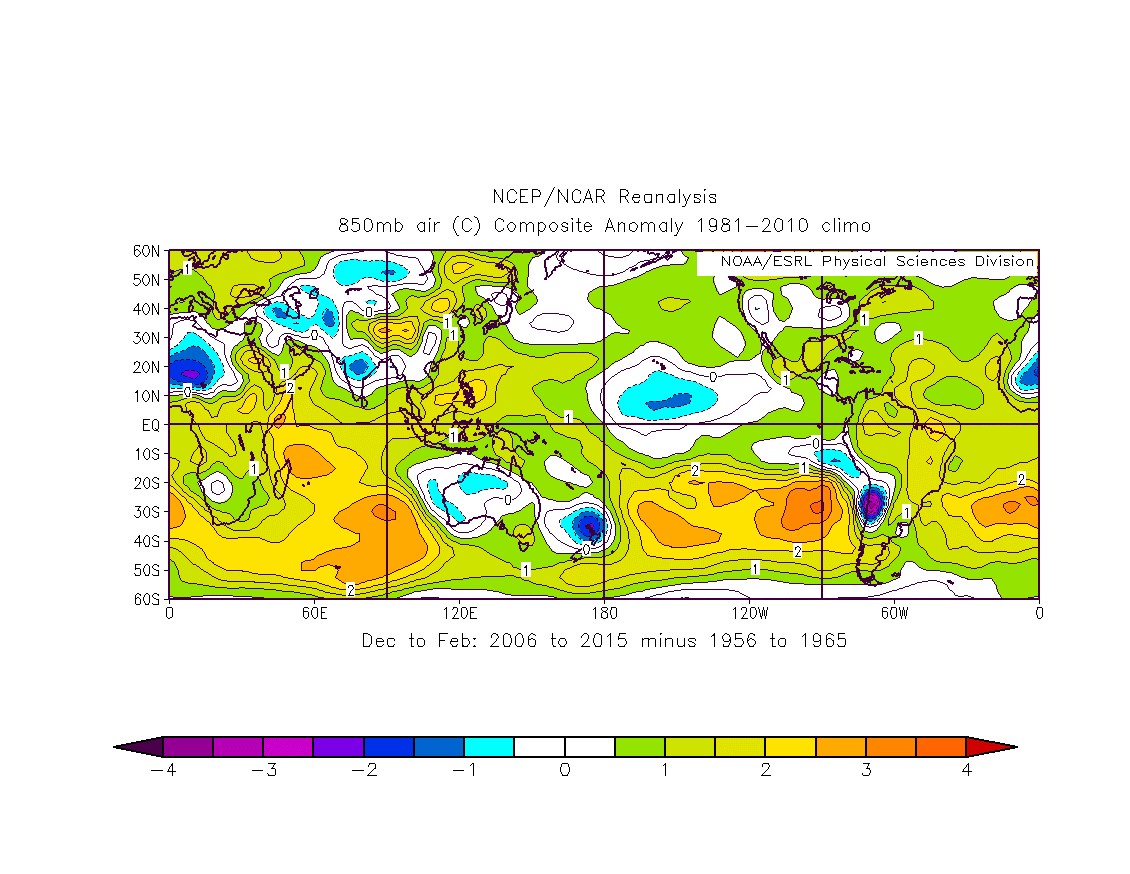
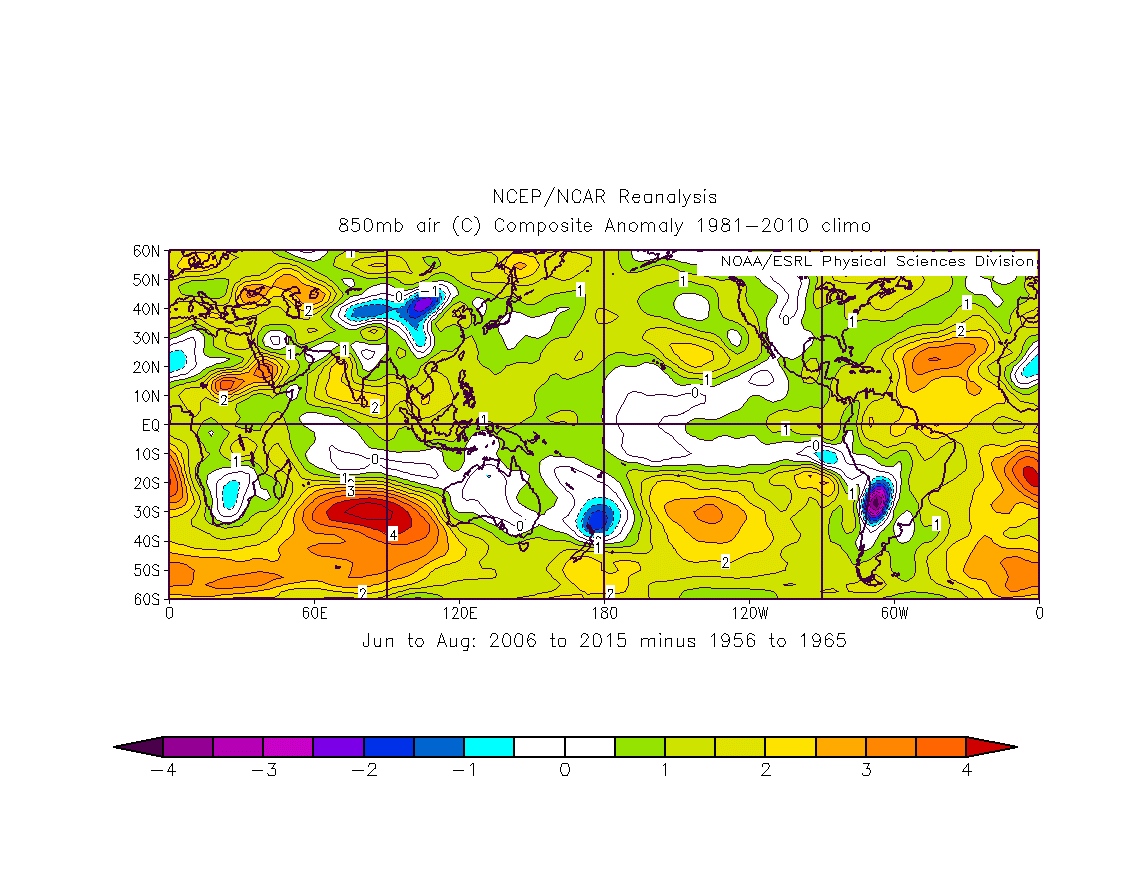
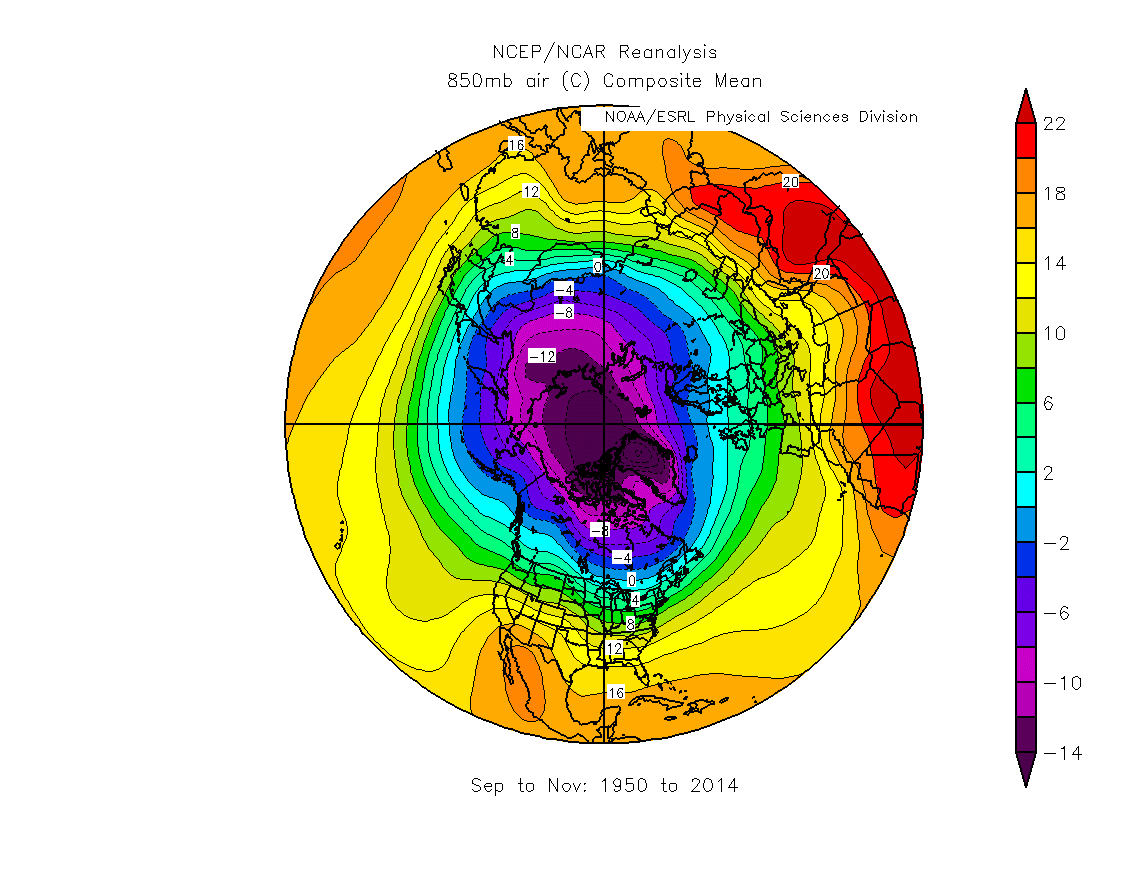
Decadal 850 hPa Temperature Changes (2006-2015 minus 1956-1965)
| Northern Hemisphere: | • DJF | • JJA |
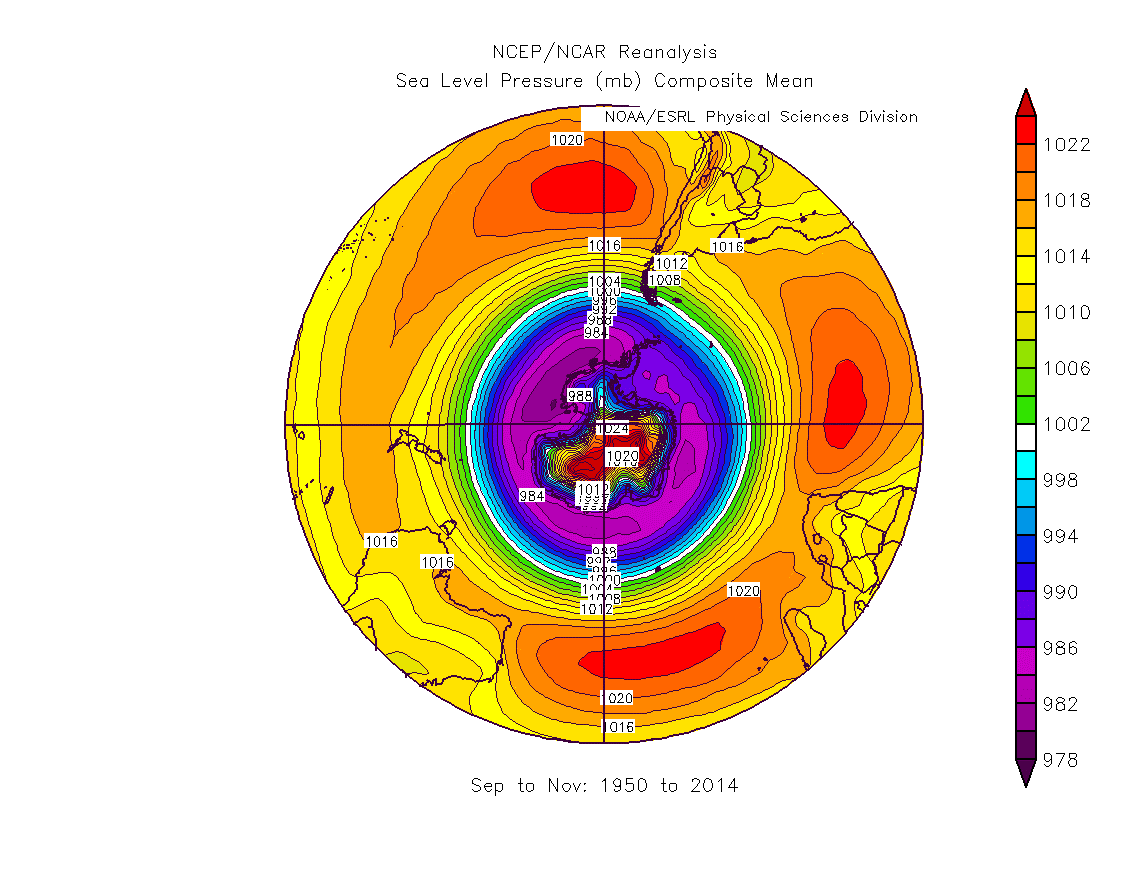
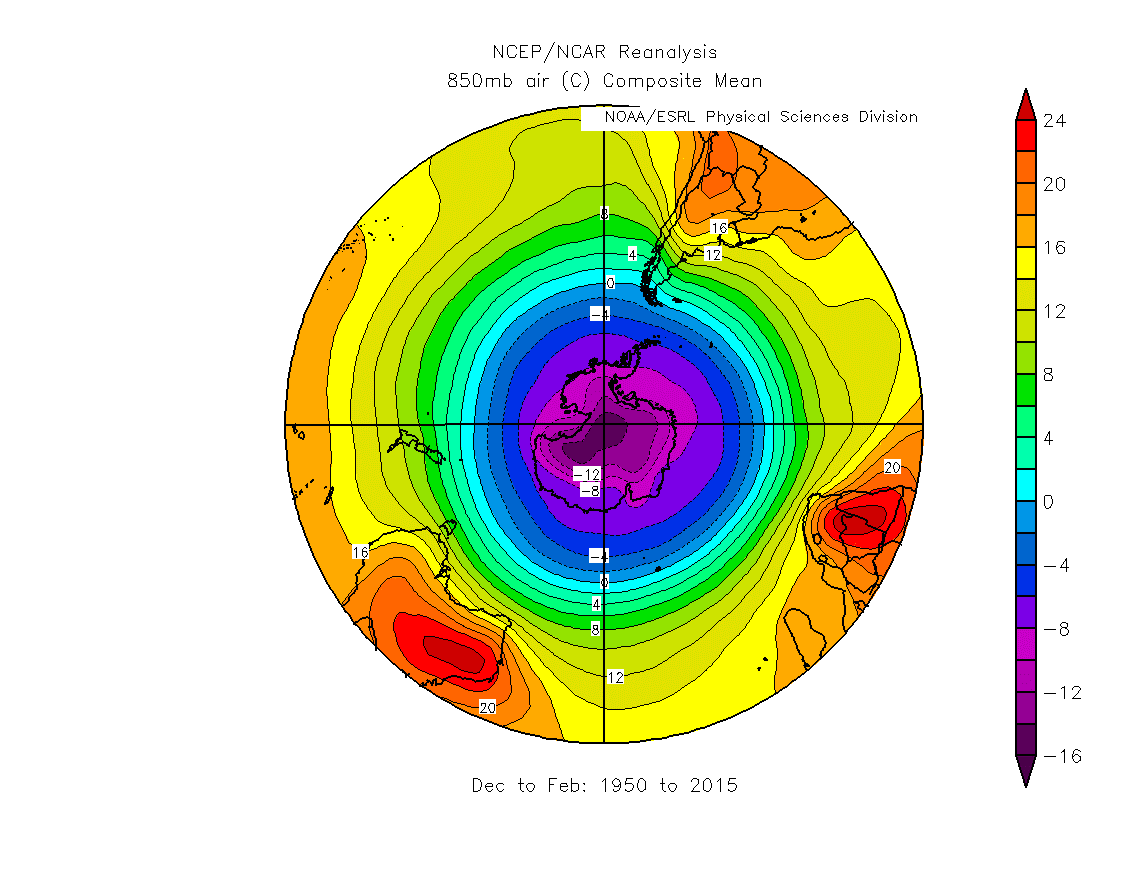
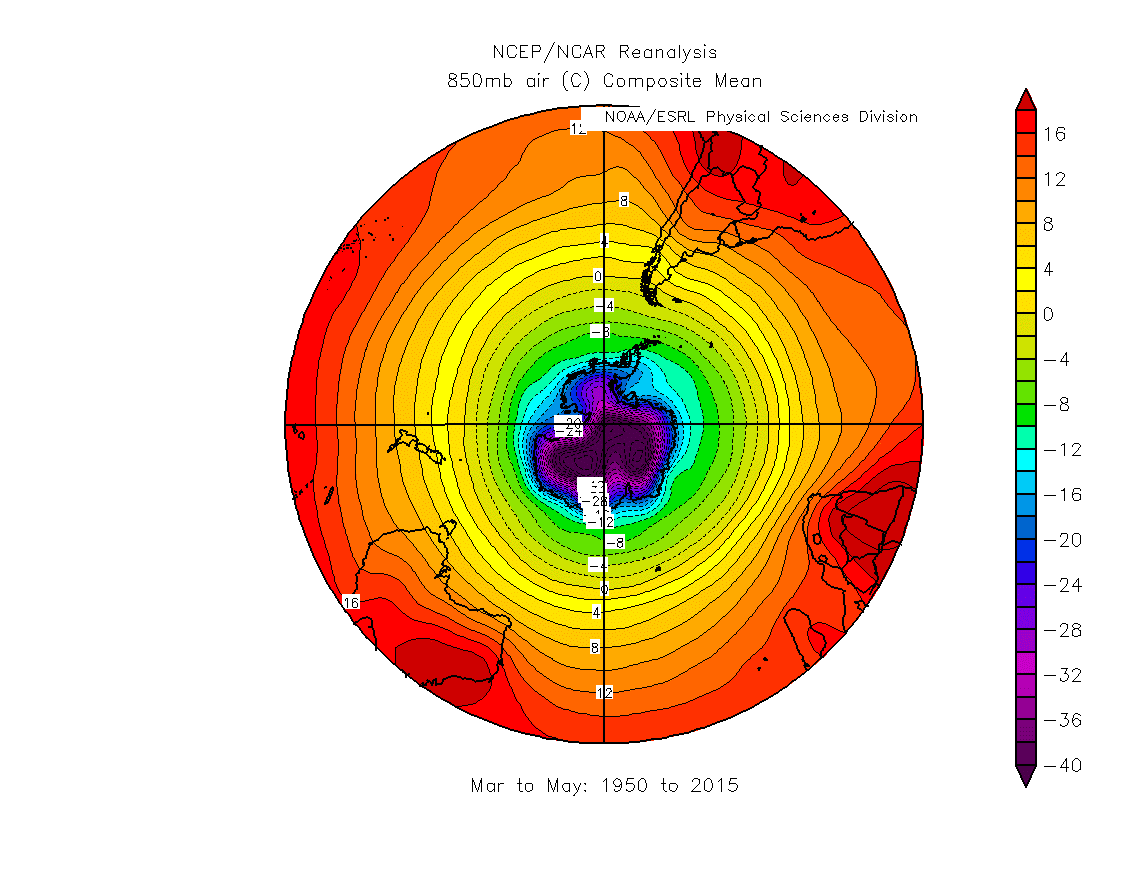
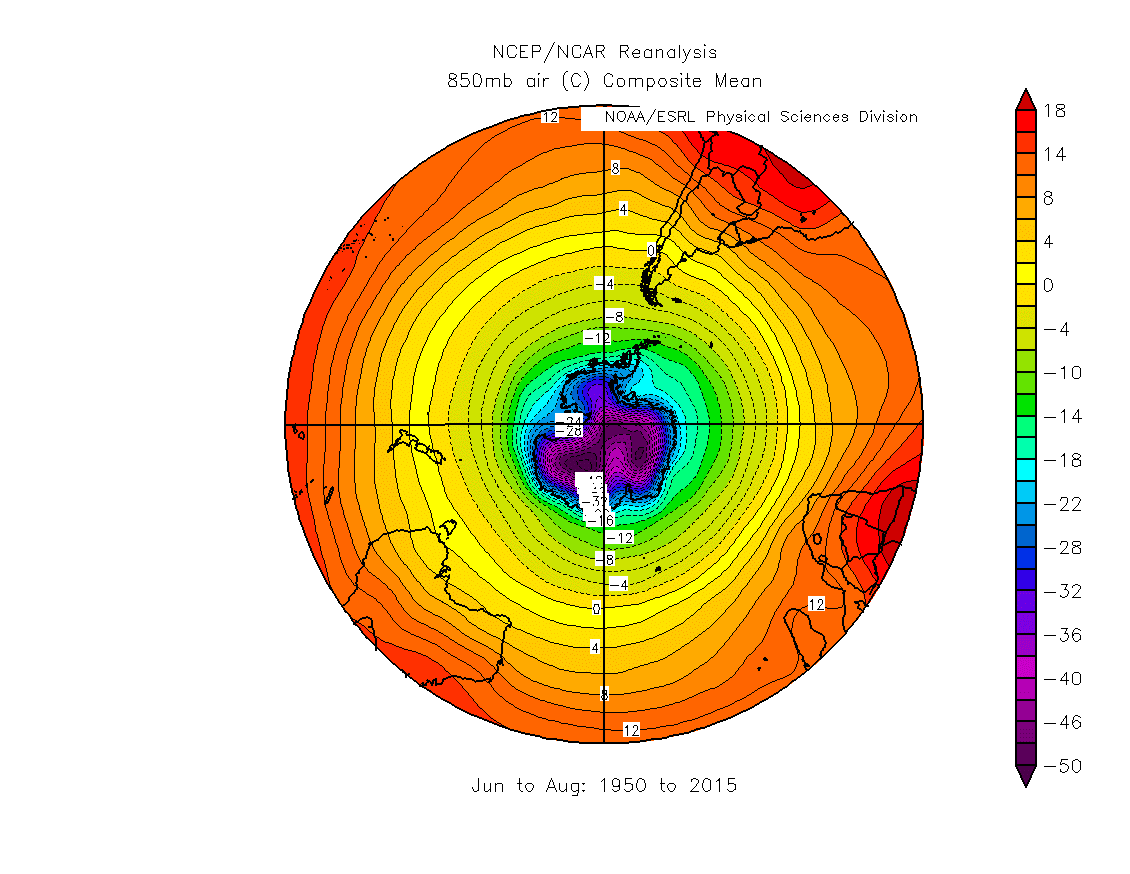
| Southern Hemisphere: | • DJF | • JJA |
| Tropics: | • DJF | • JJA |
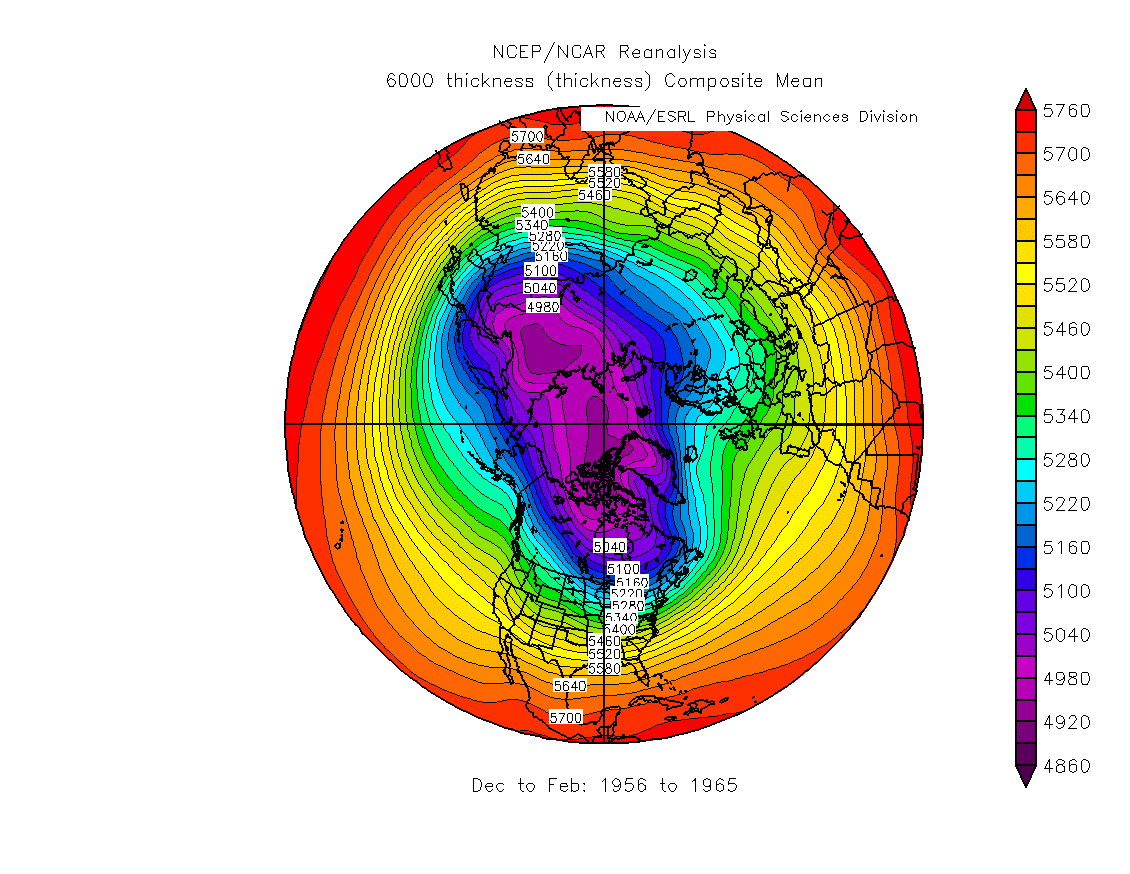
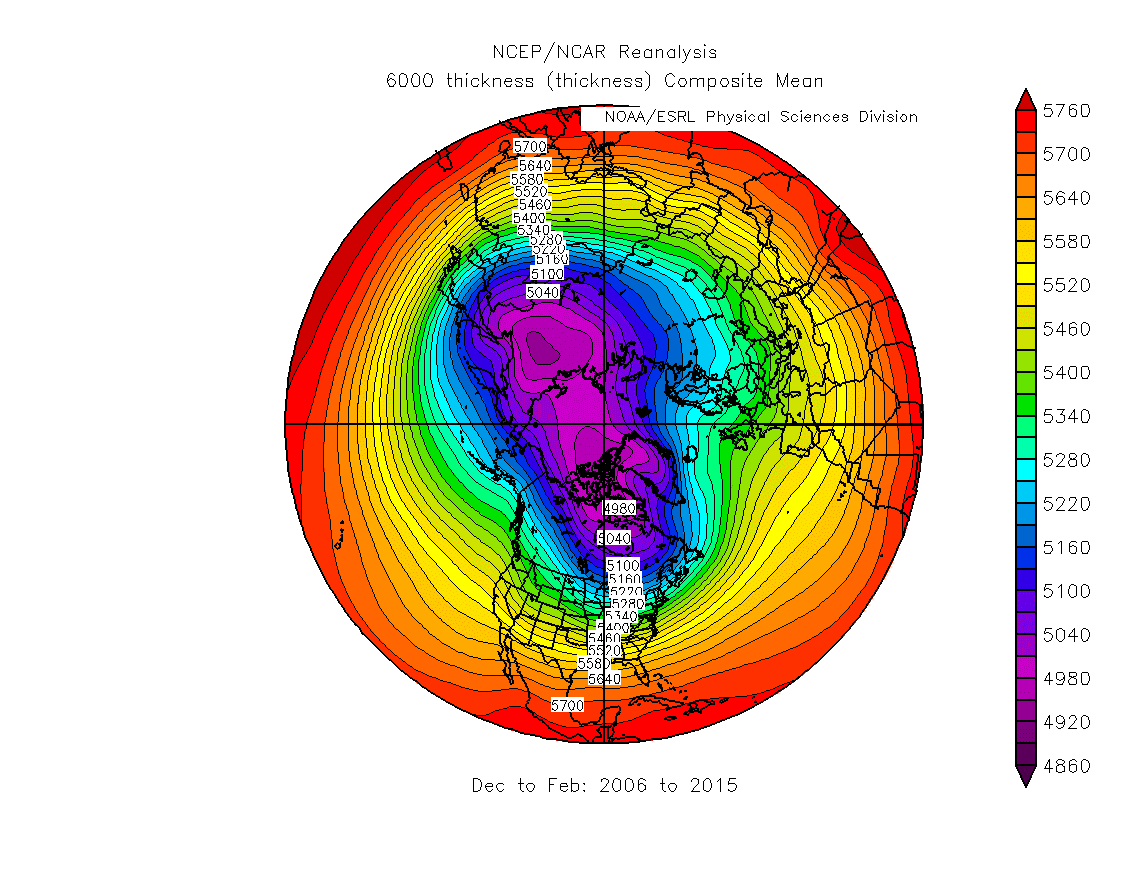
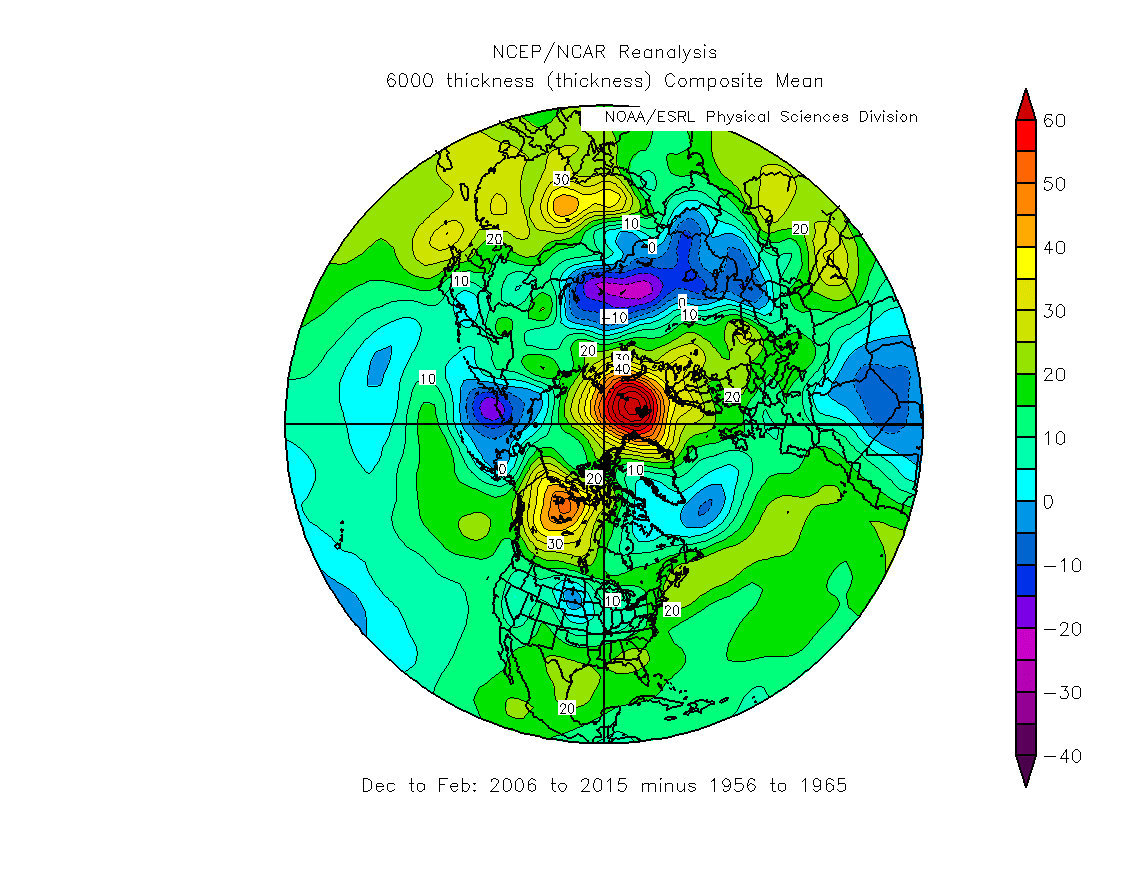
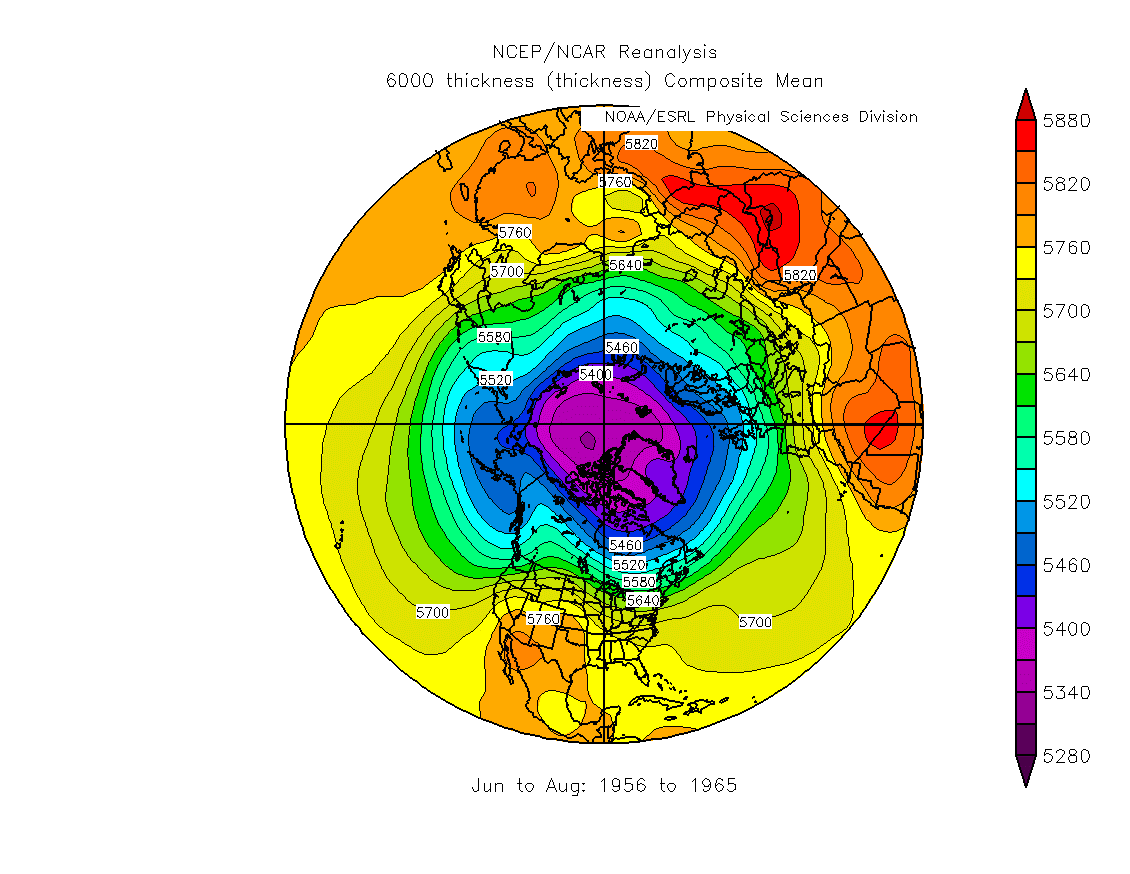
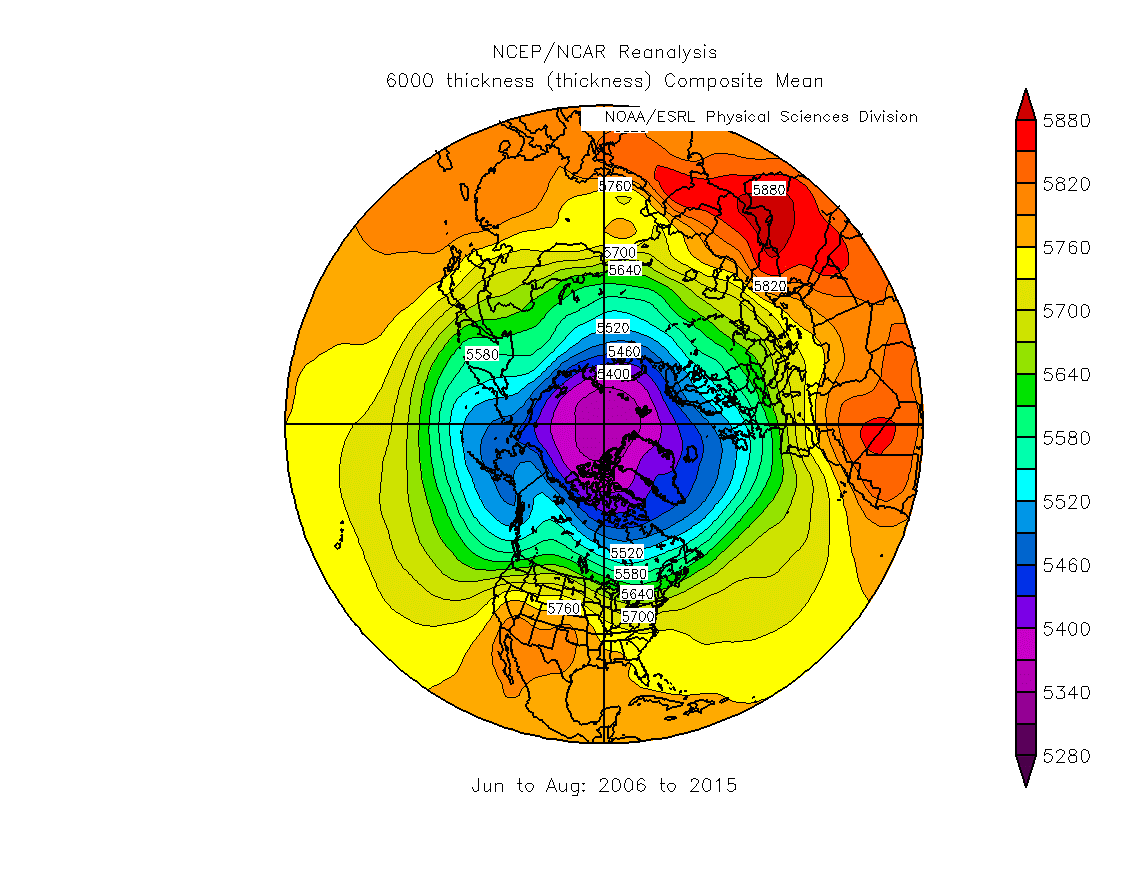
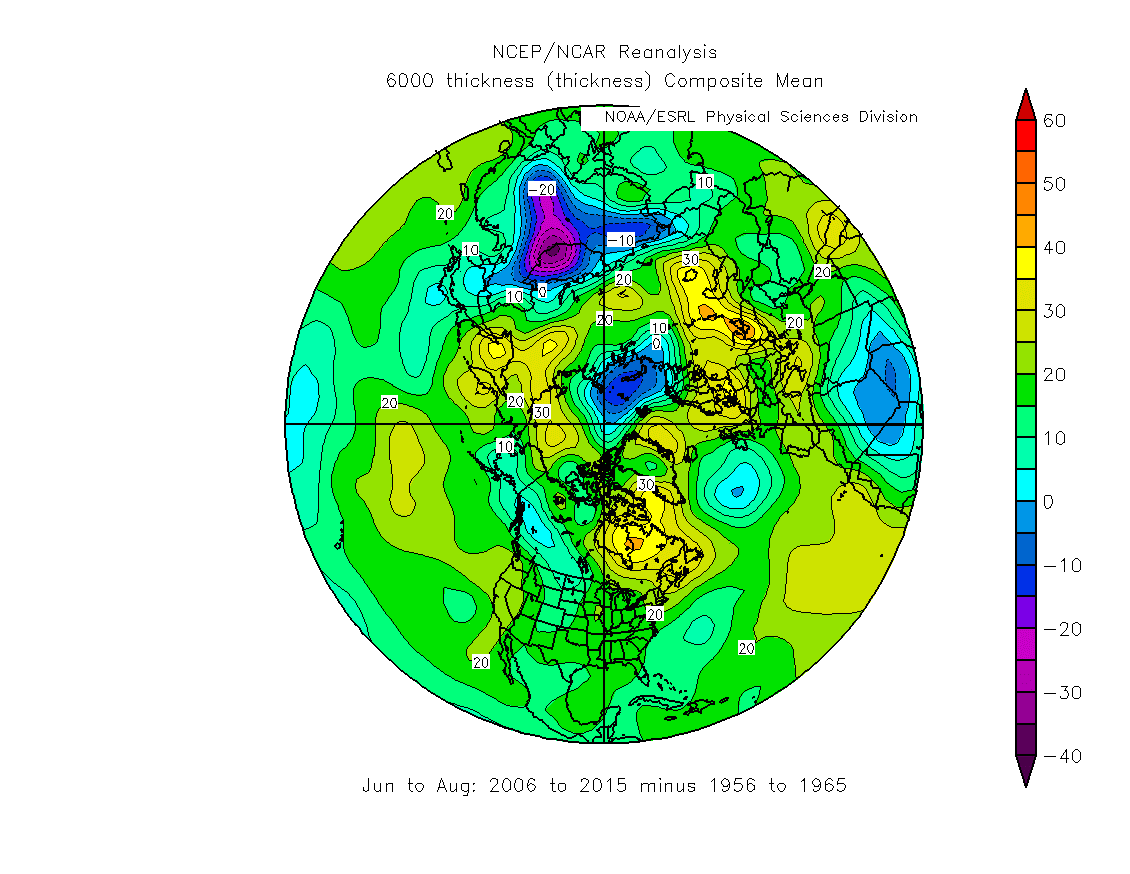
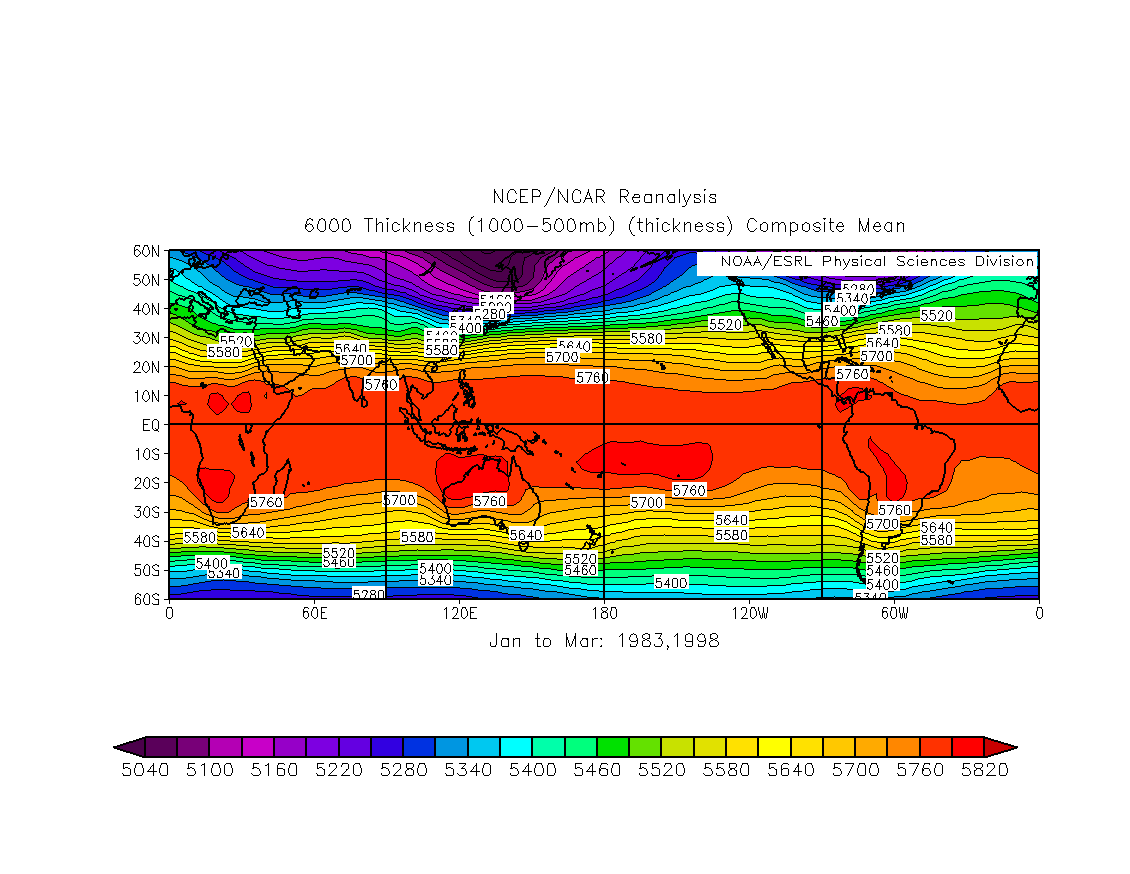
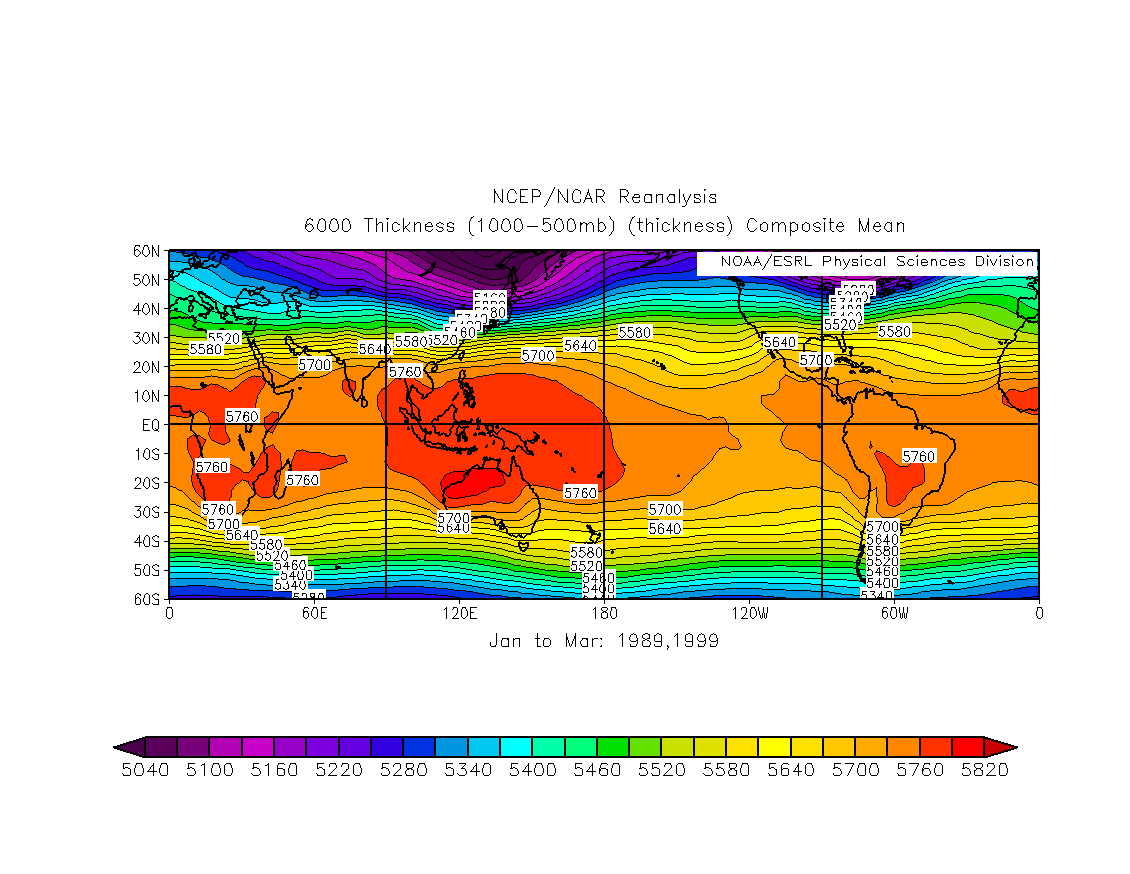
1000-500 hPa Thickness Maps and Climatology
| DJF | • 1956-1965 | • 2006-2015 | • (2006-2015) minus (1956-1965) |
| JJA | • 1956-1965 | • 2006-2015 | • (2006-2015) minus (1956-1965) |
| Thickness Climatology | •Atallah-Aiyyer Thickness climatology |
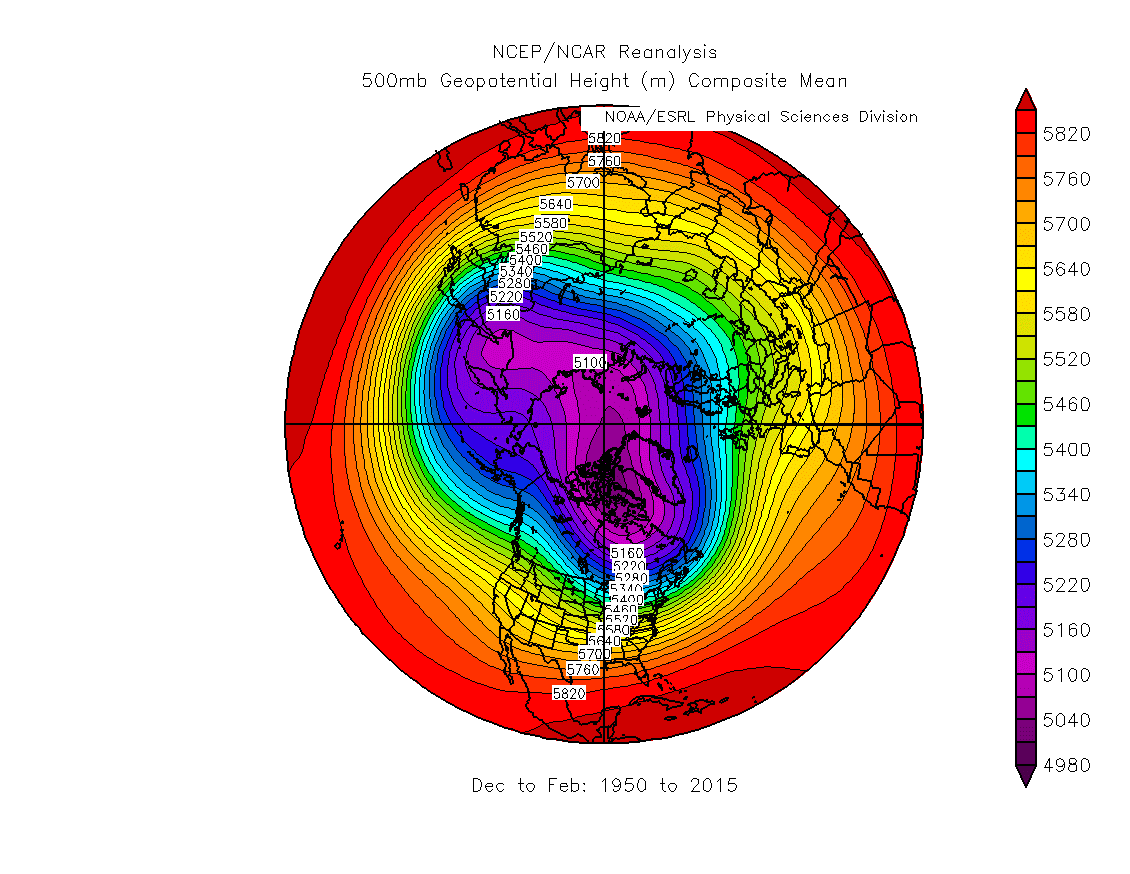
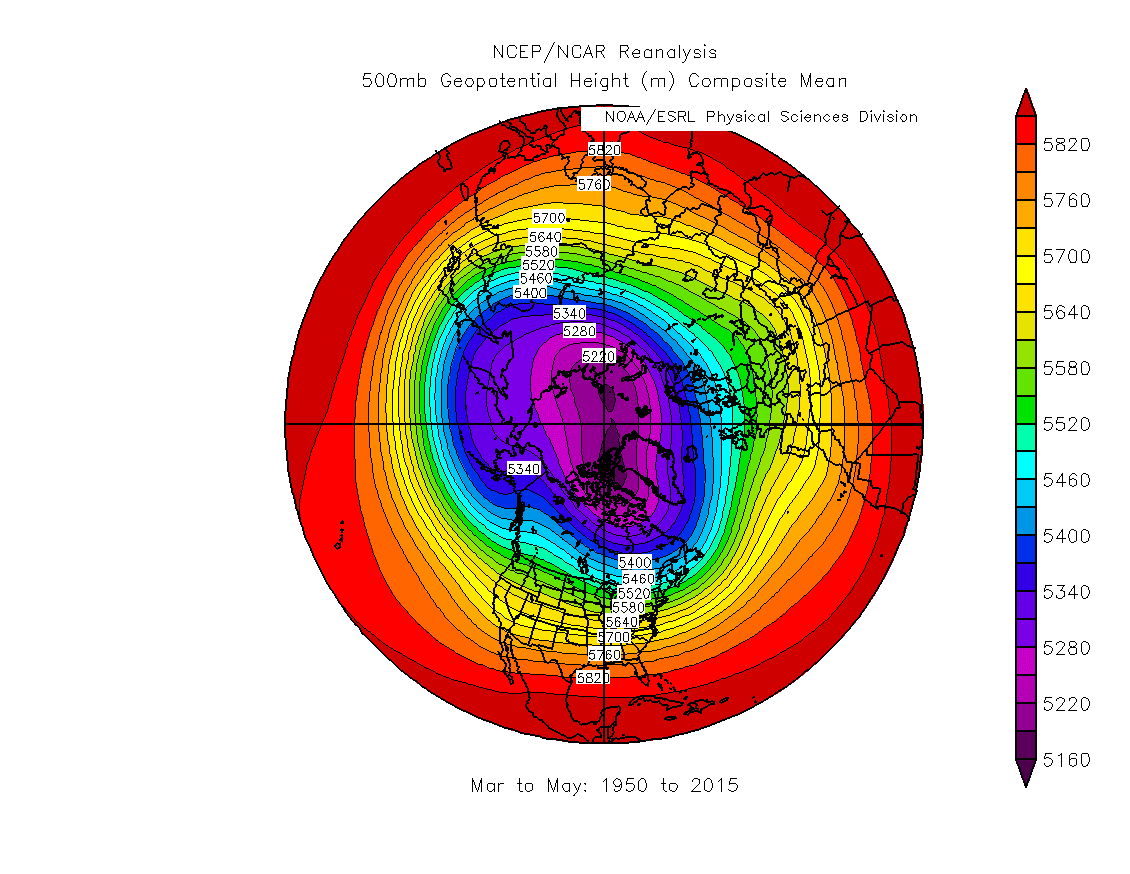
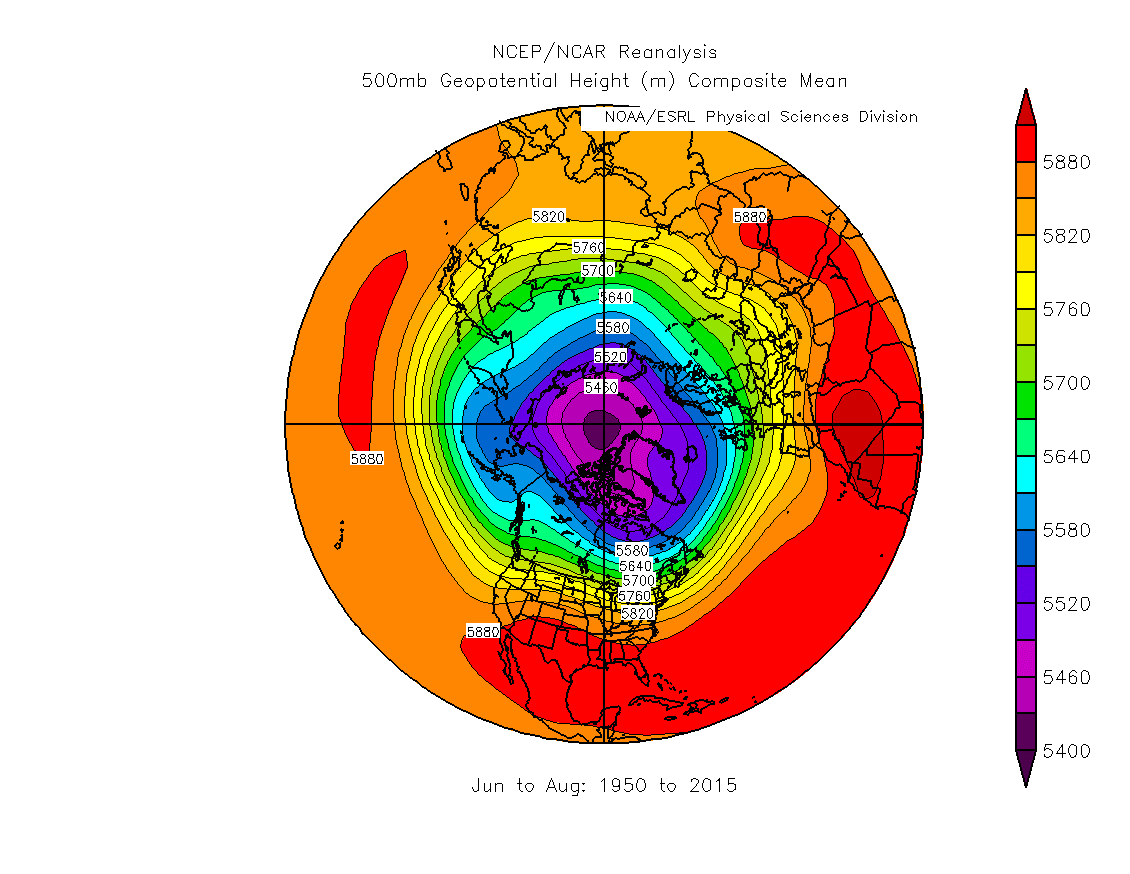
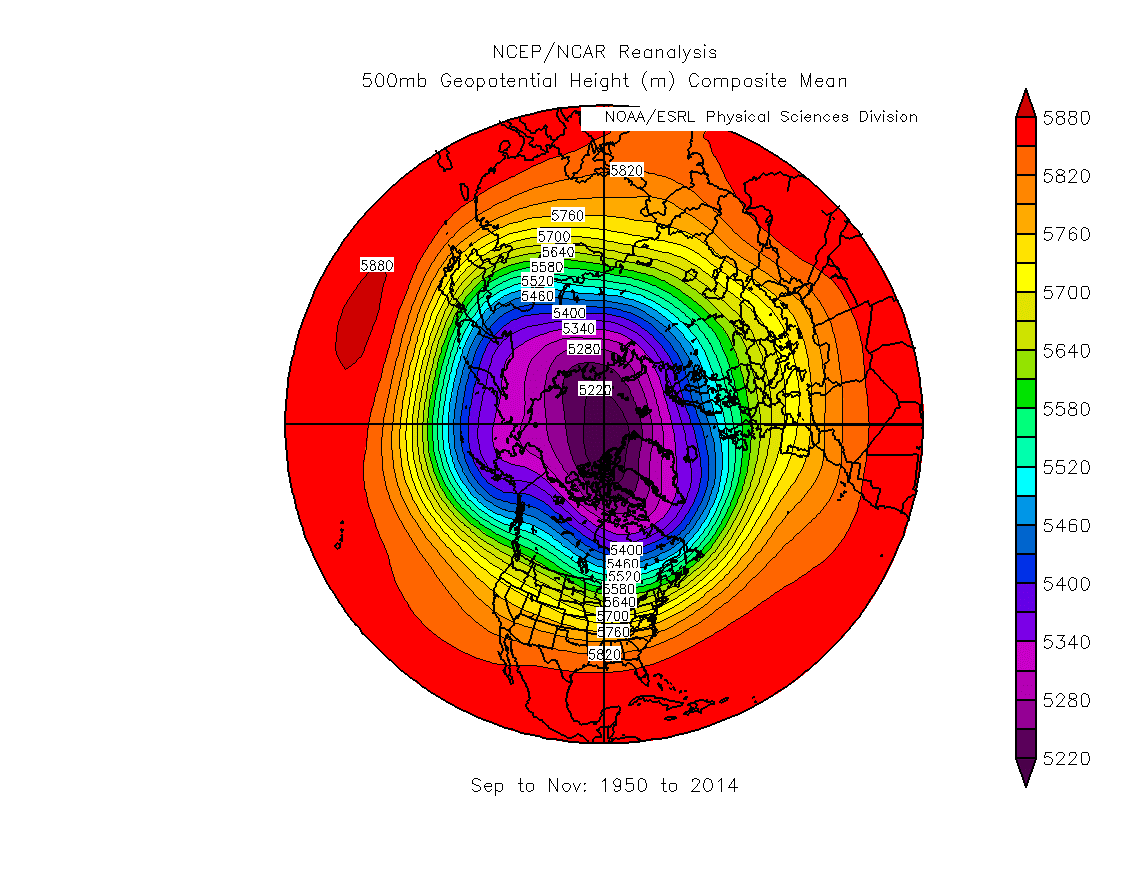
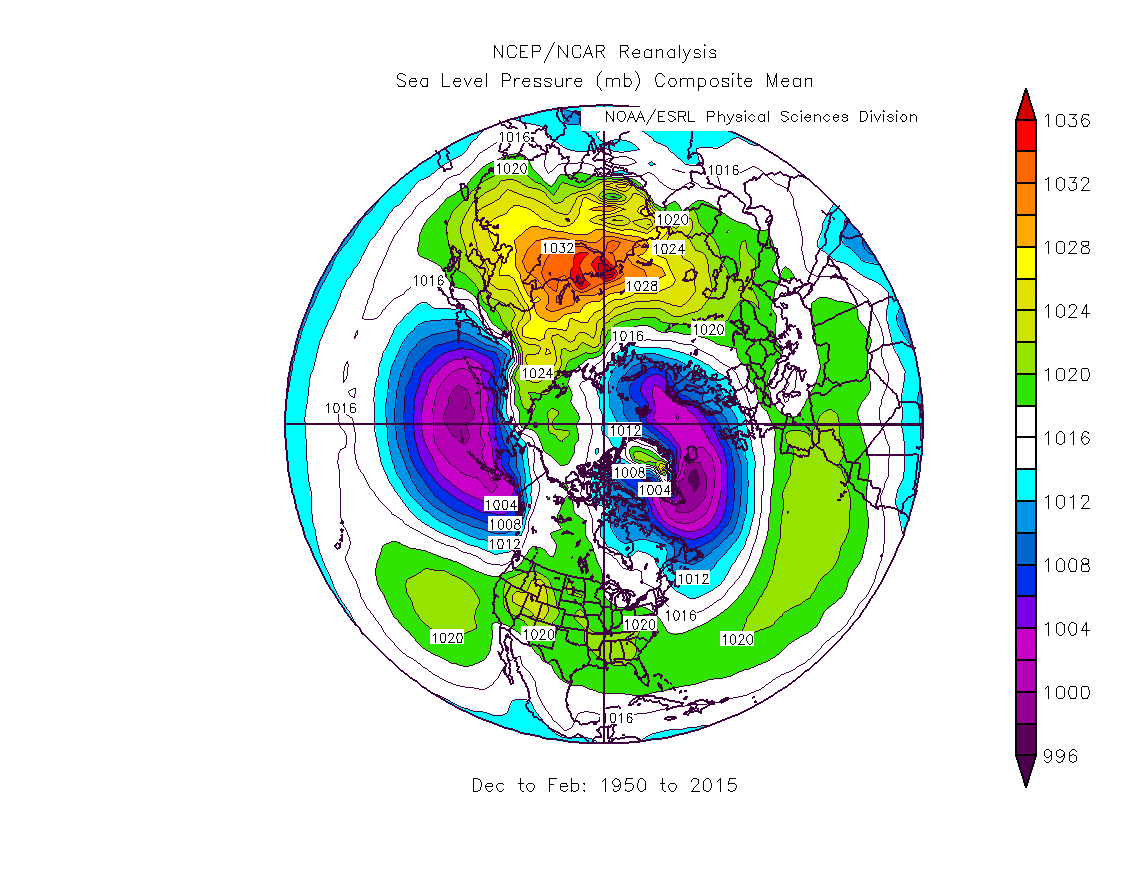
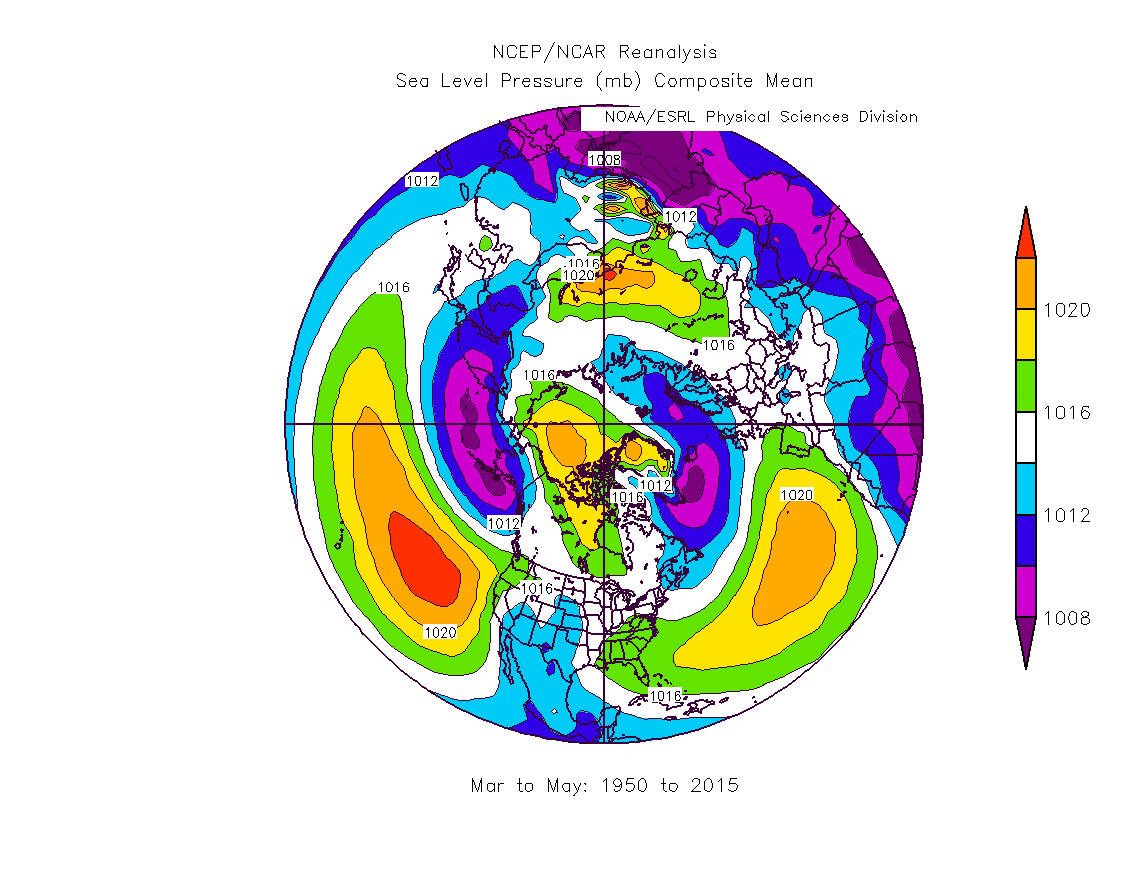
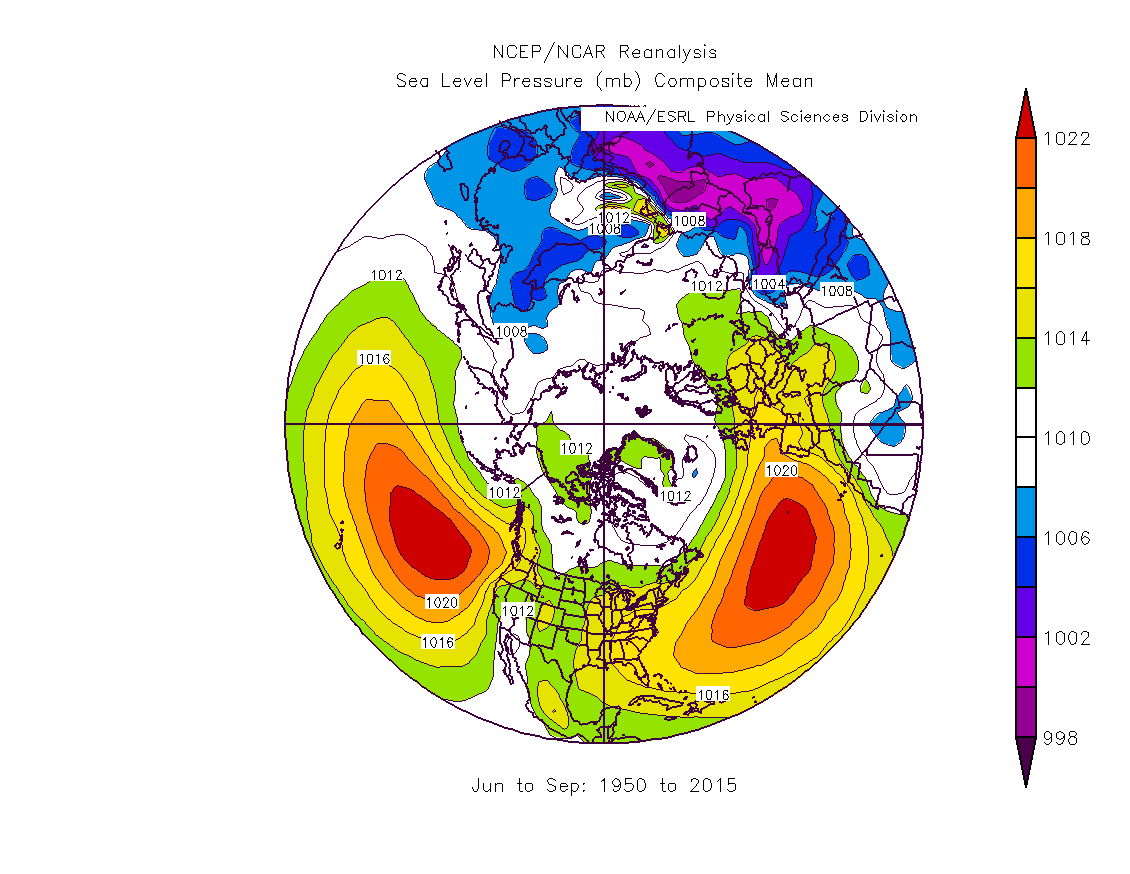
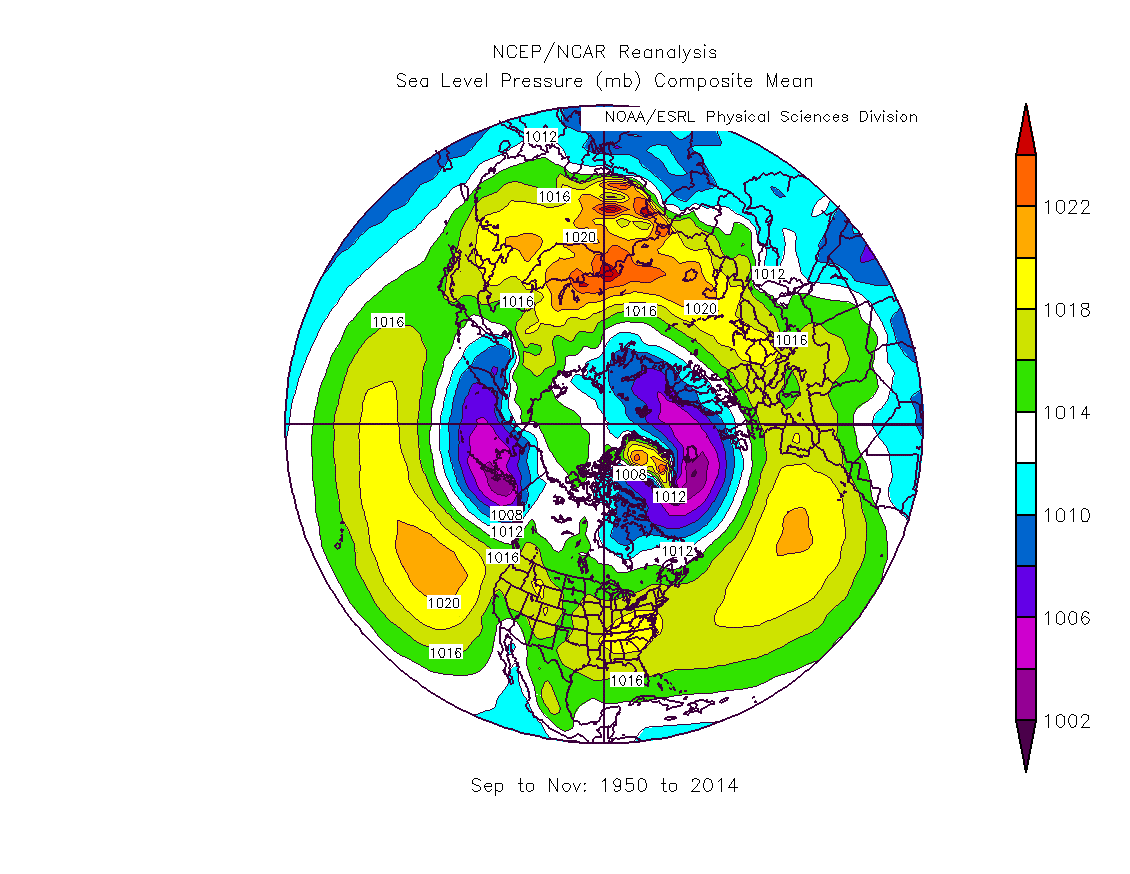
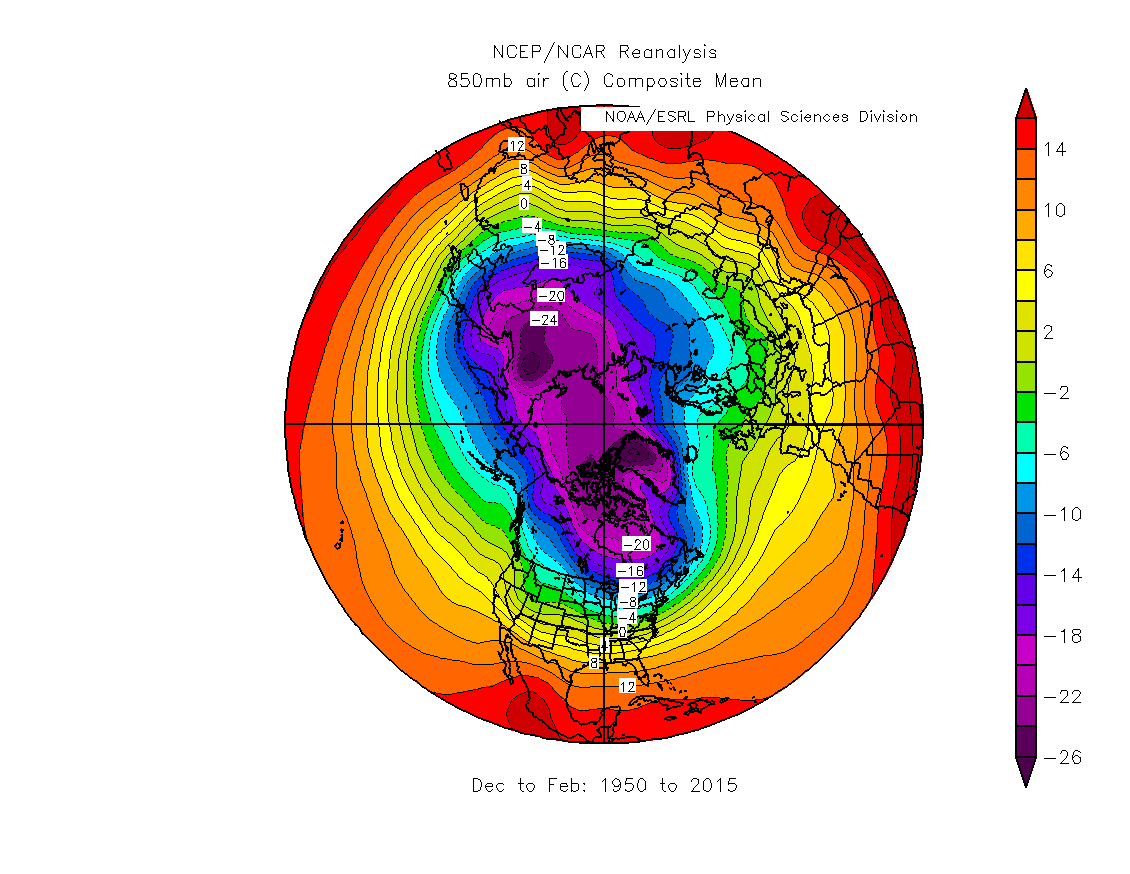
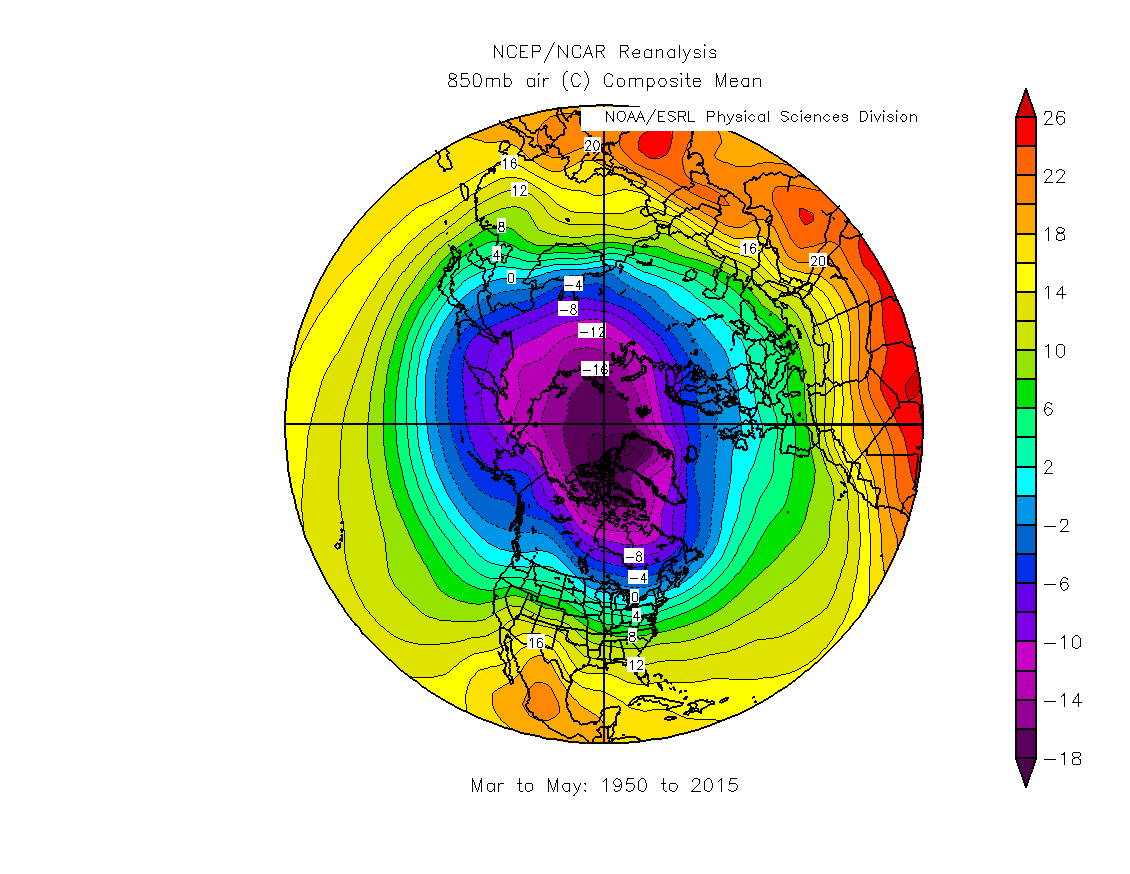
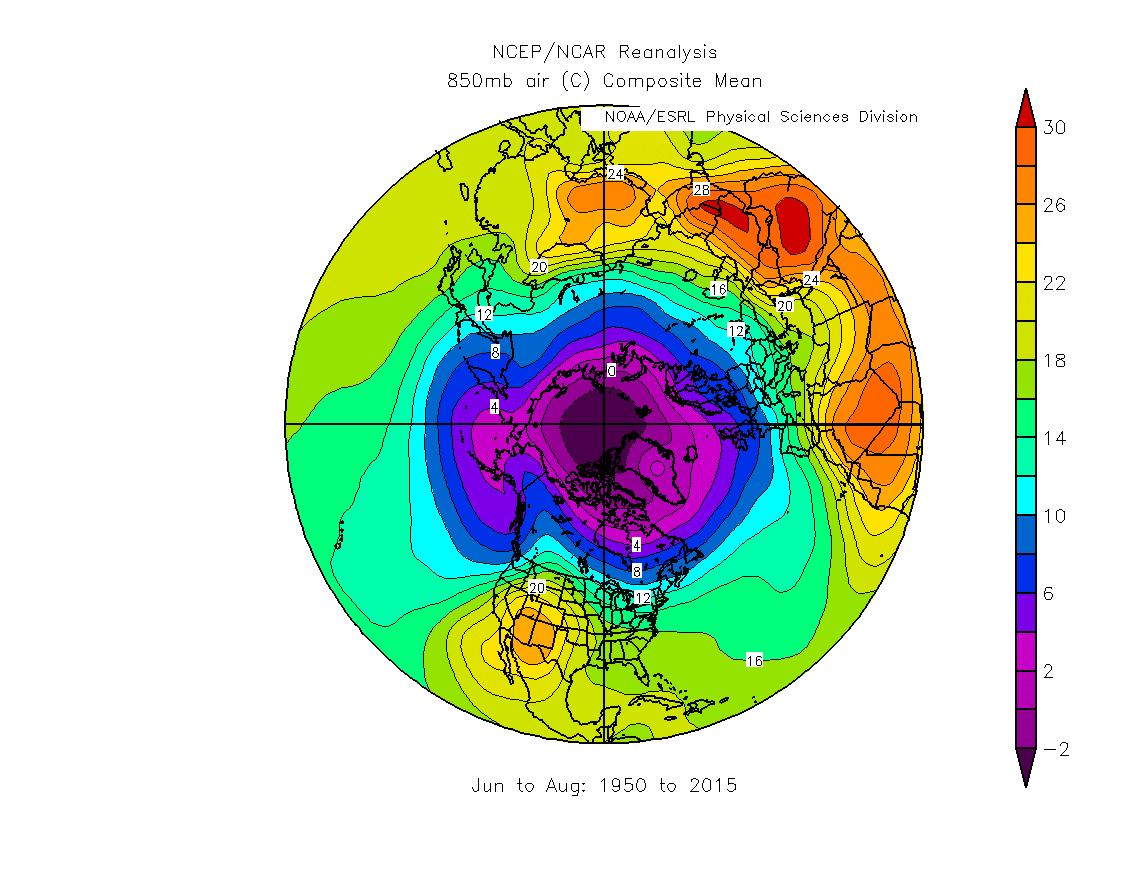
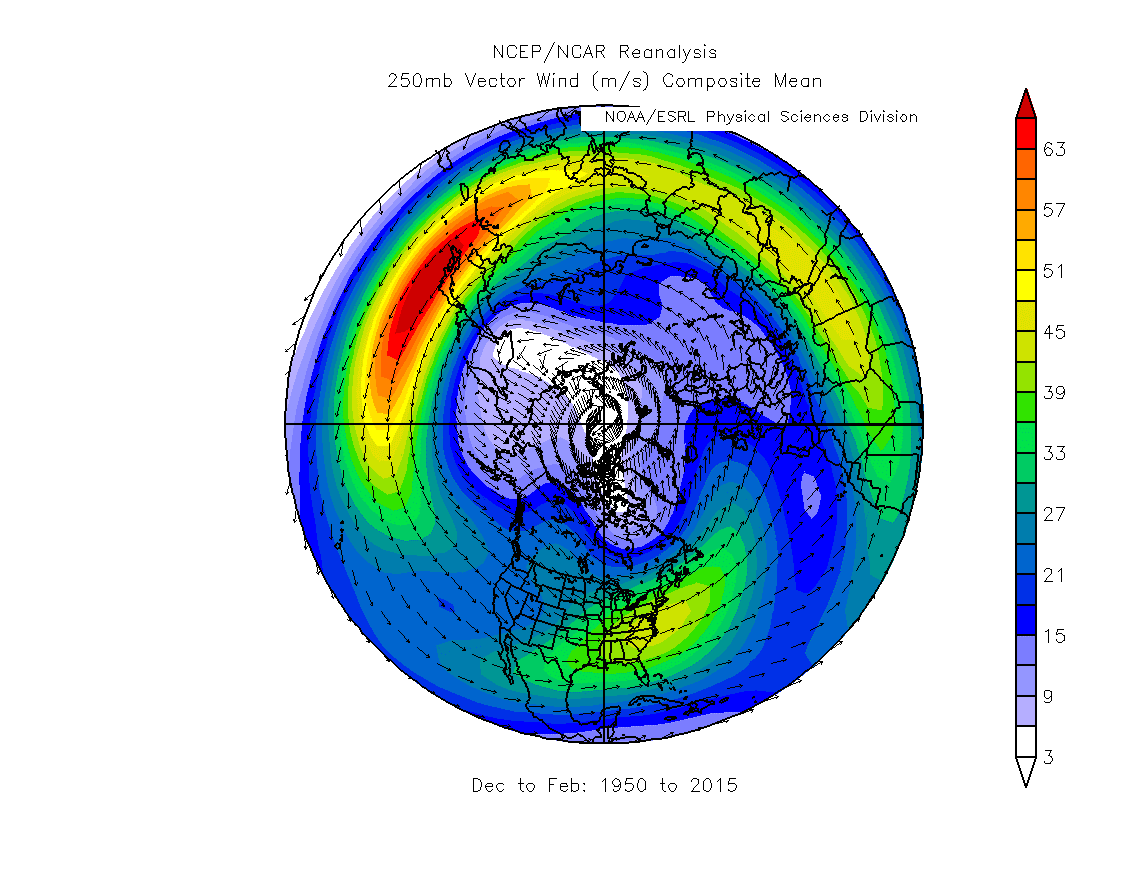
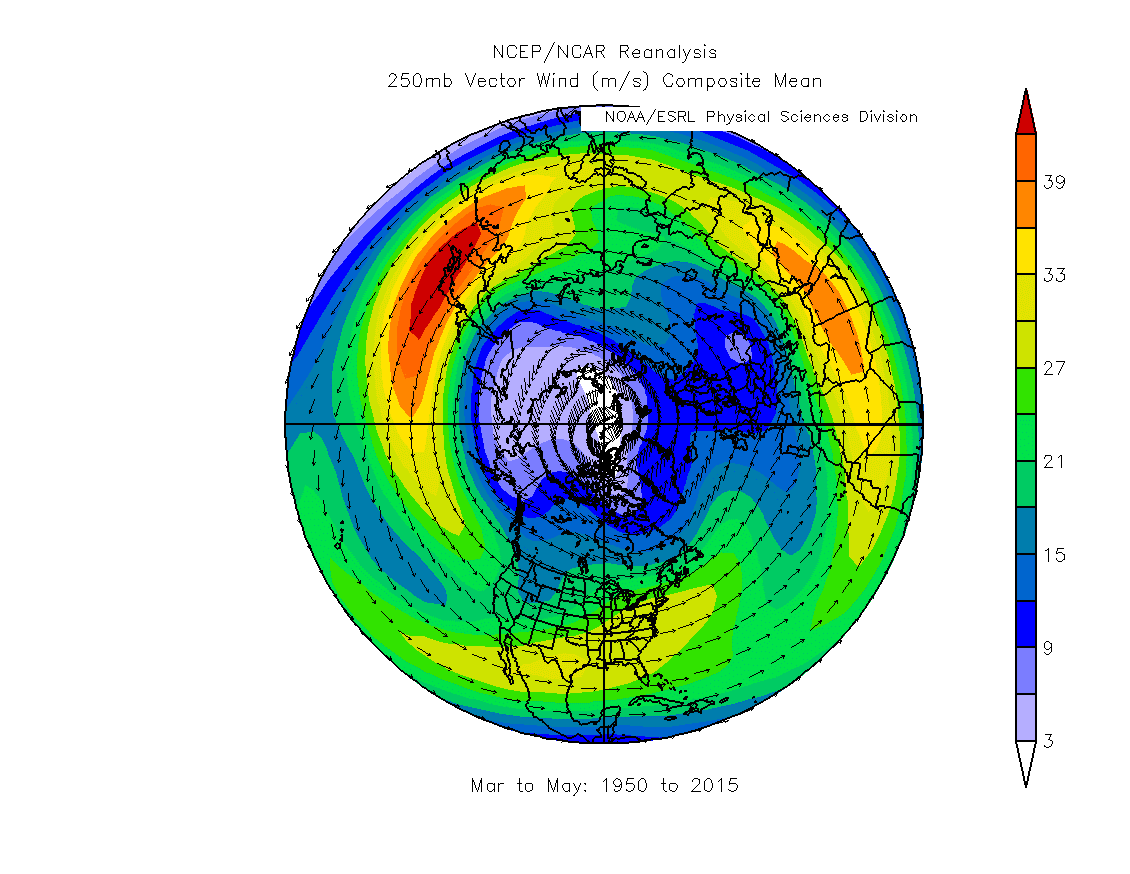
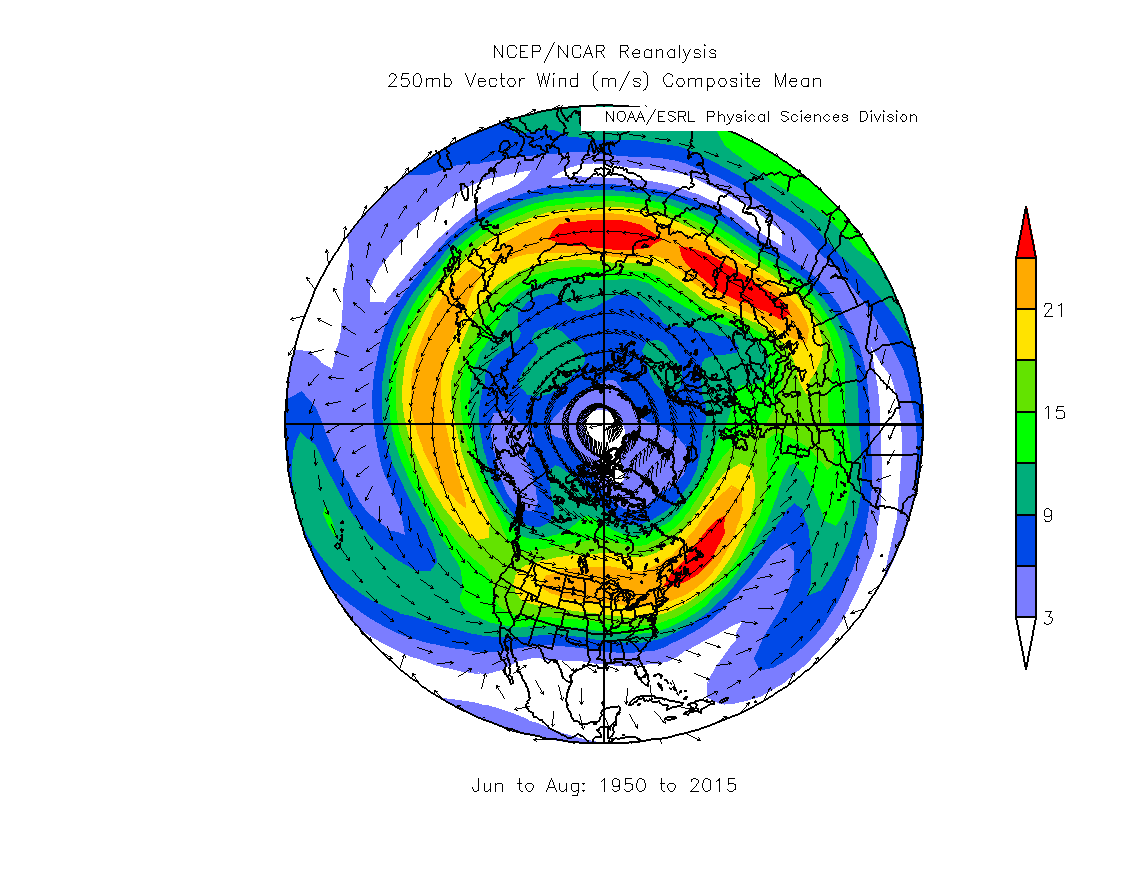
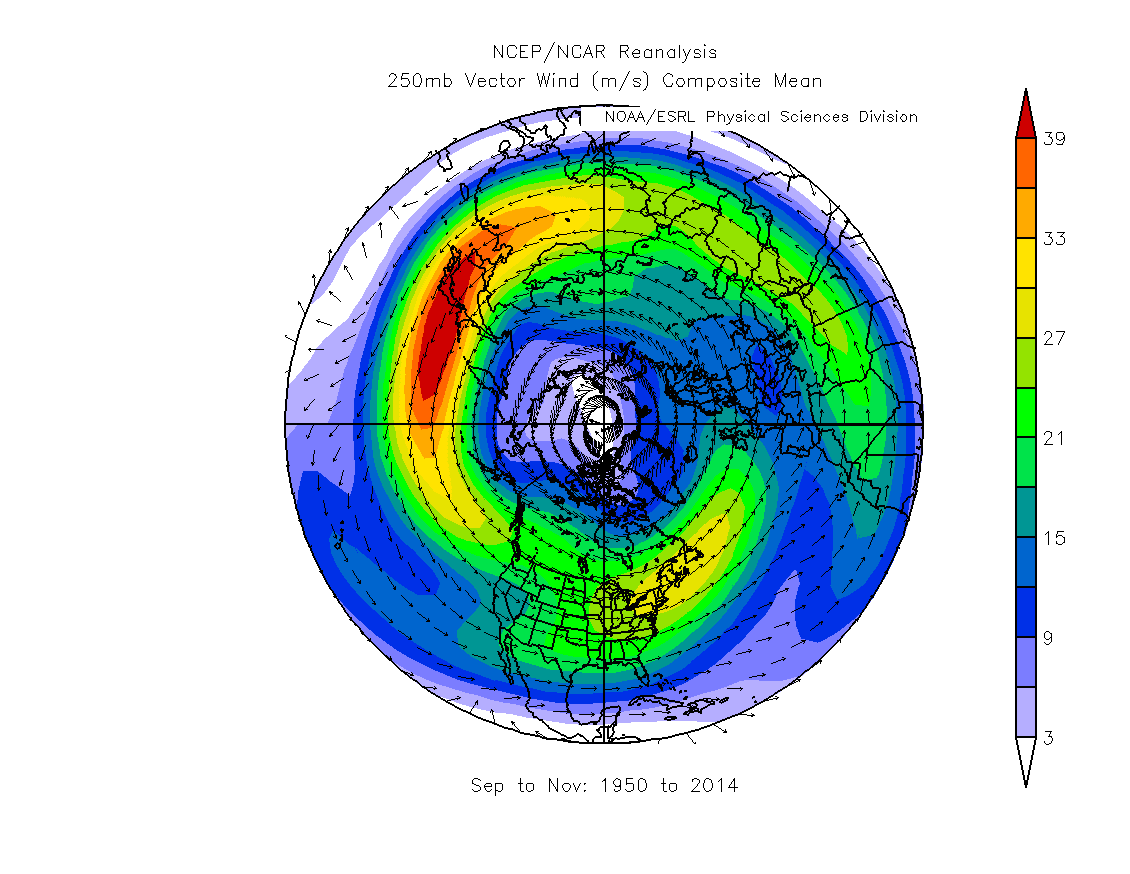
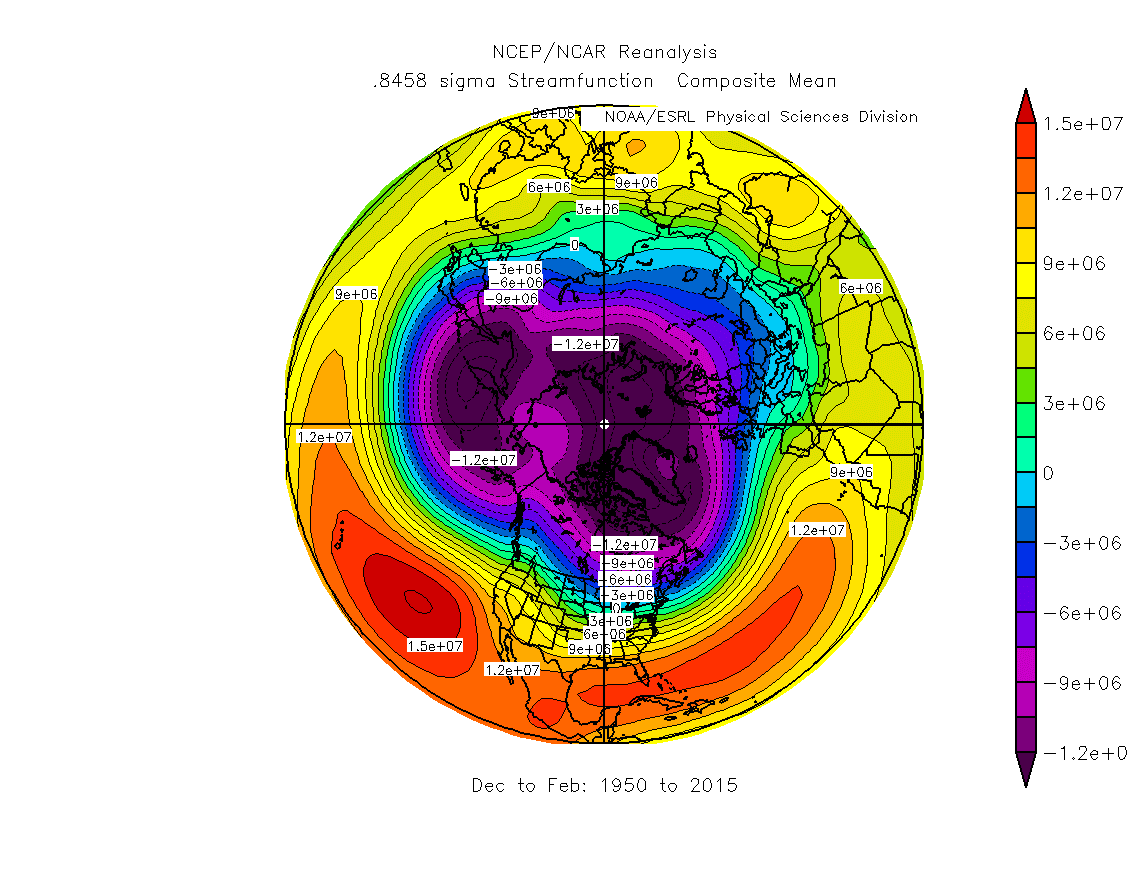
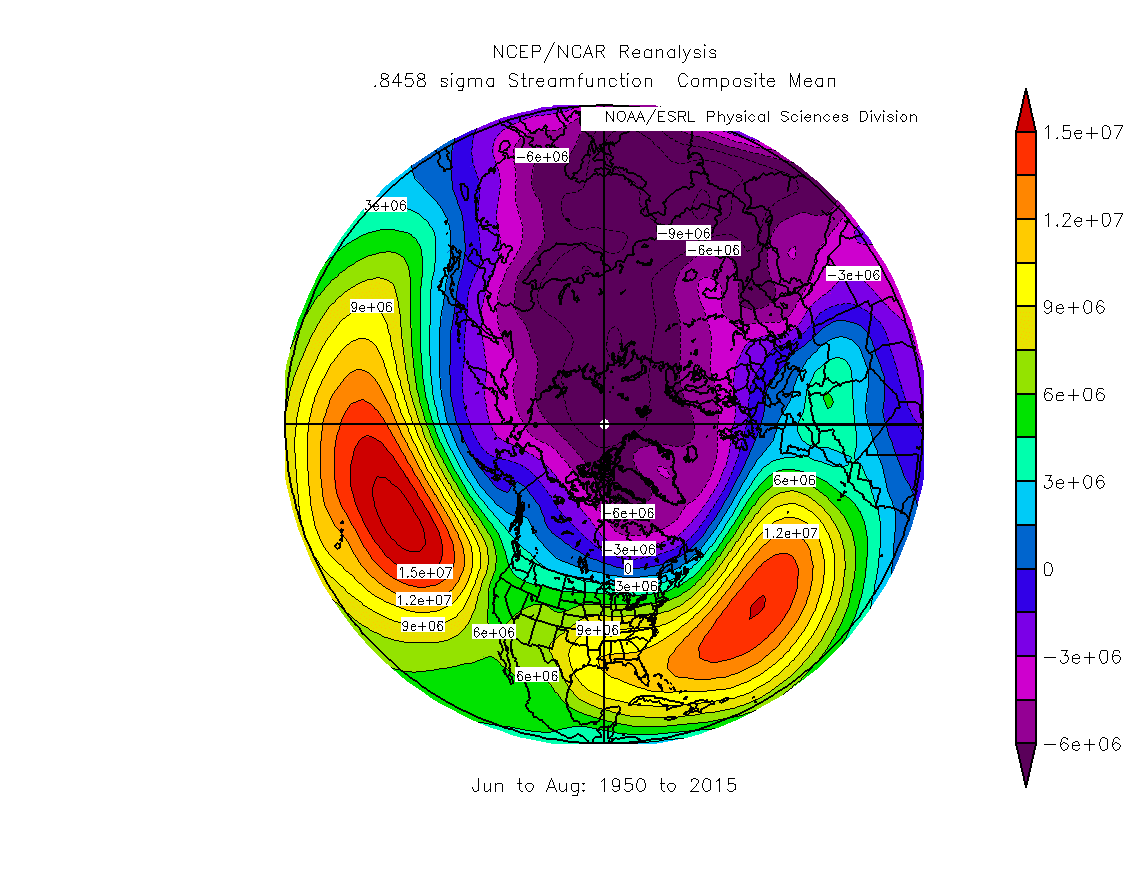
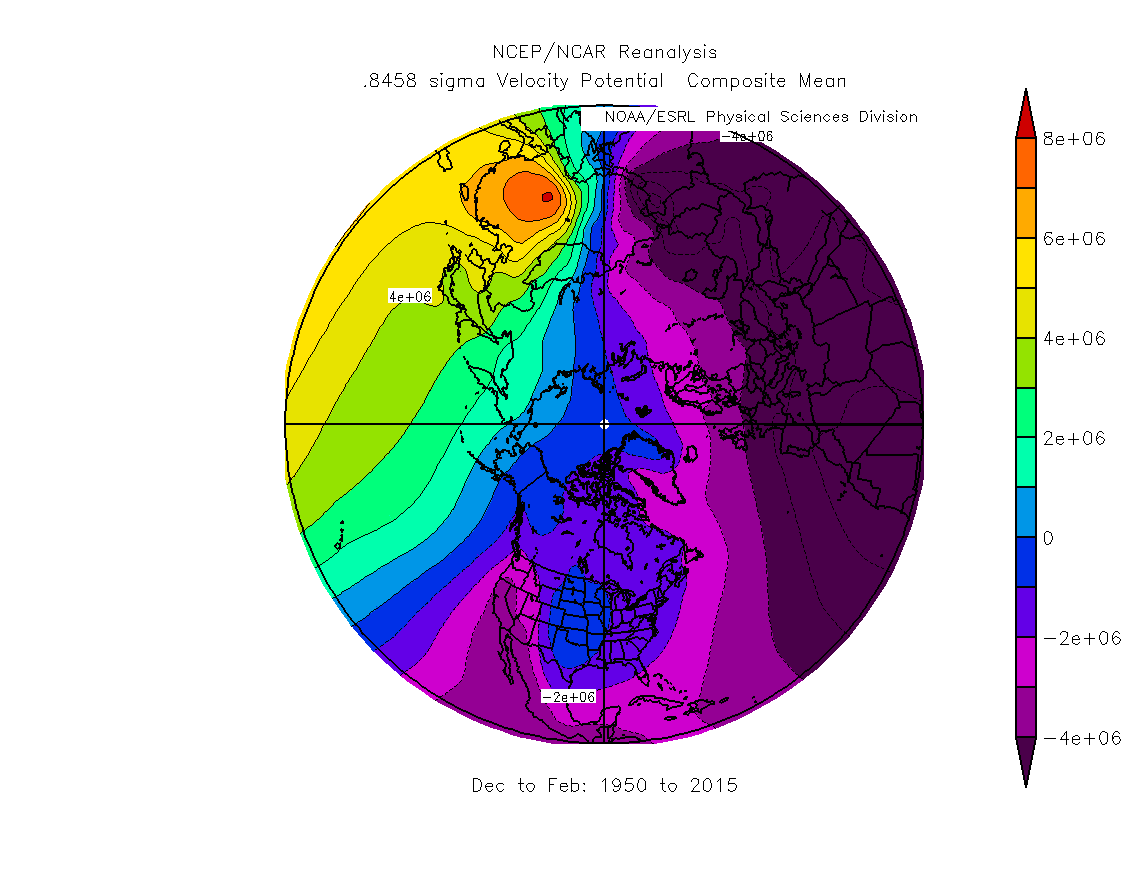
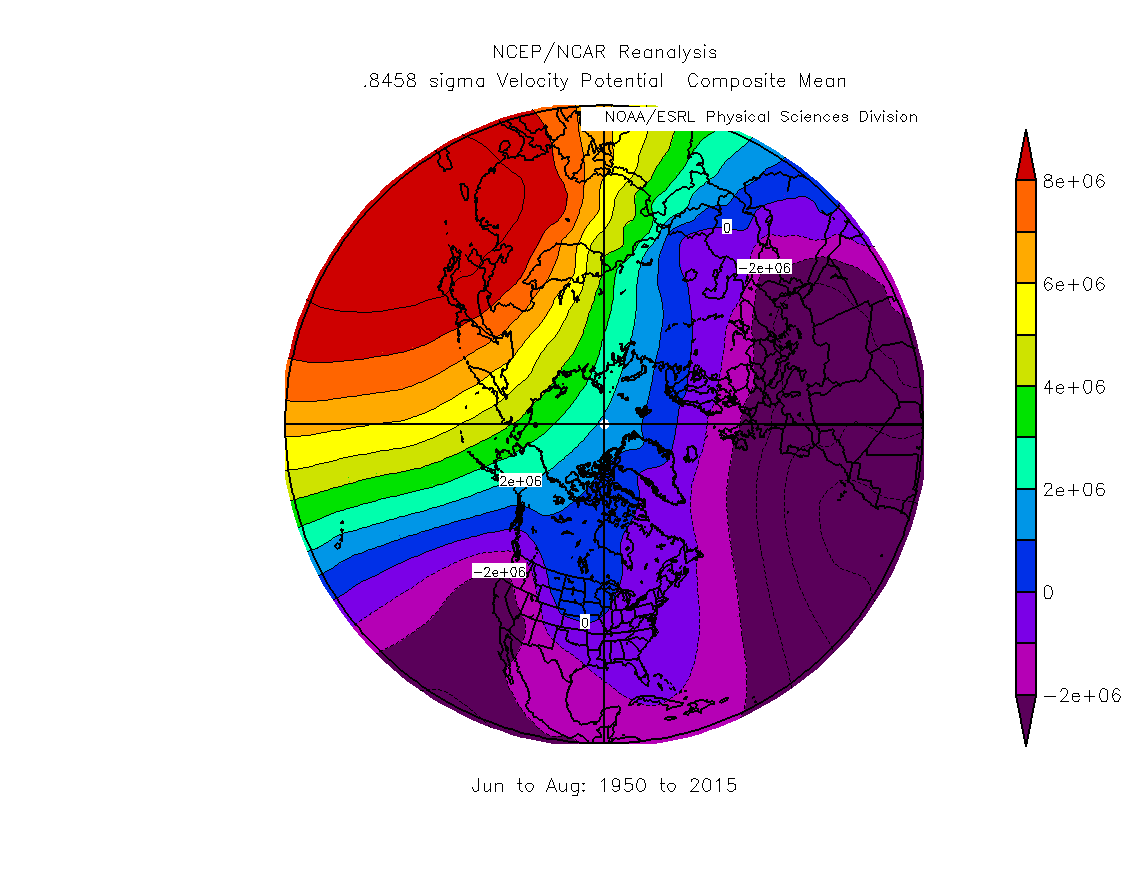
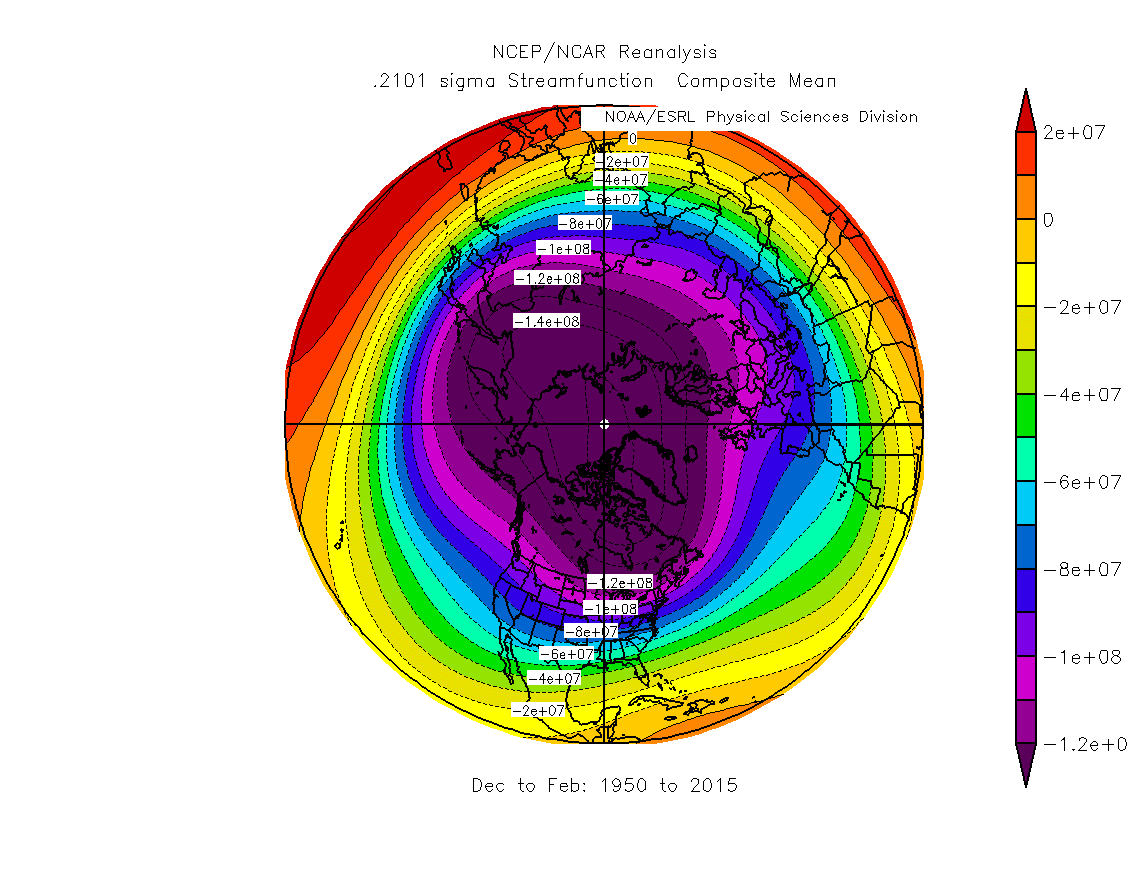
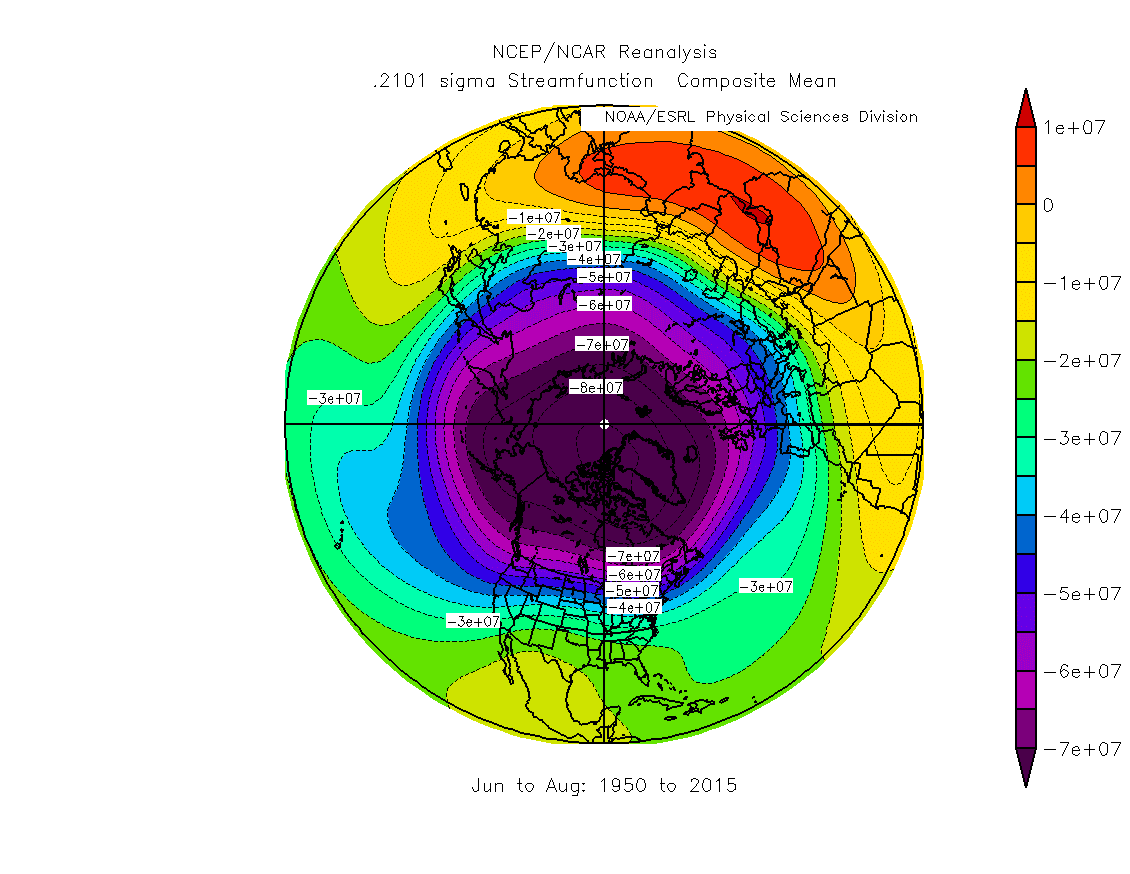
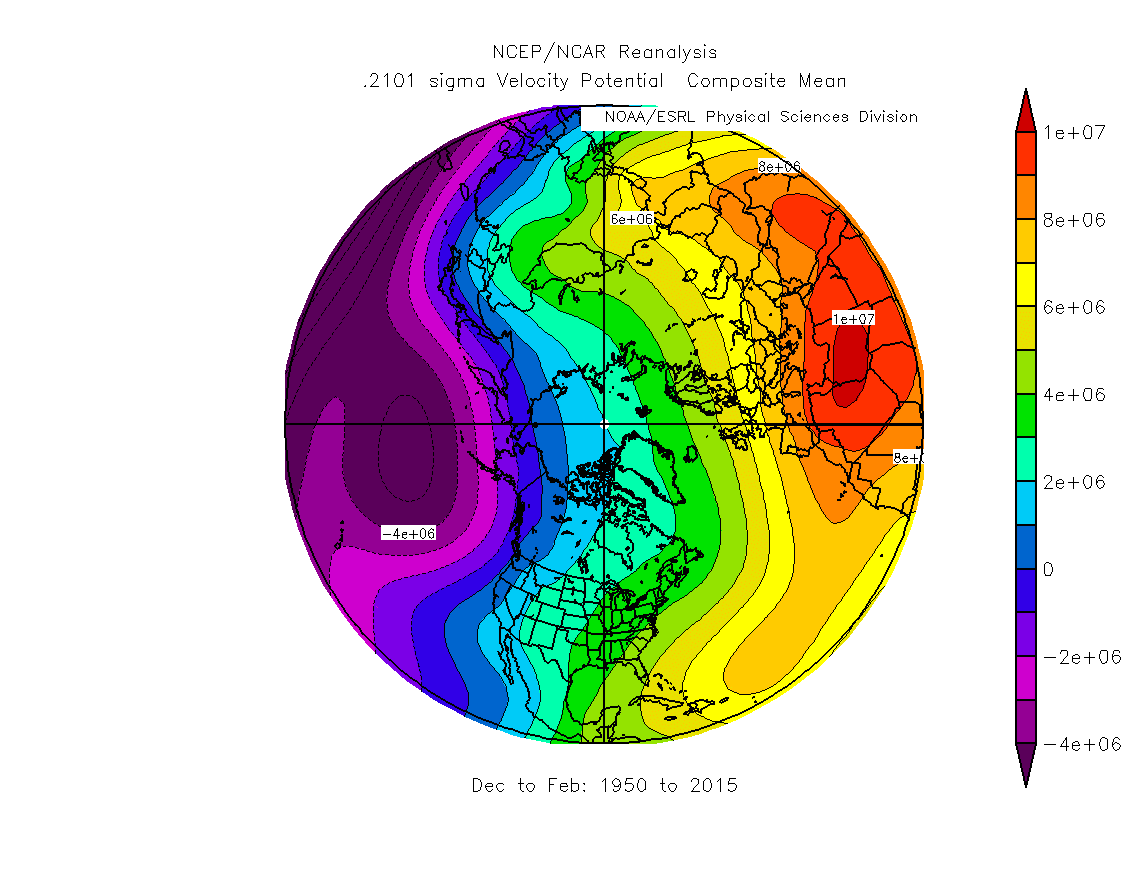
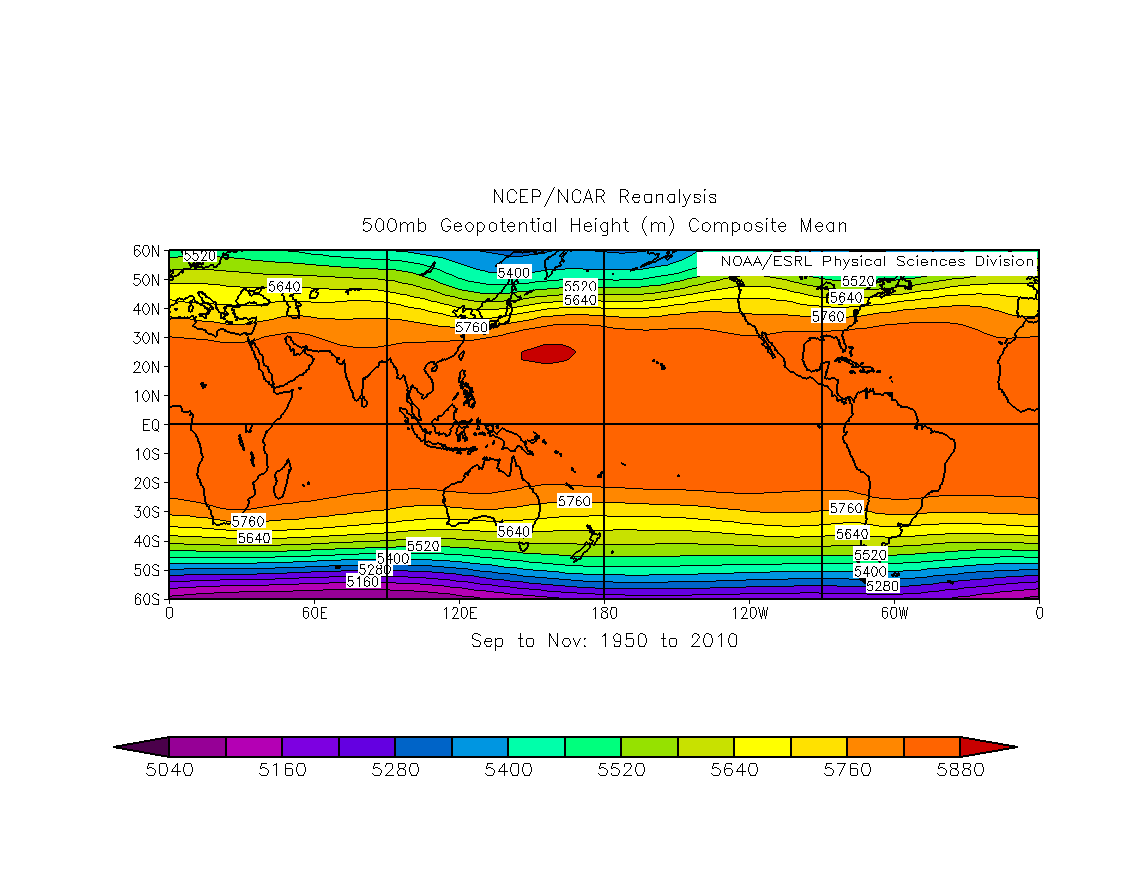
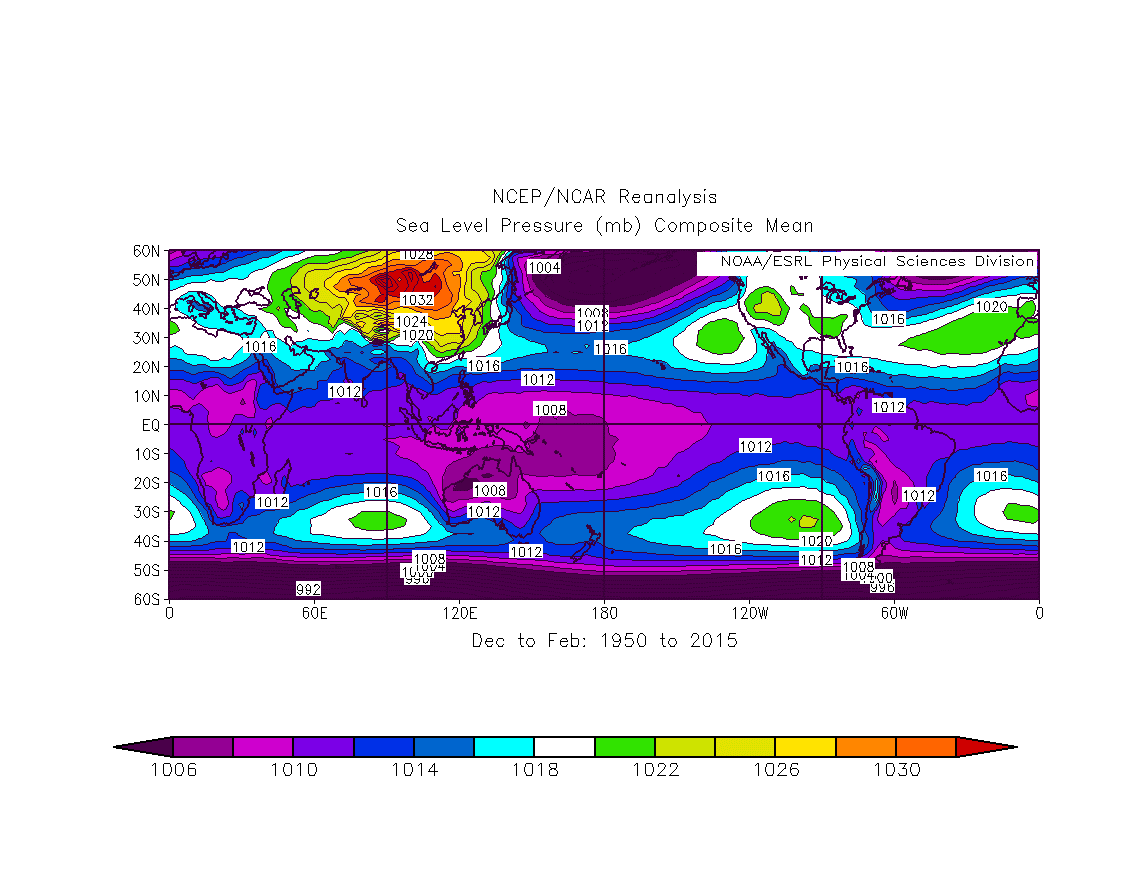
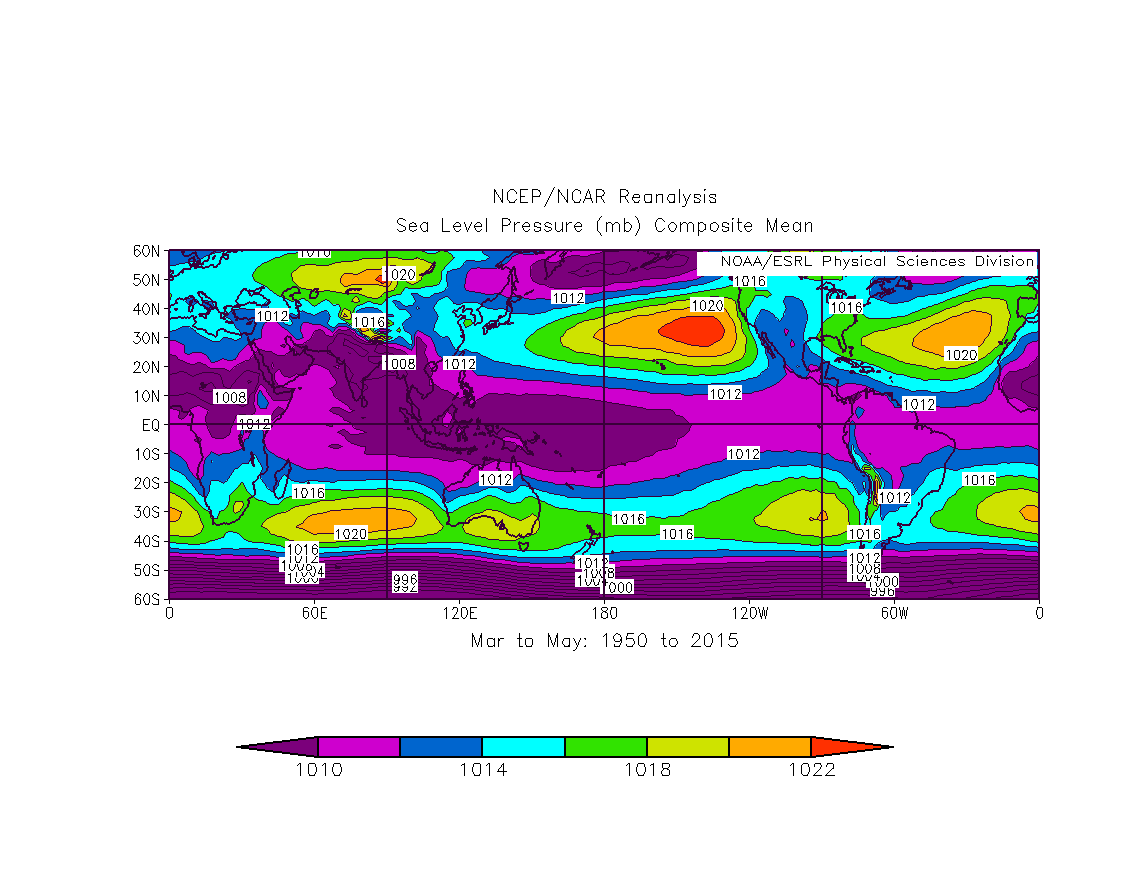
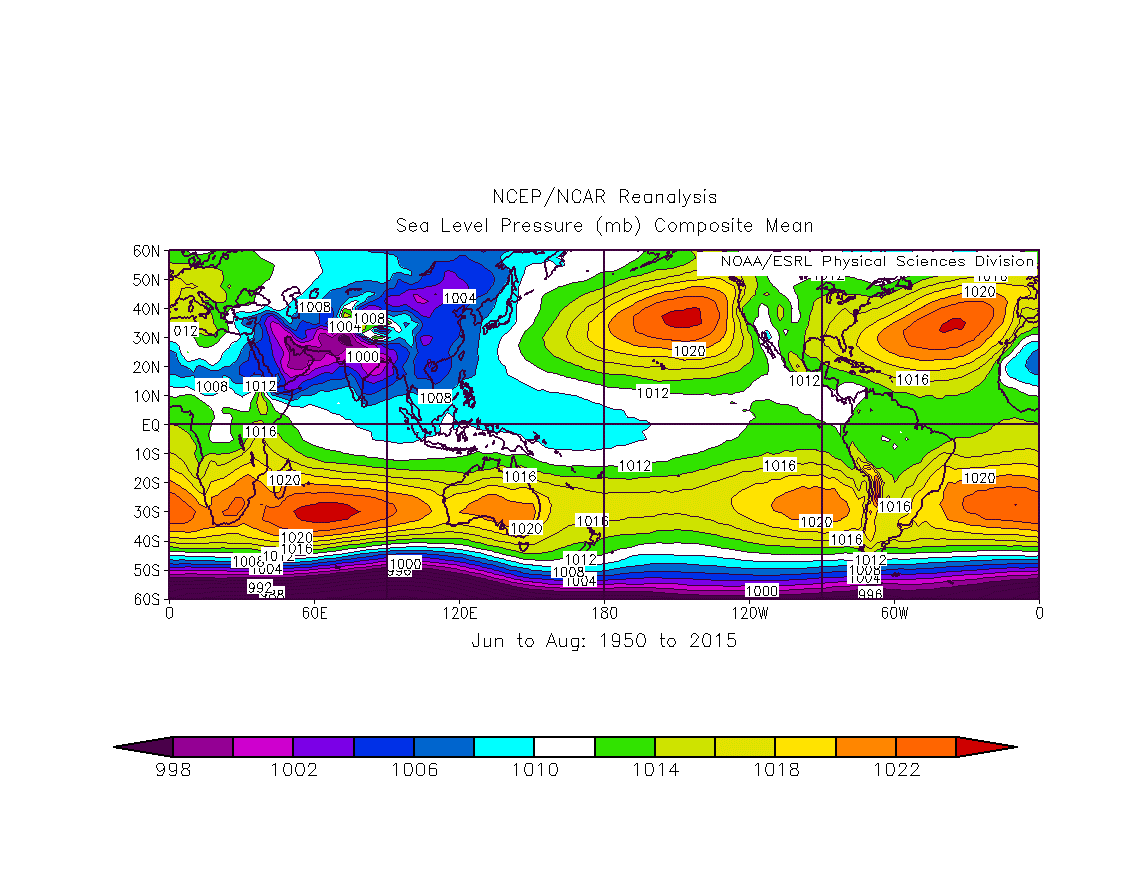
Northern Hemisphere Mean Flow Patterns (1950-2015, except SON through 2014)
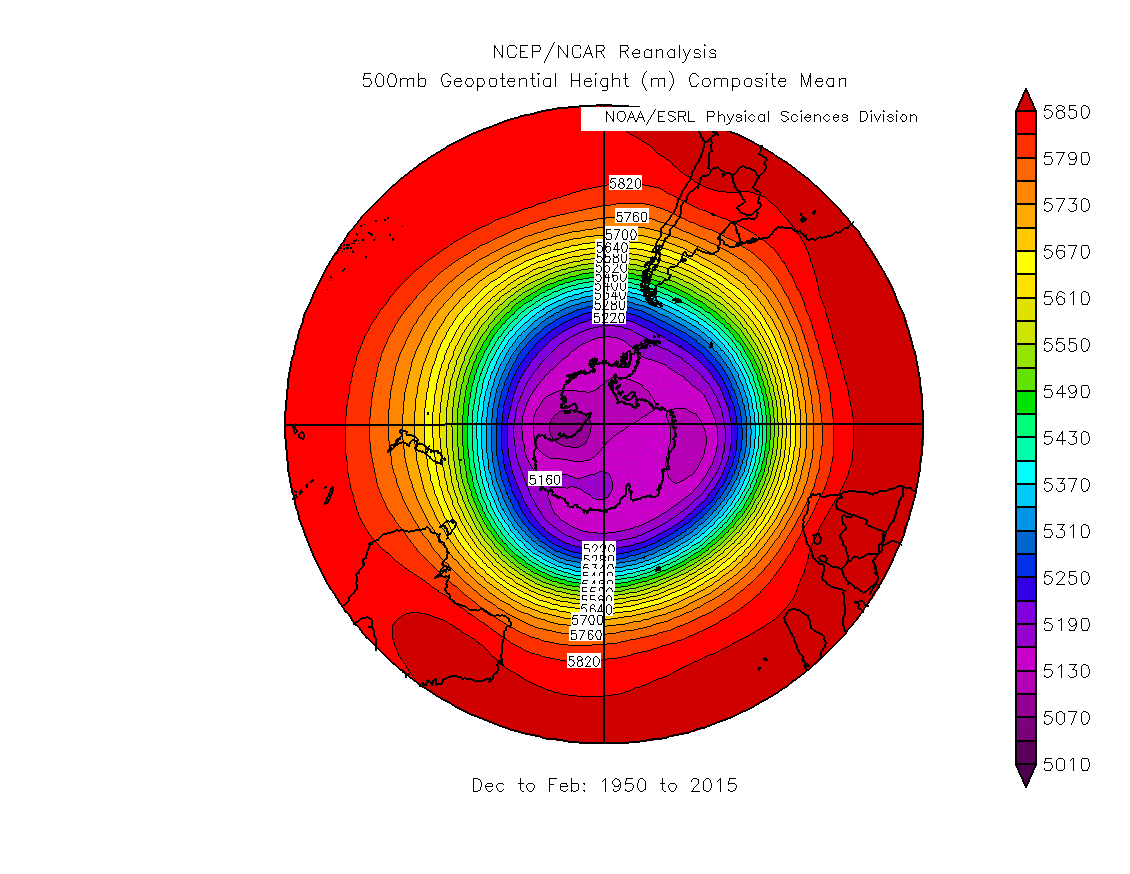
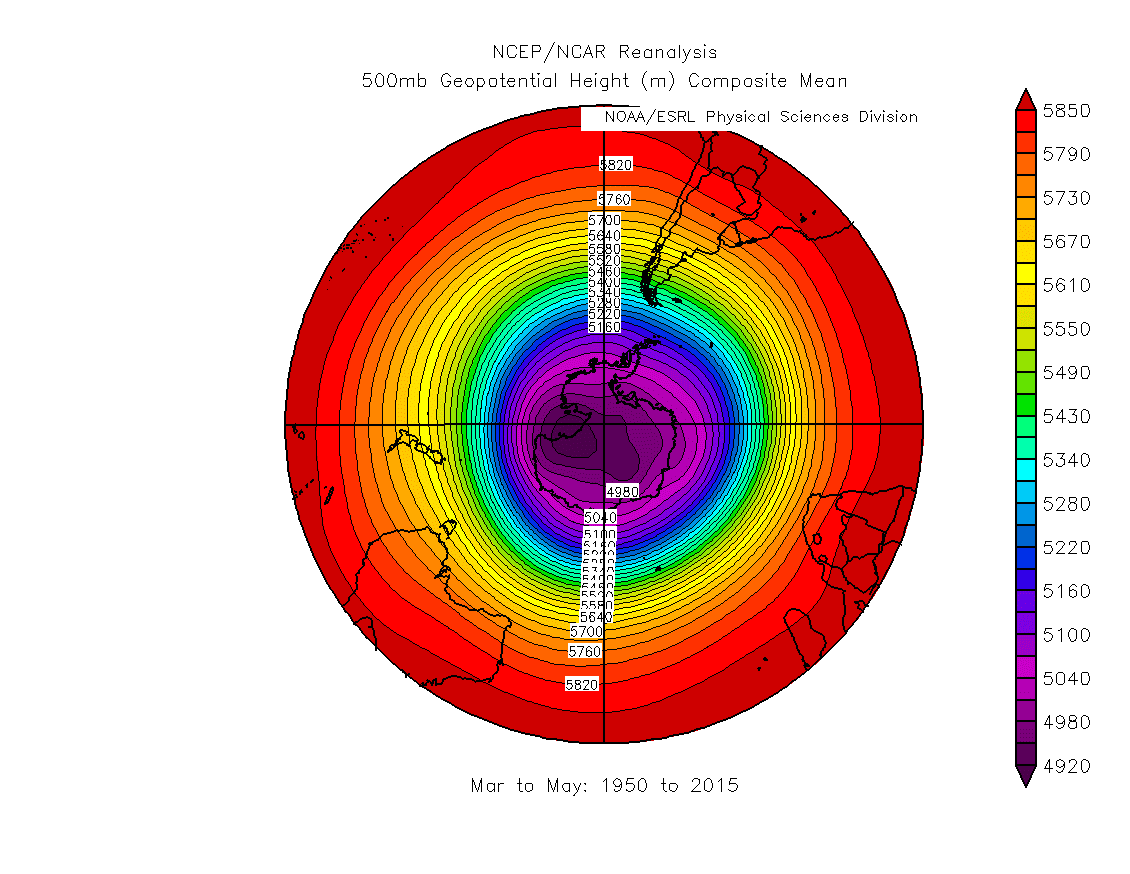
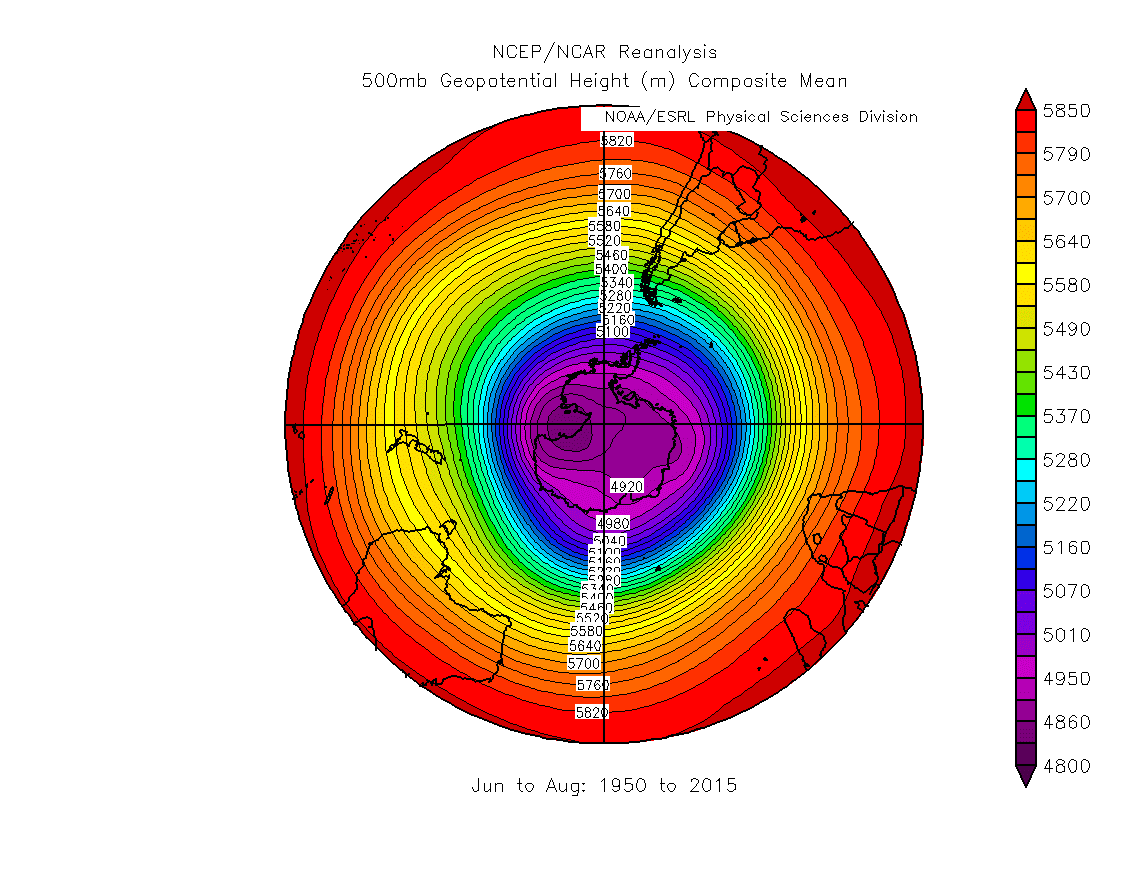
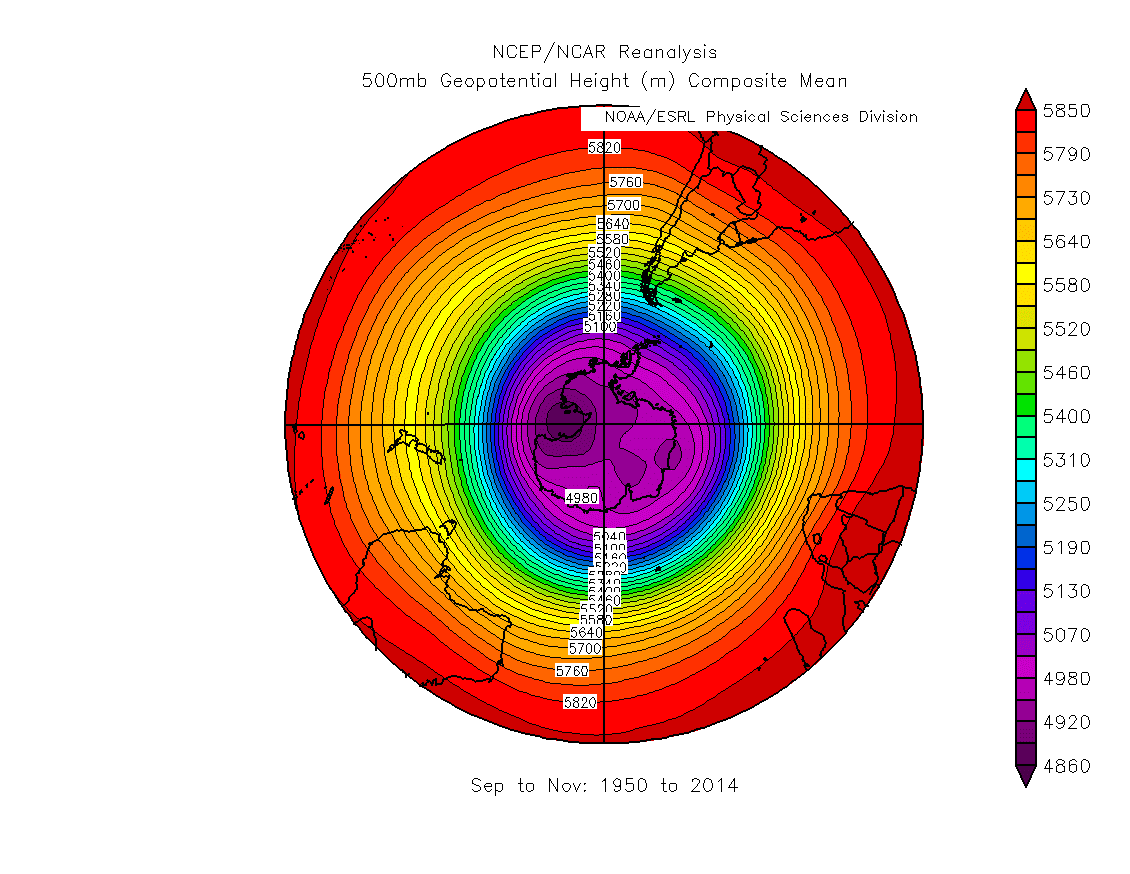
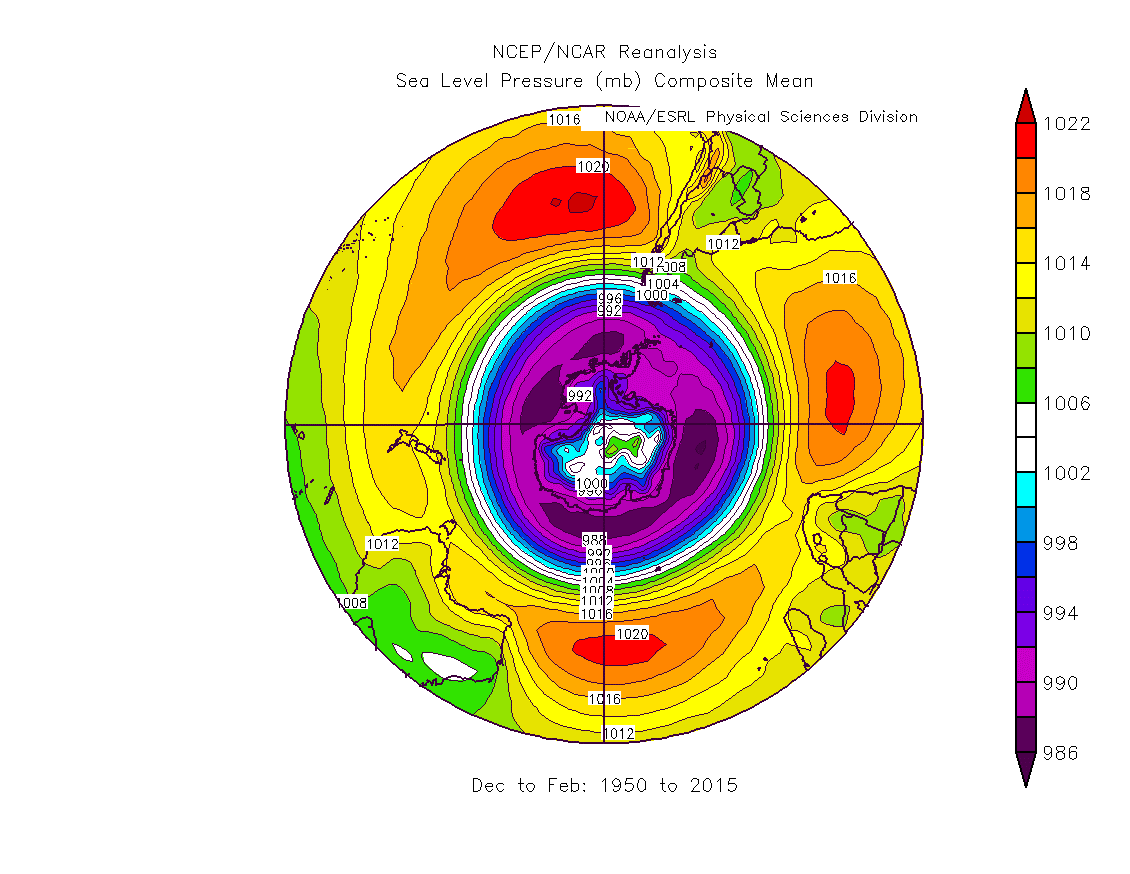
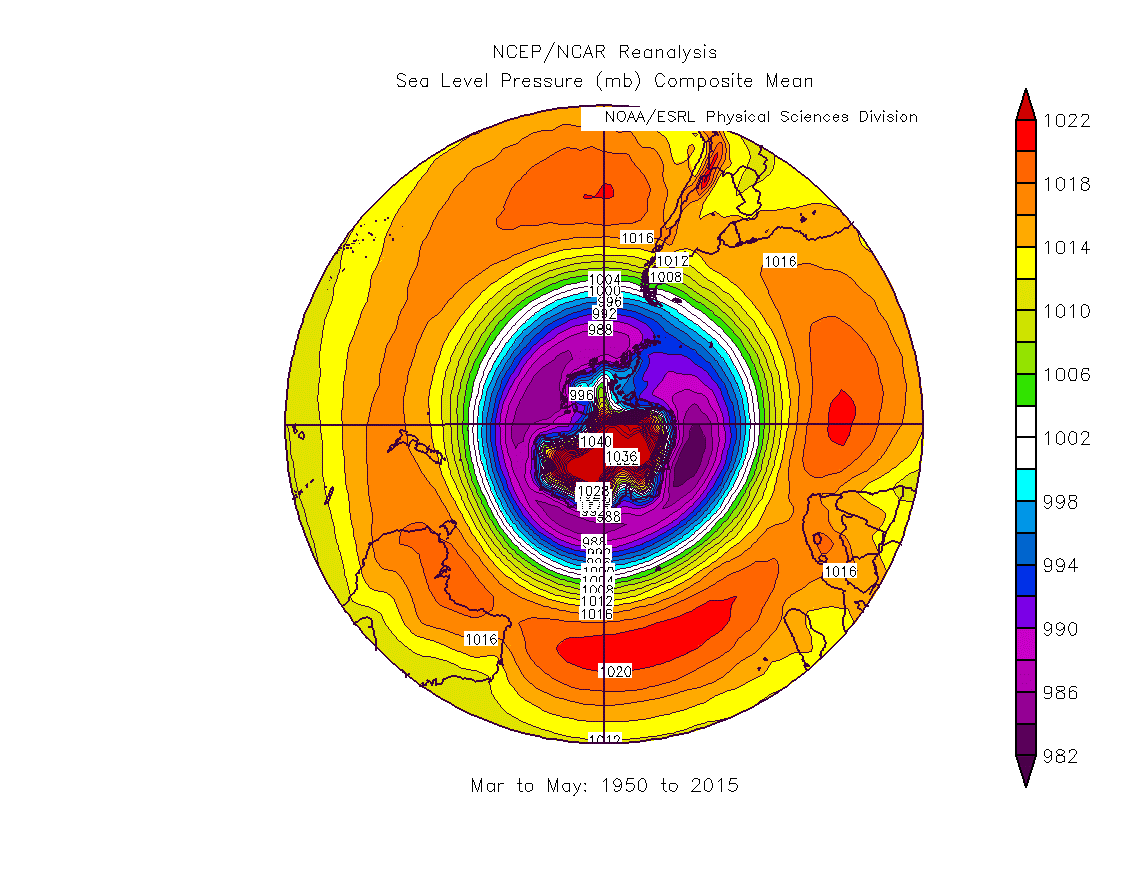
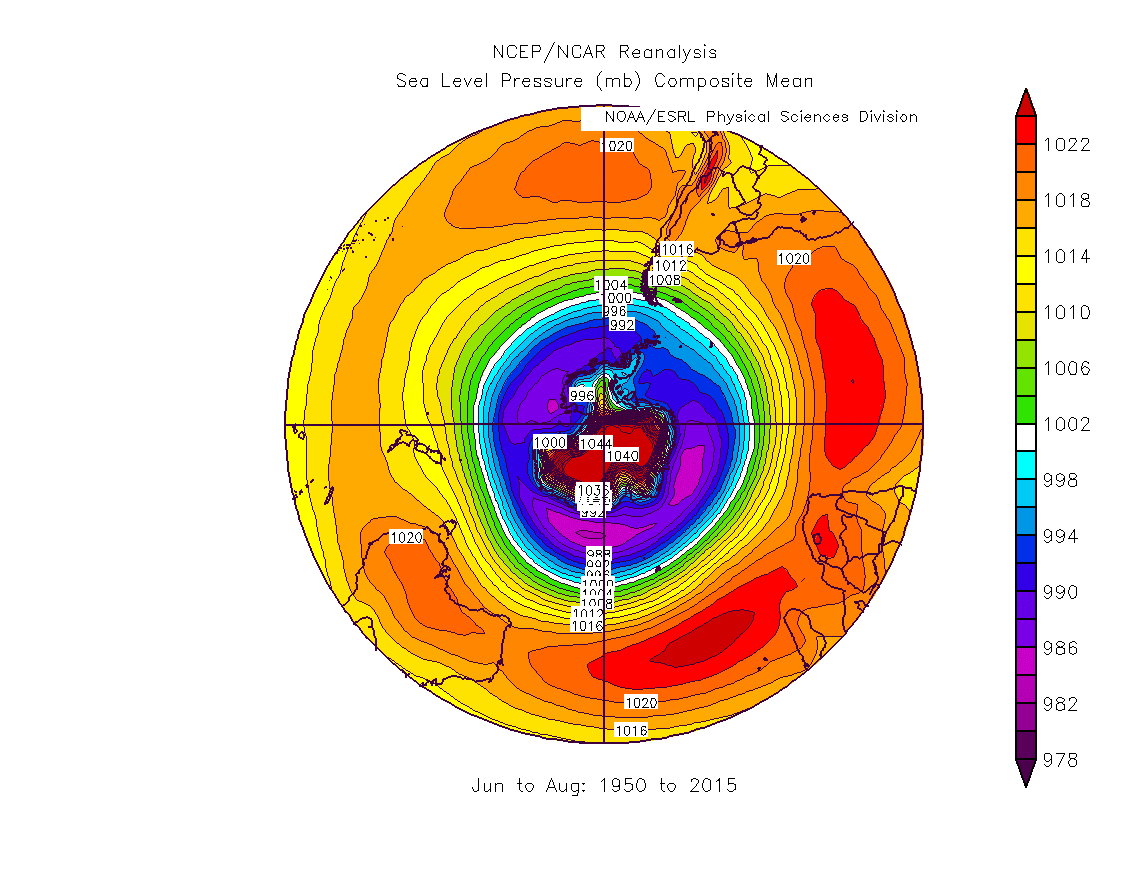
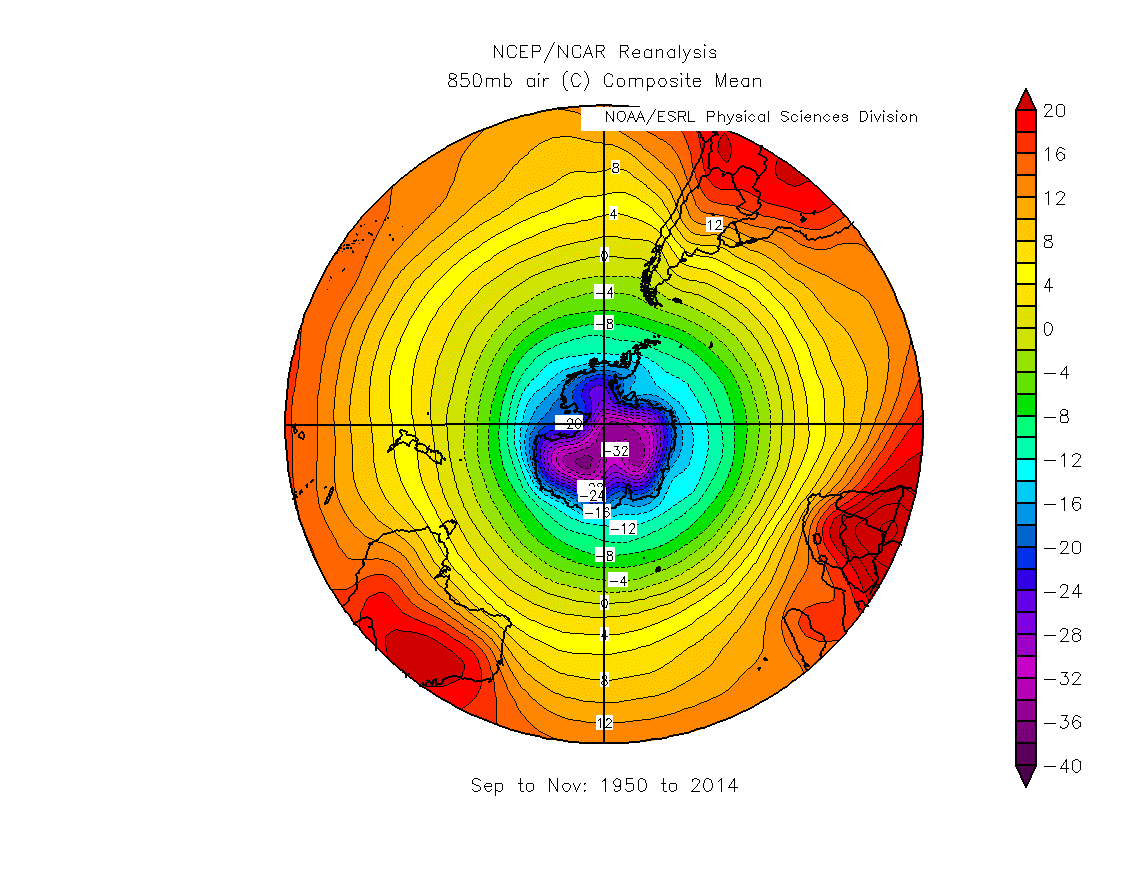
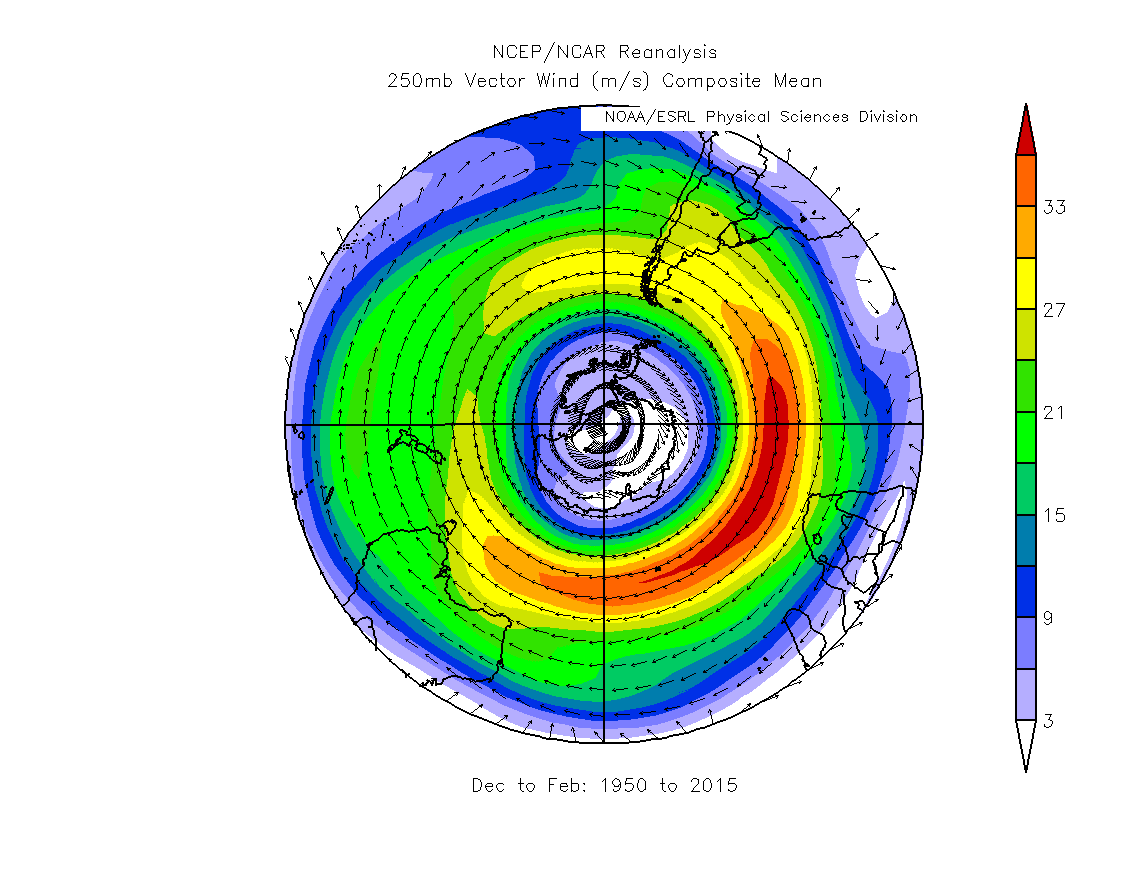
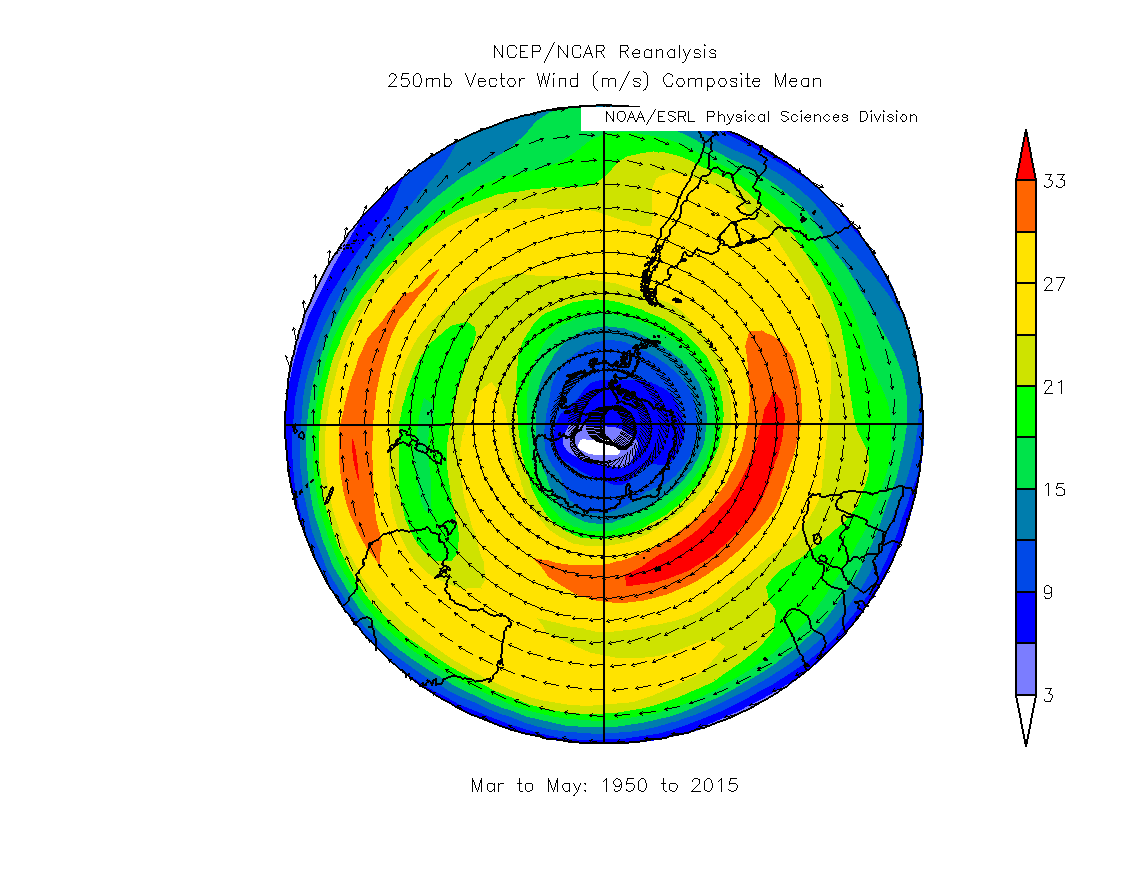
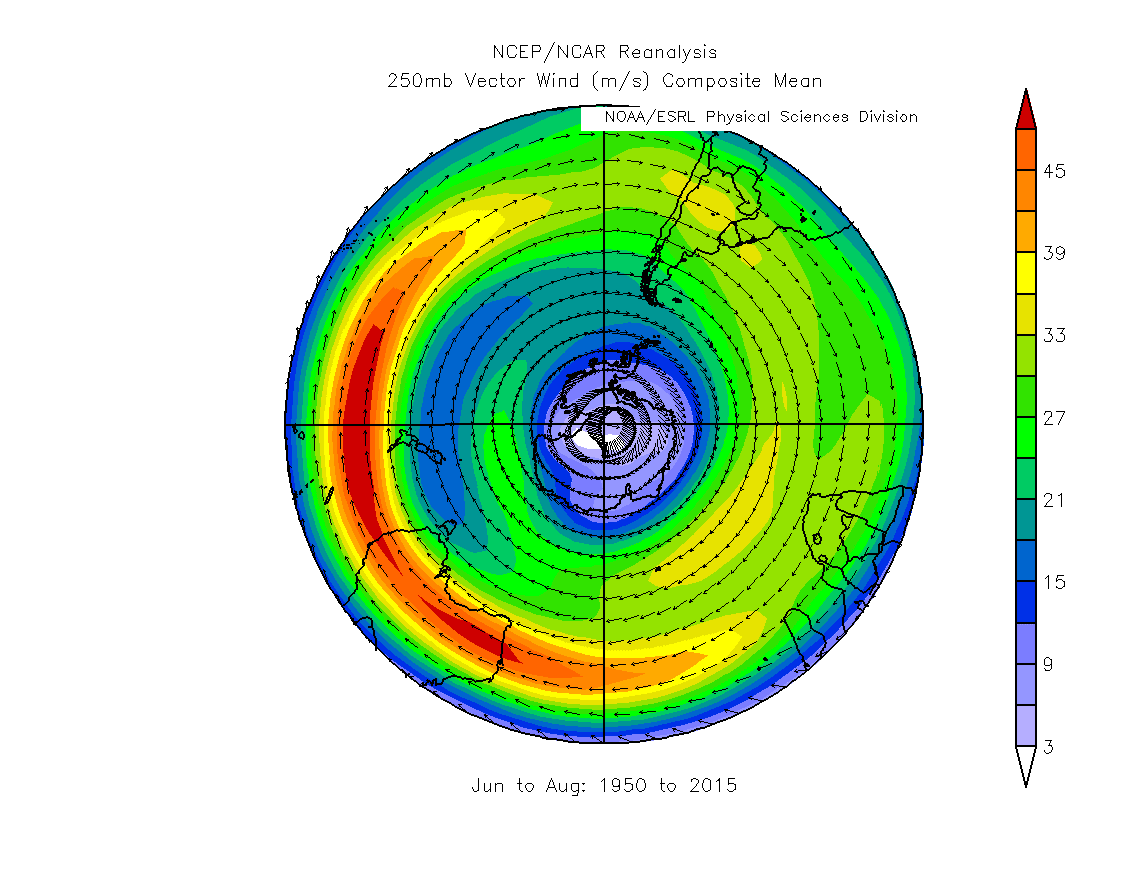
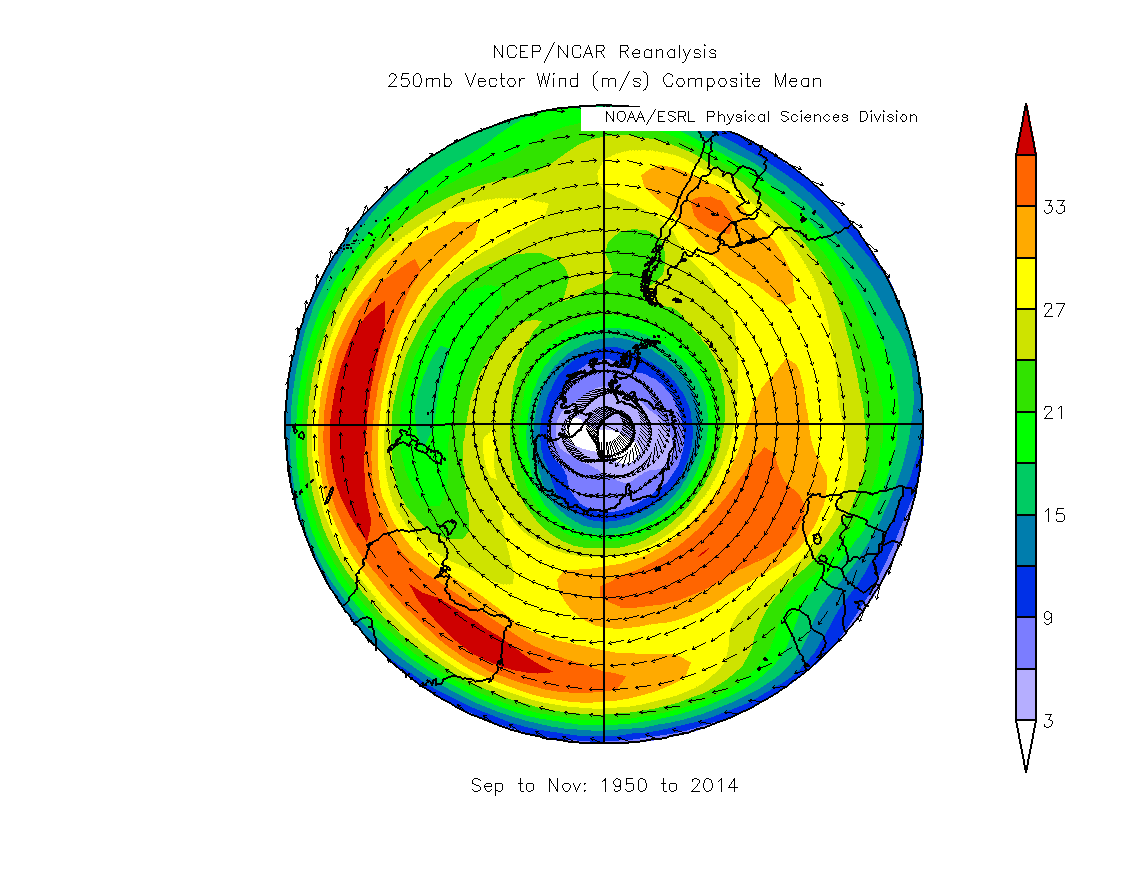
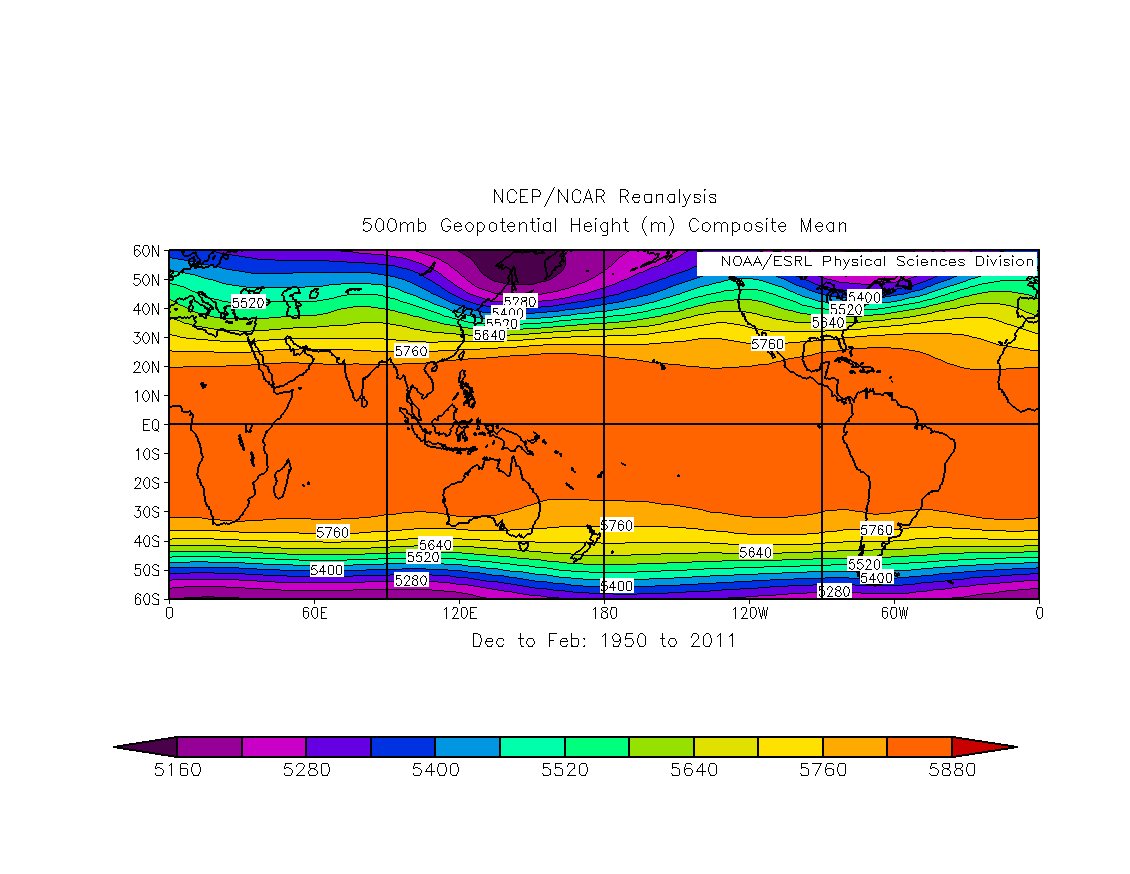
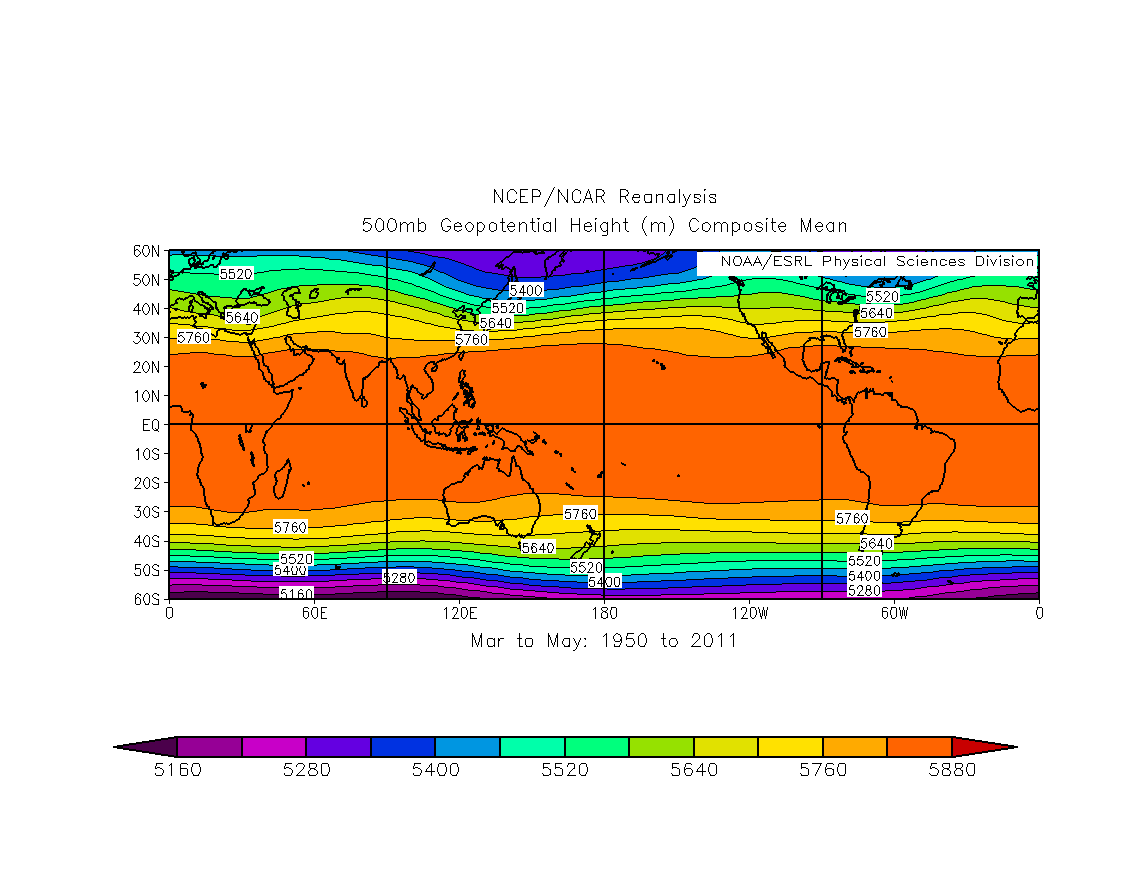
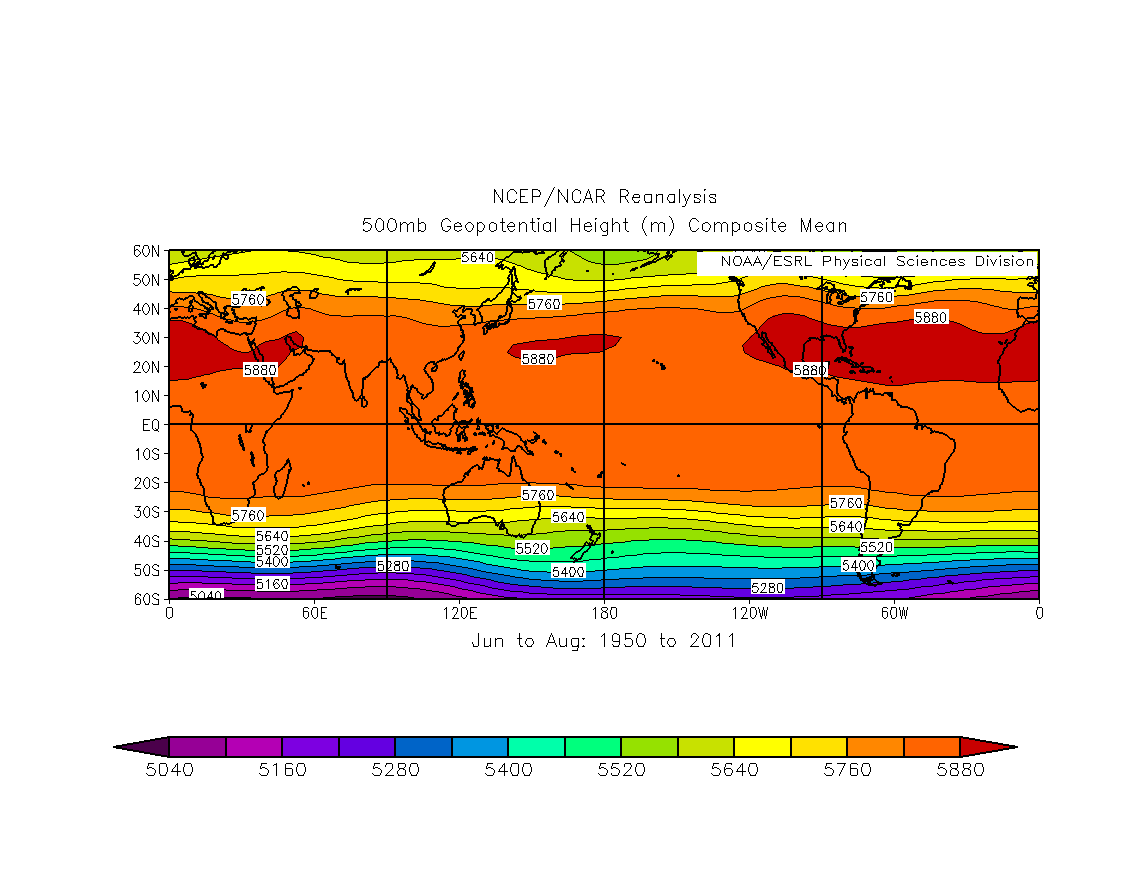
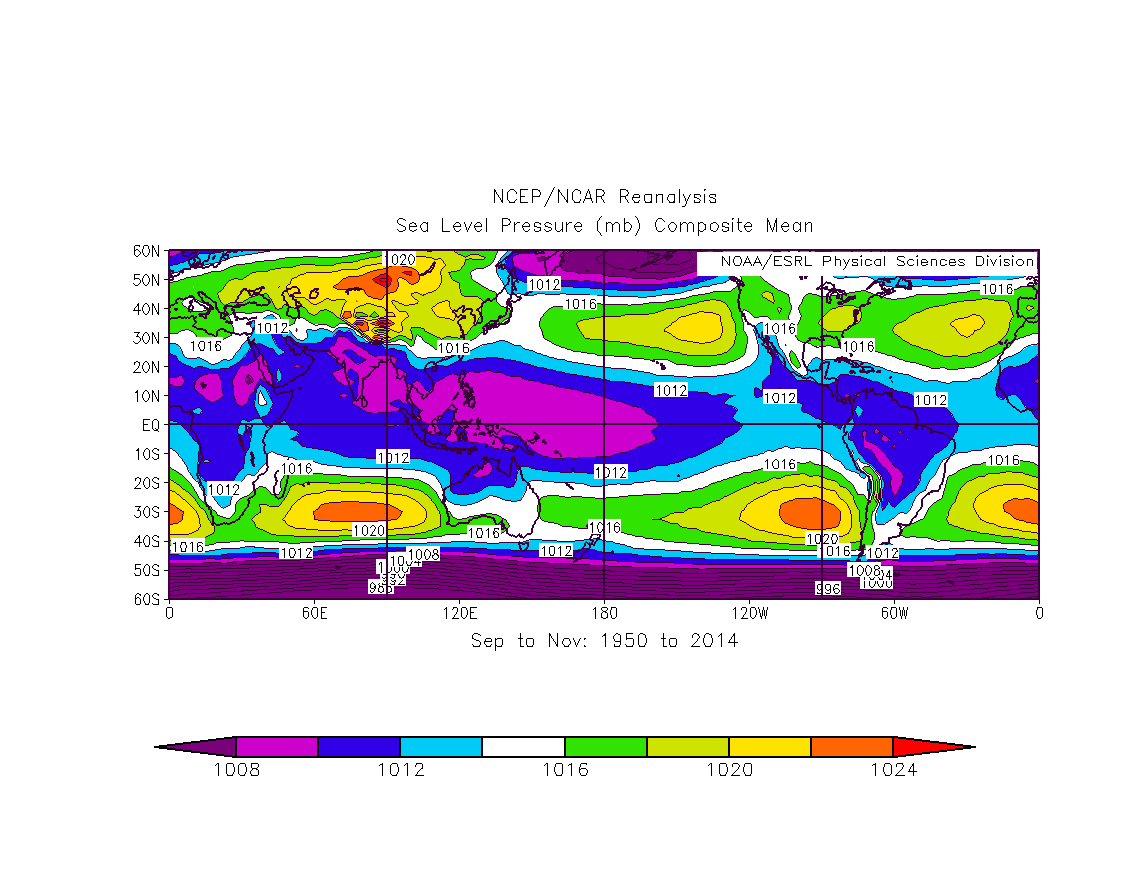
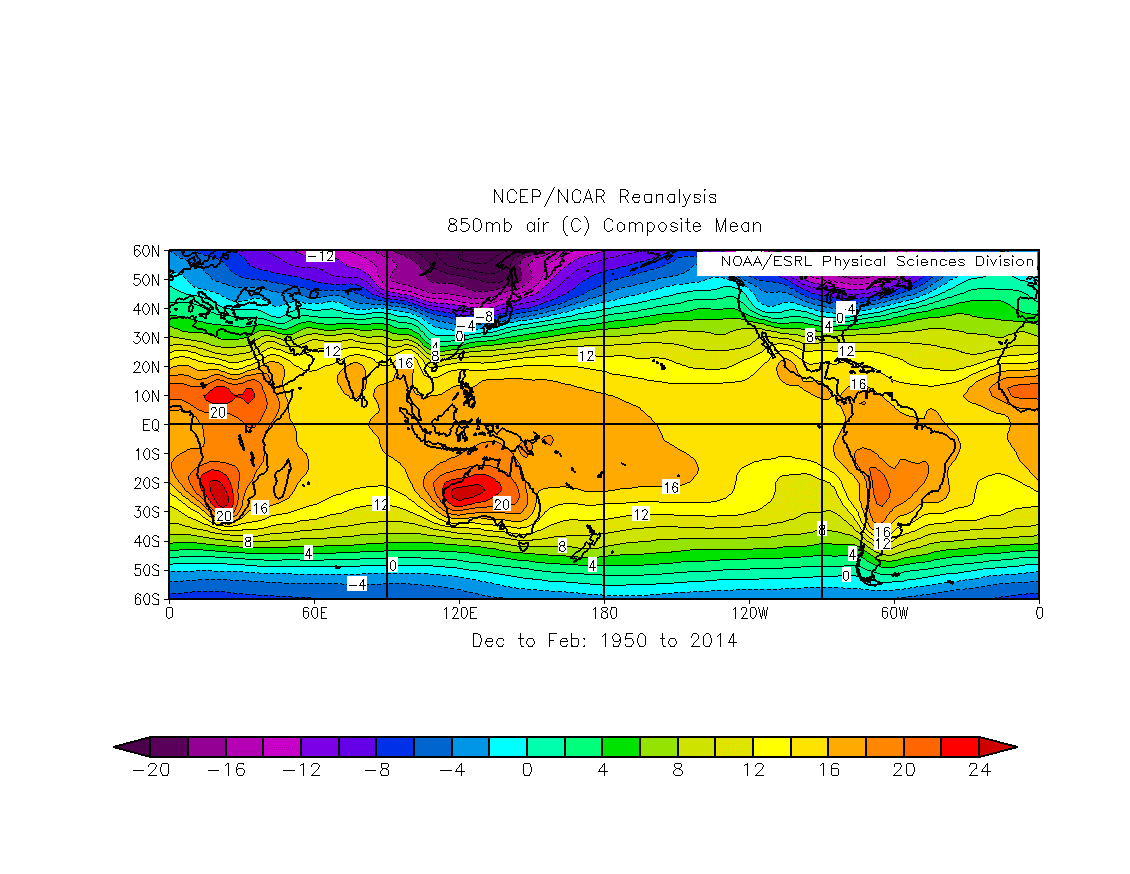
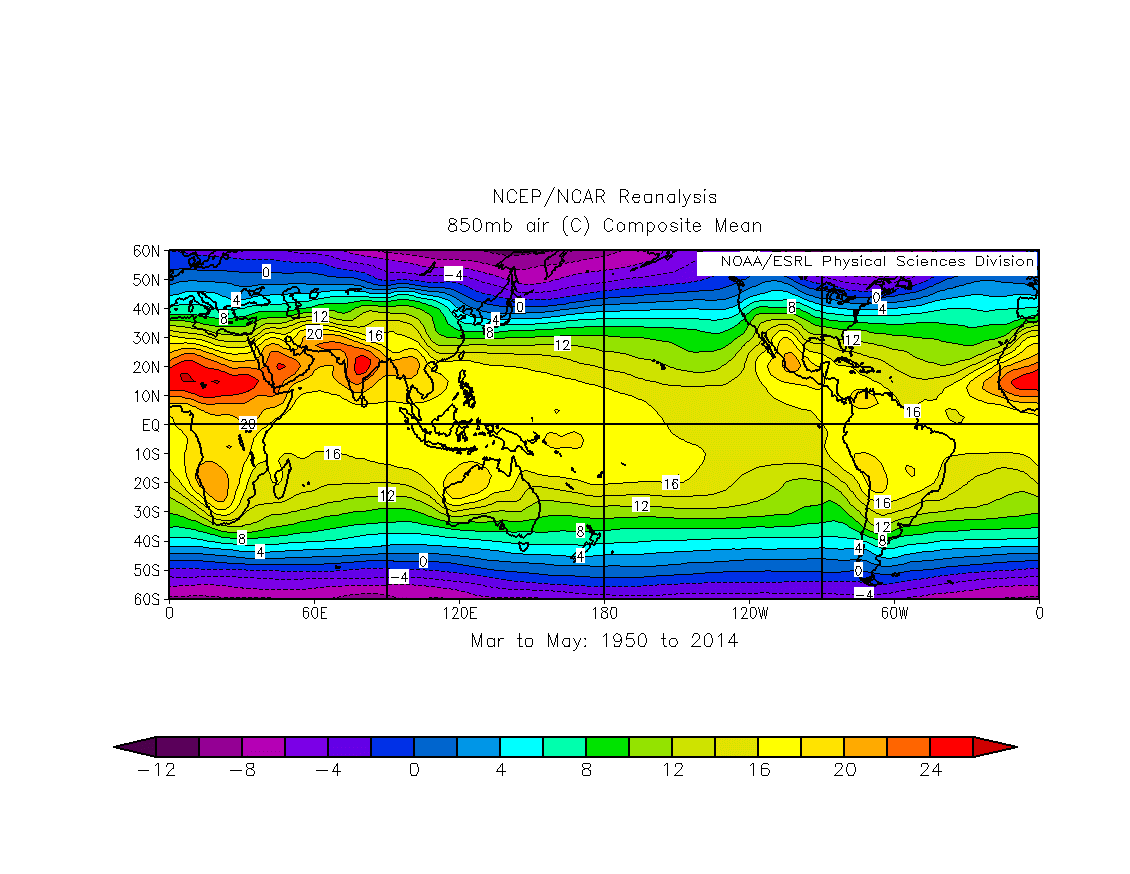
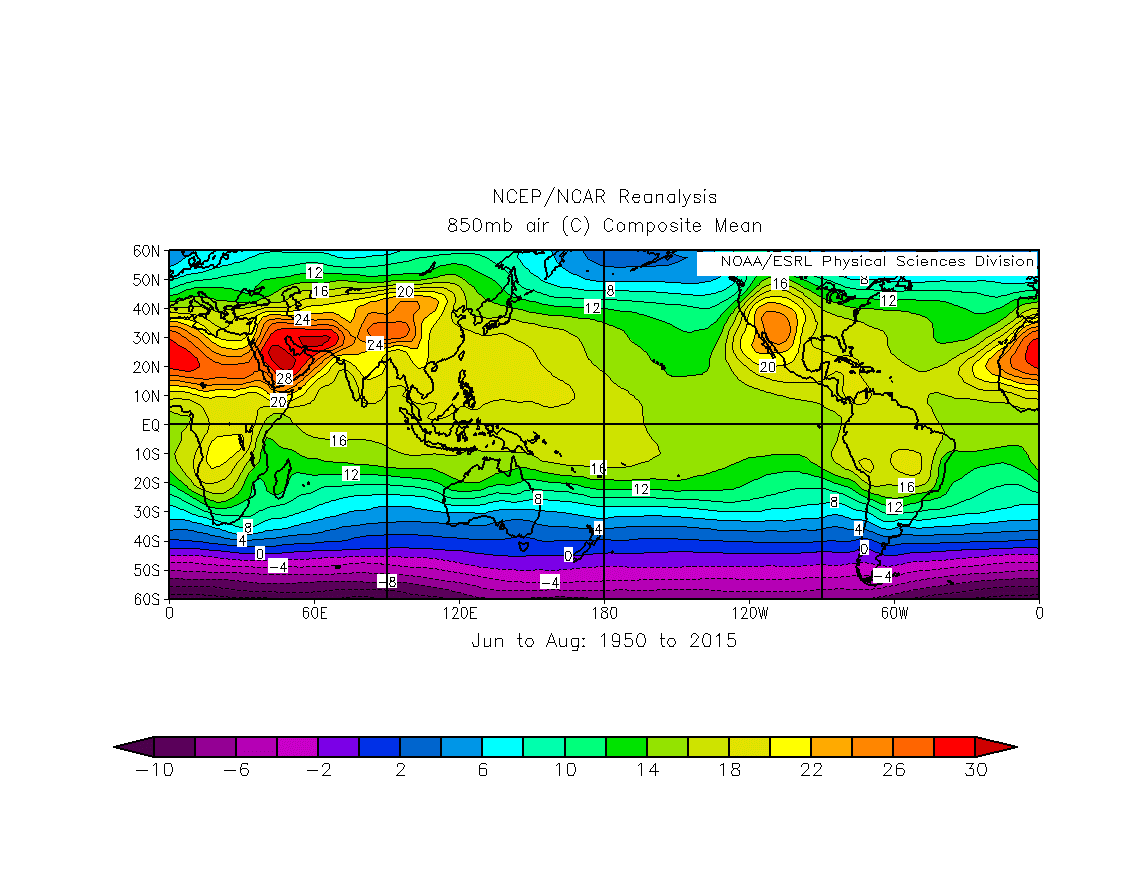
Southern Hemisphere Mean Flow Patterns (1950-2015, except SON through 2014)
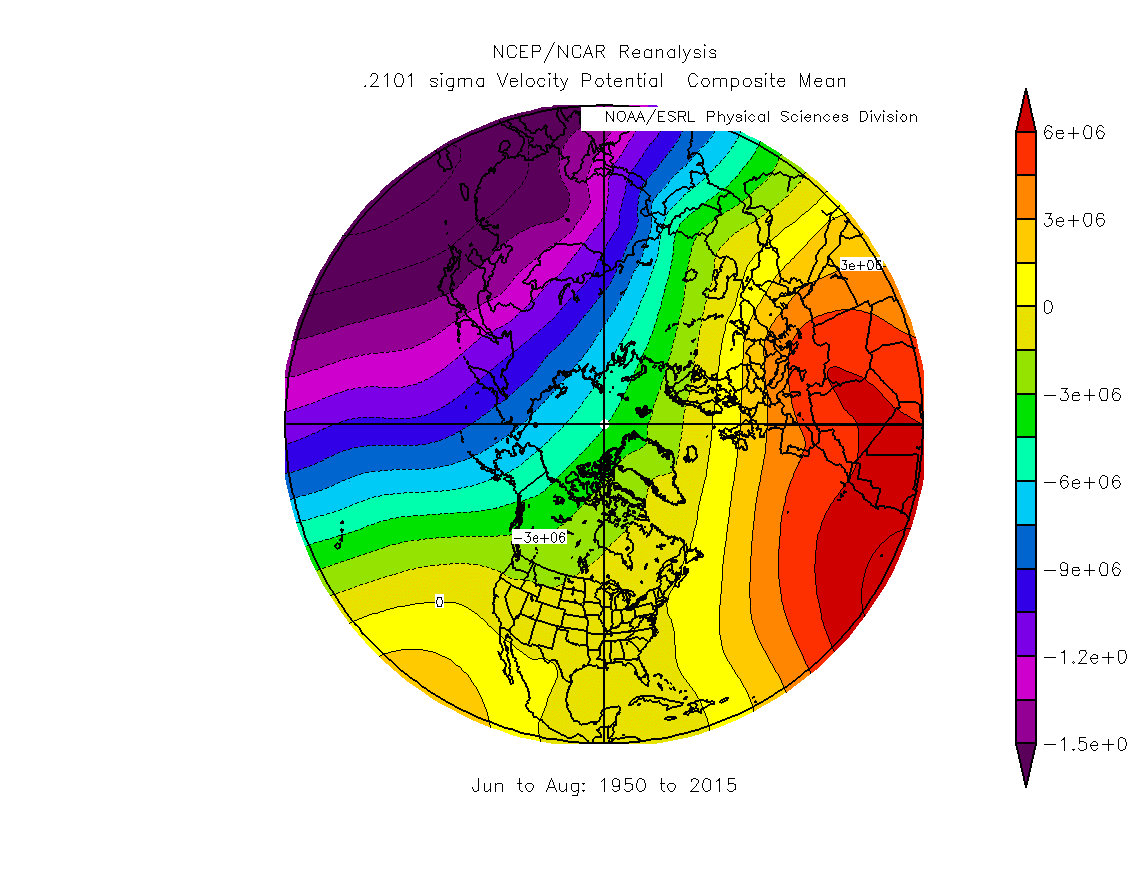
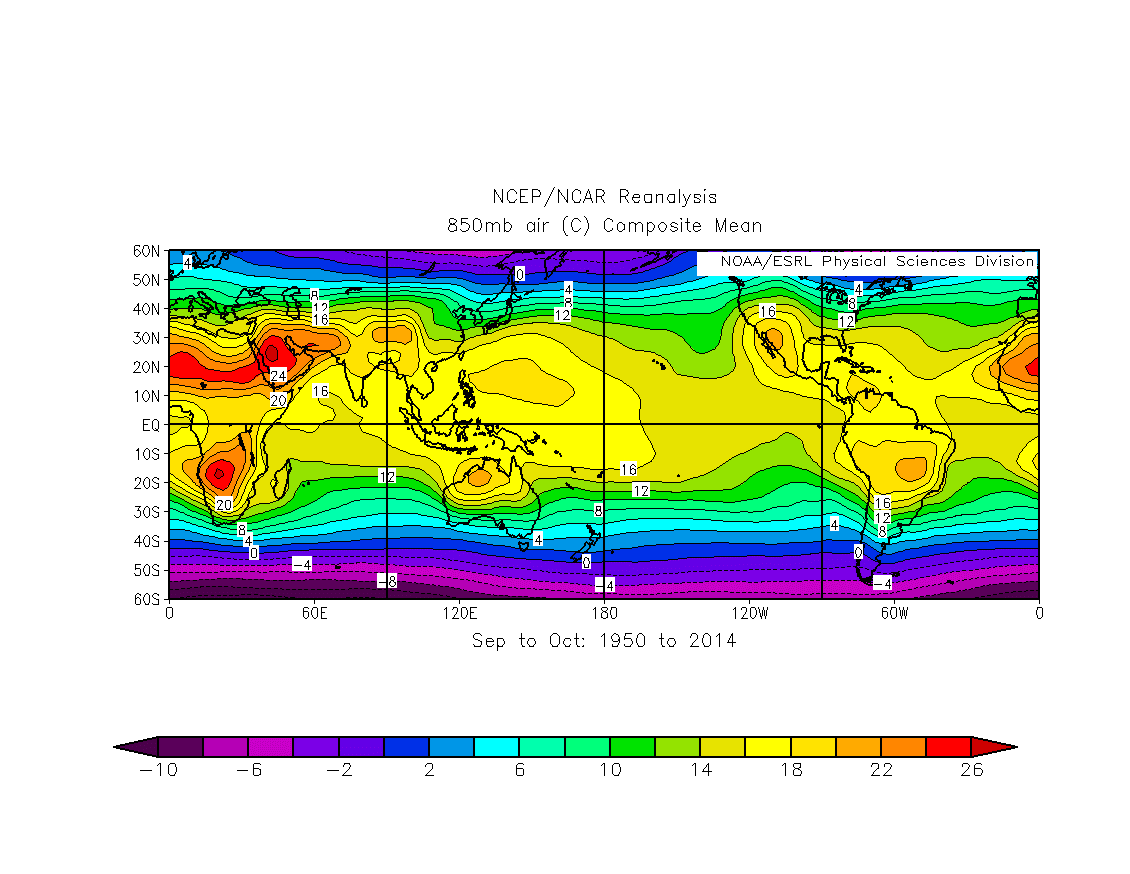
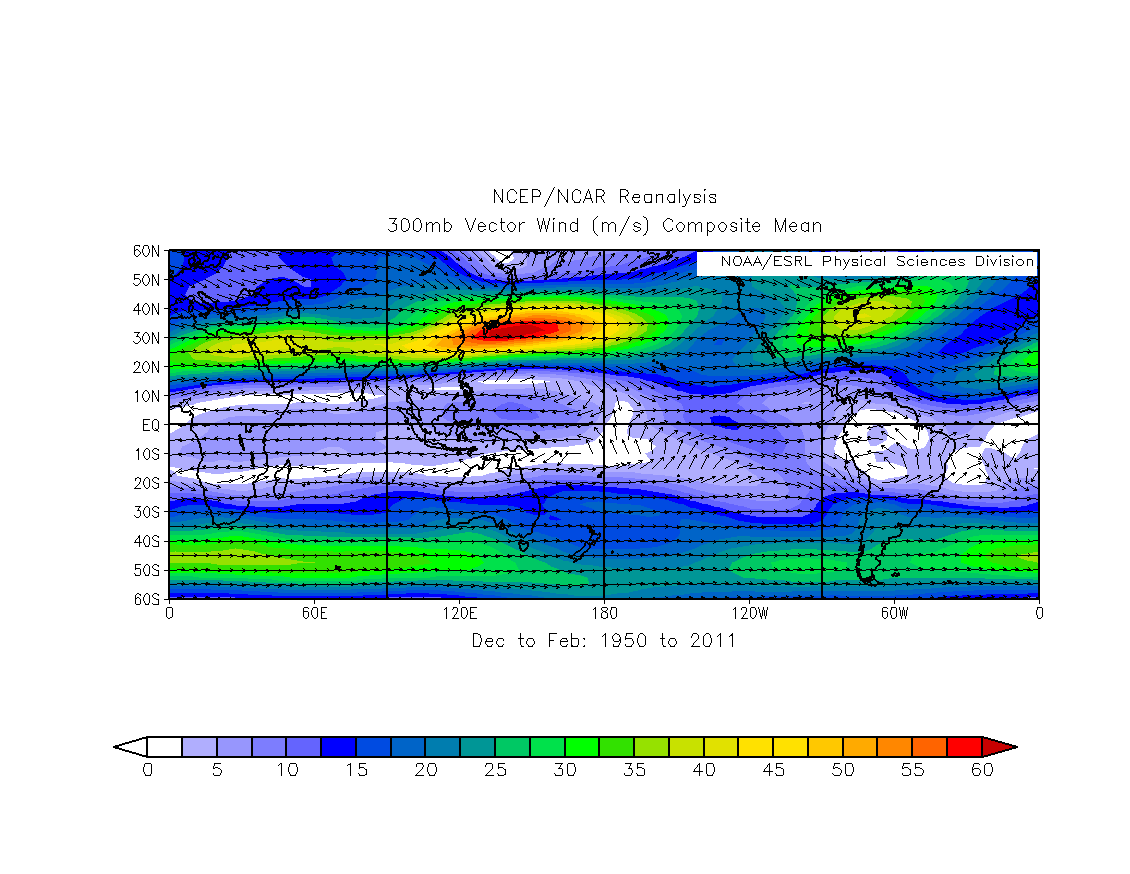
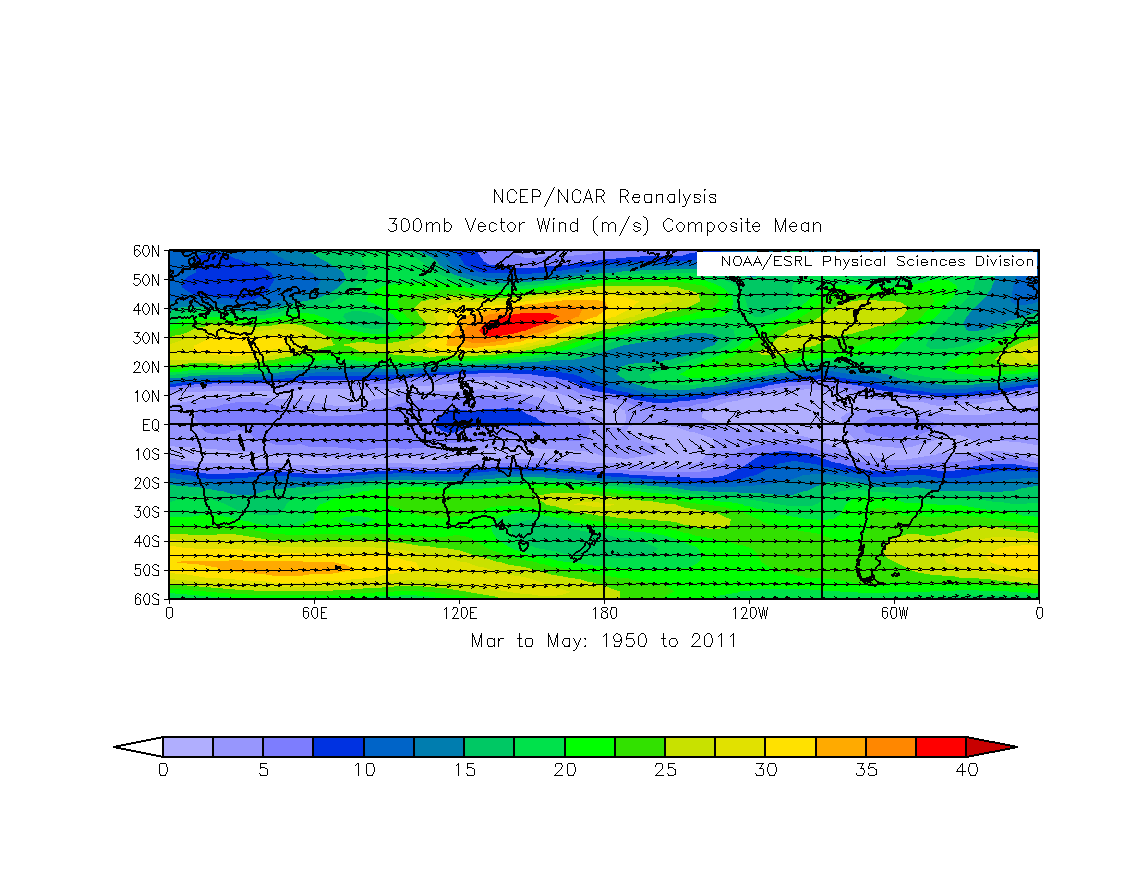
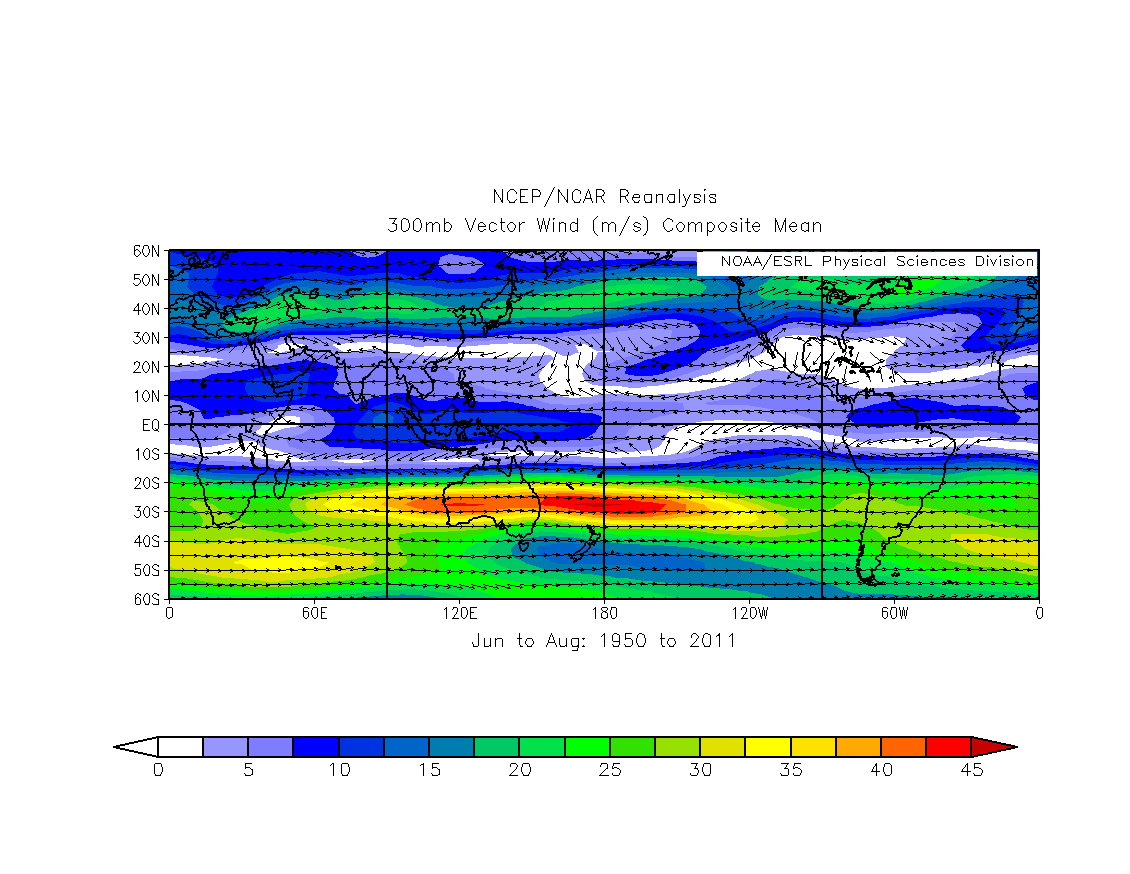
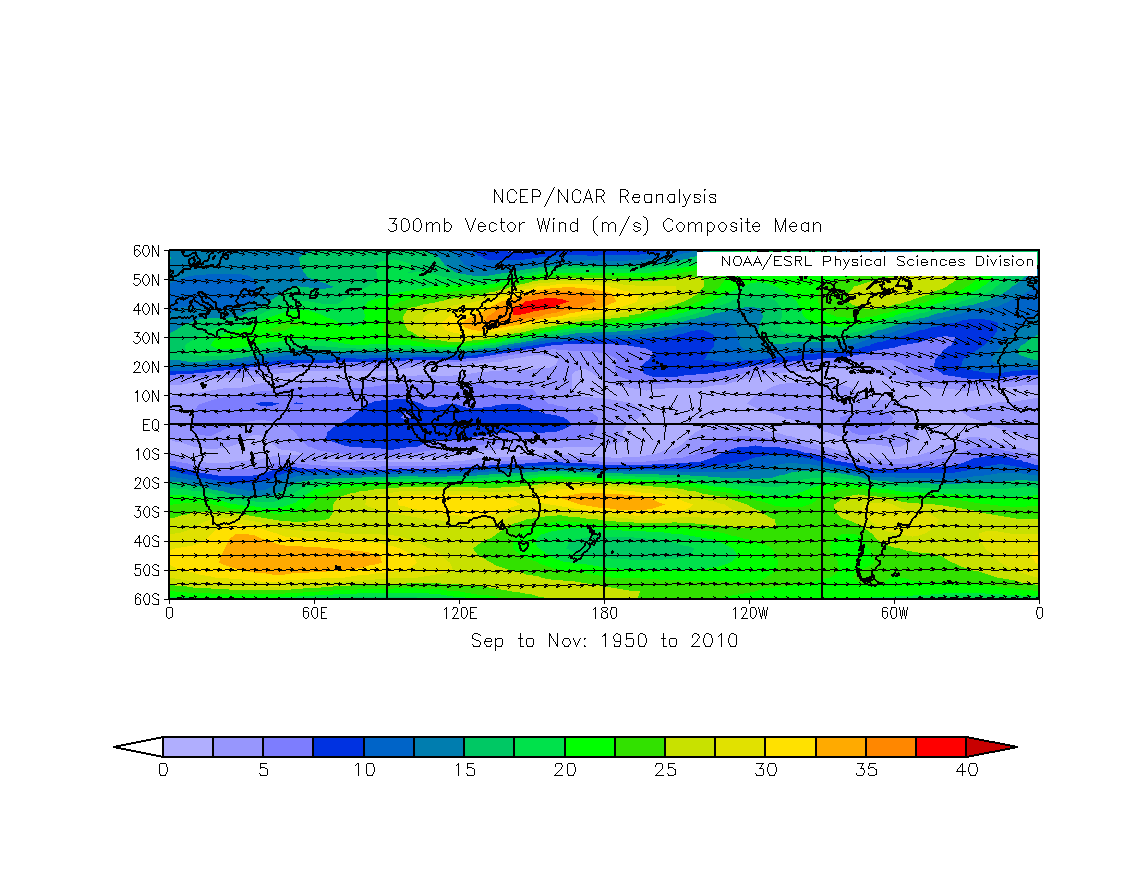
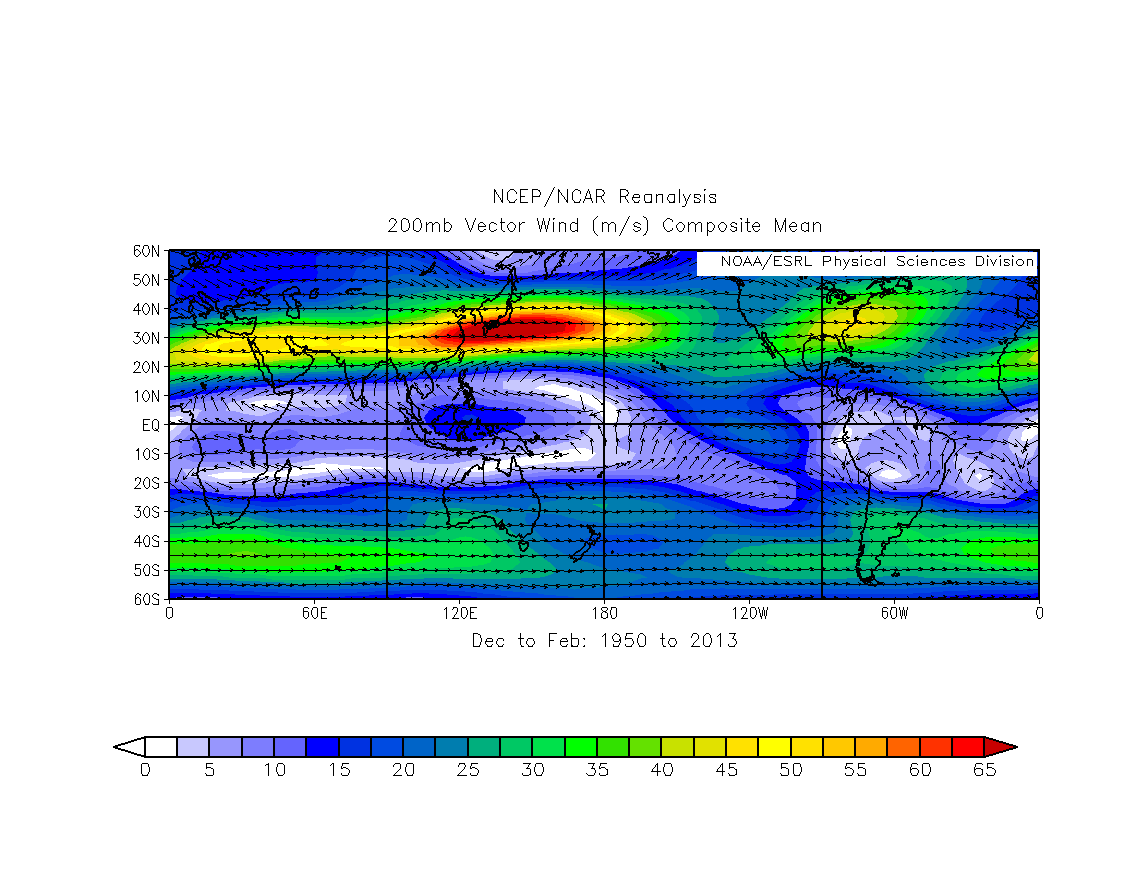
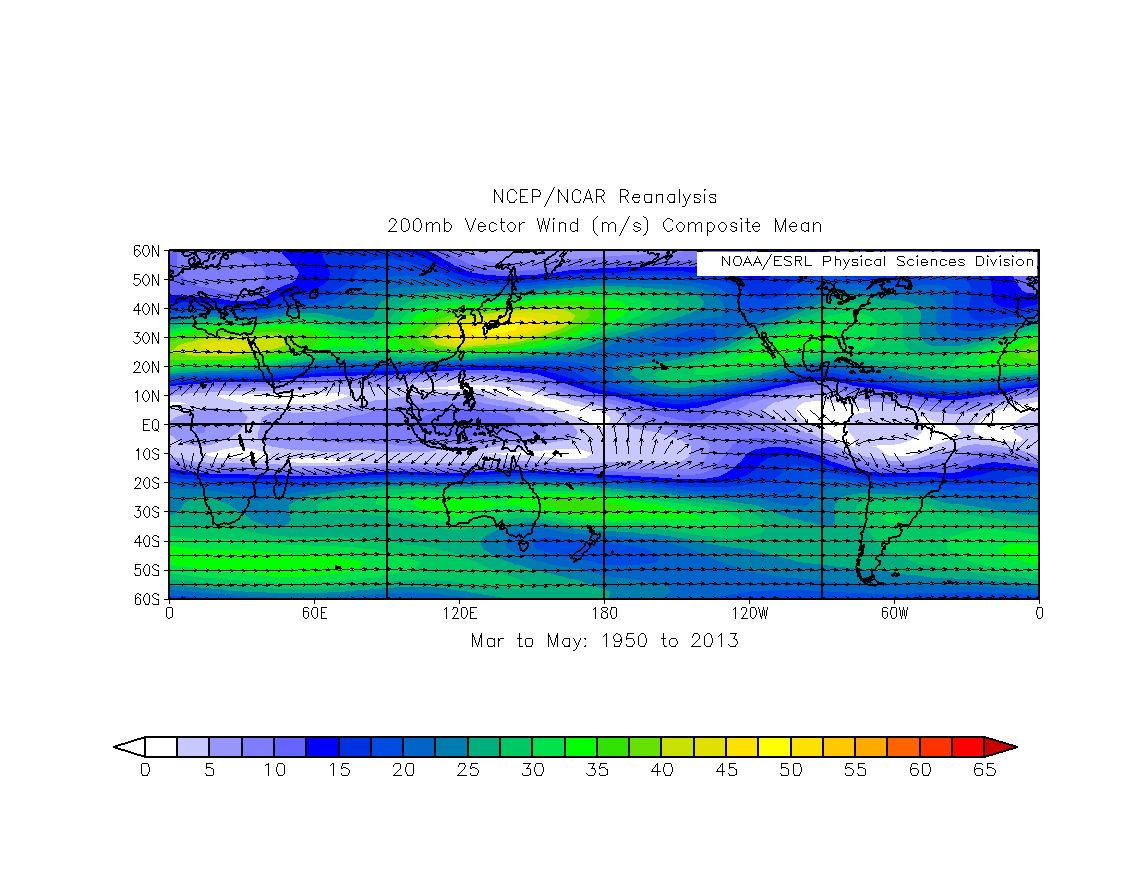
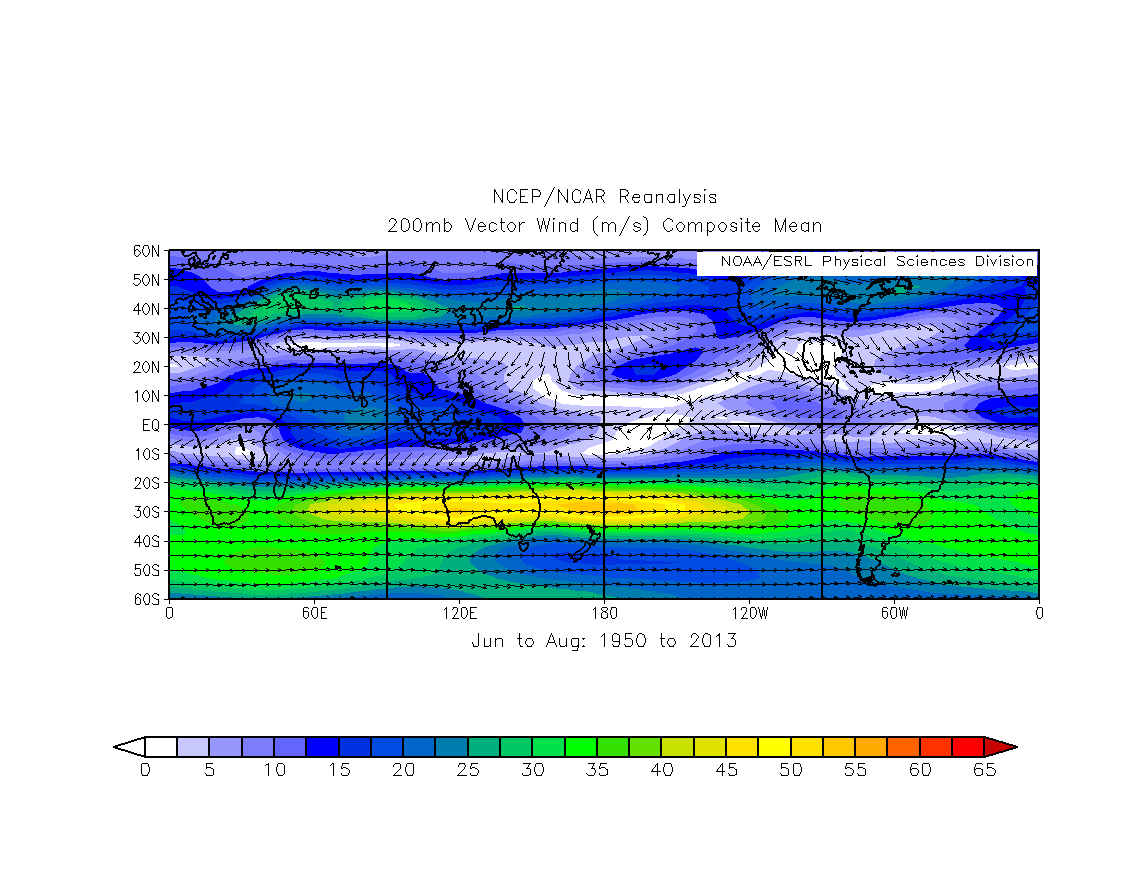
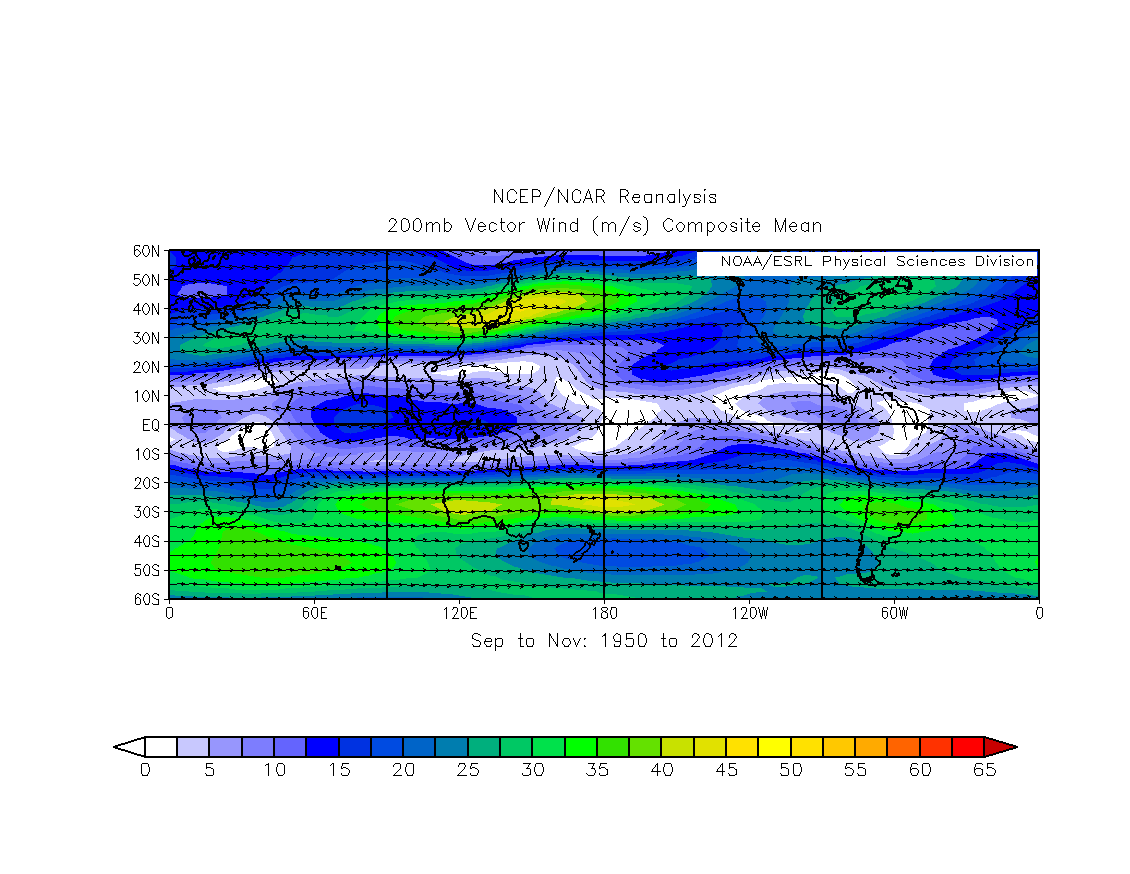
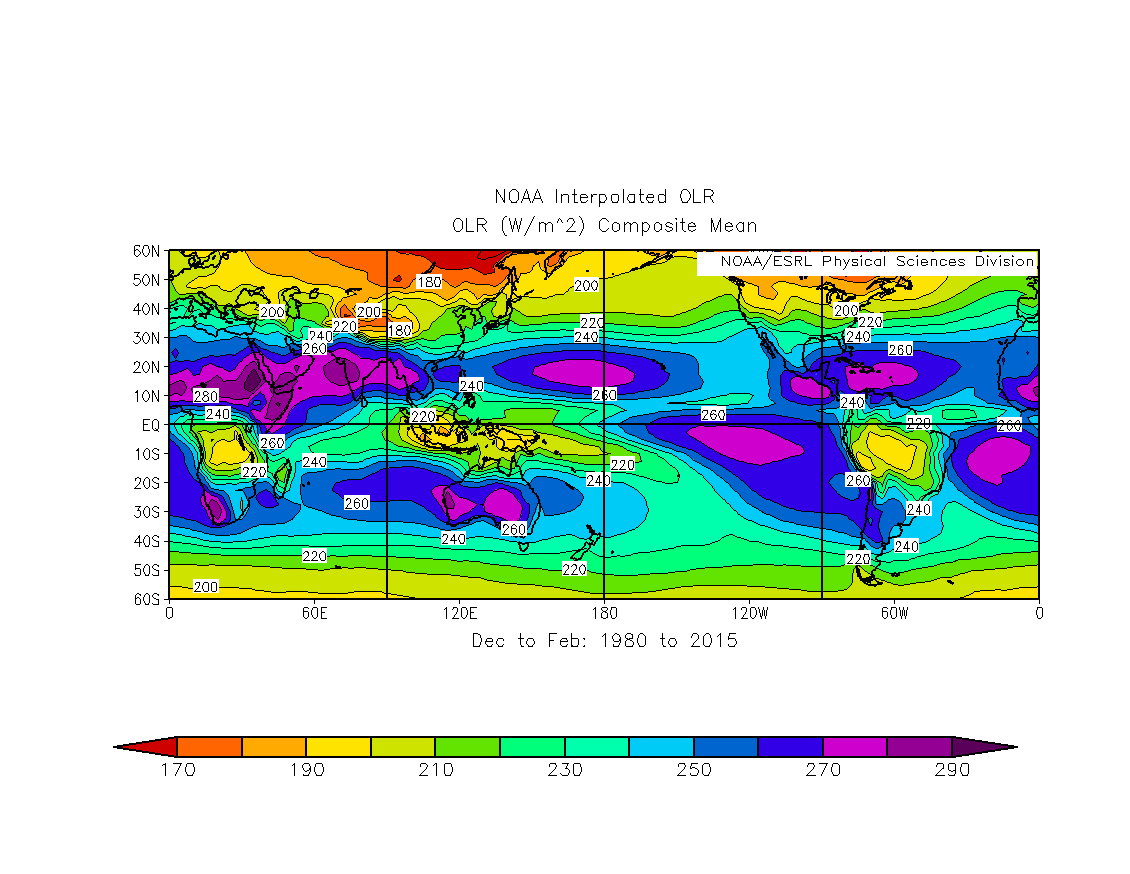
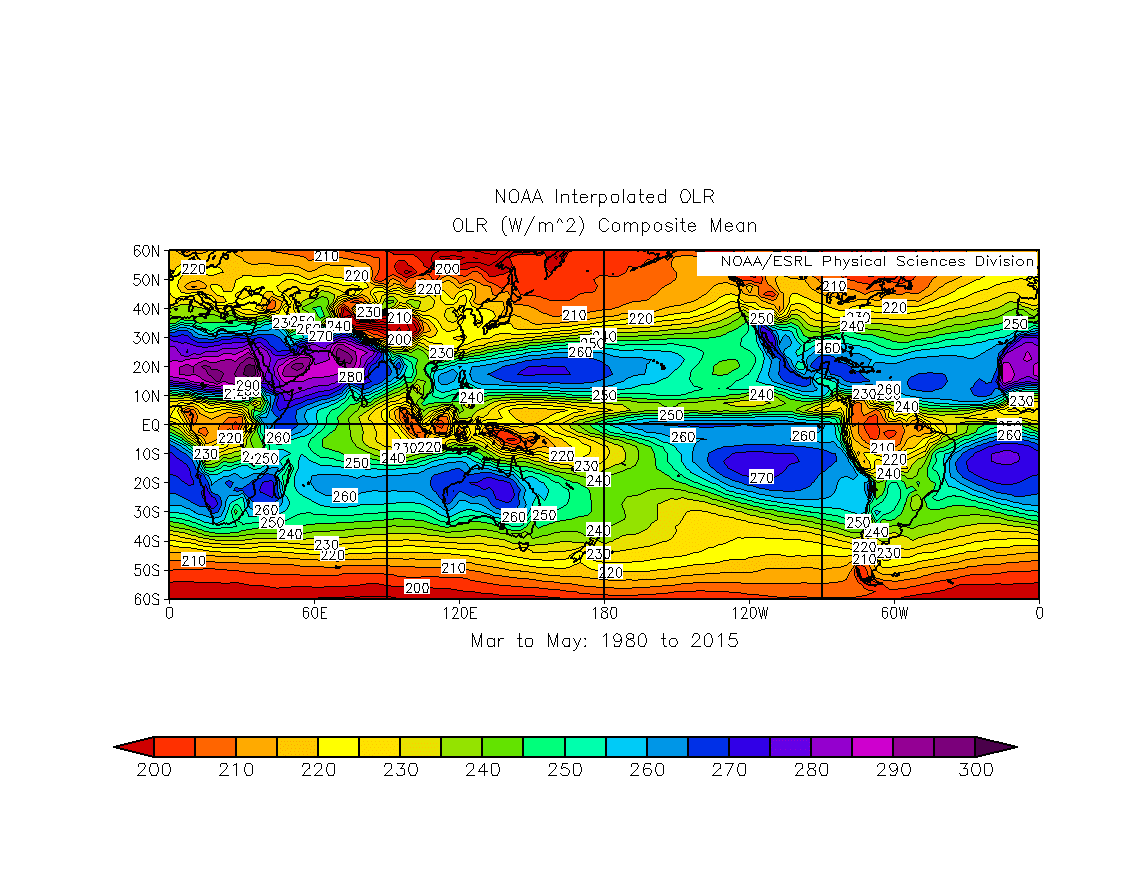
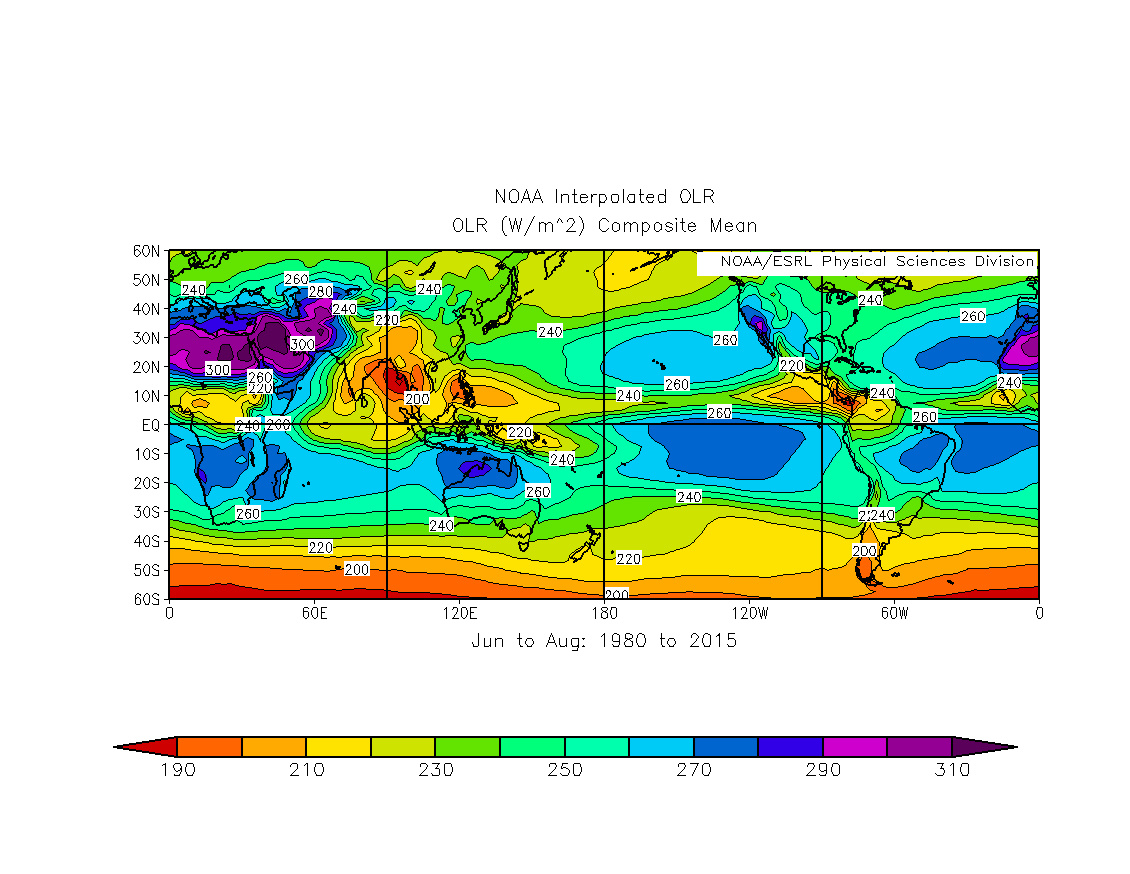
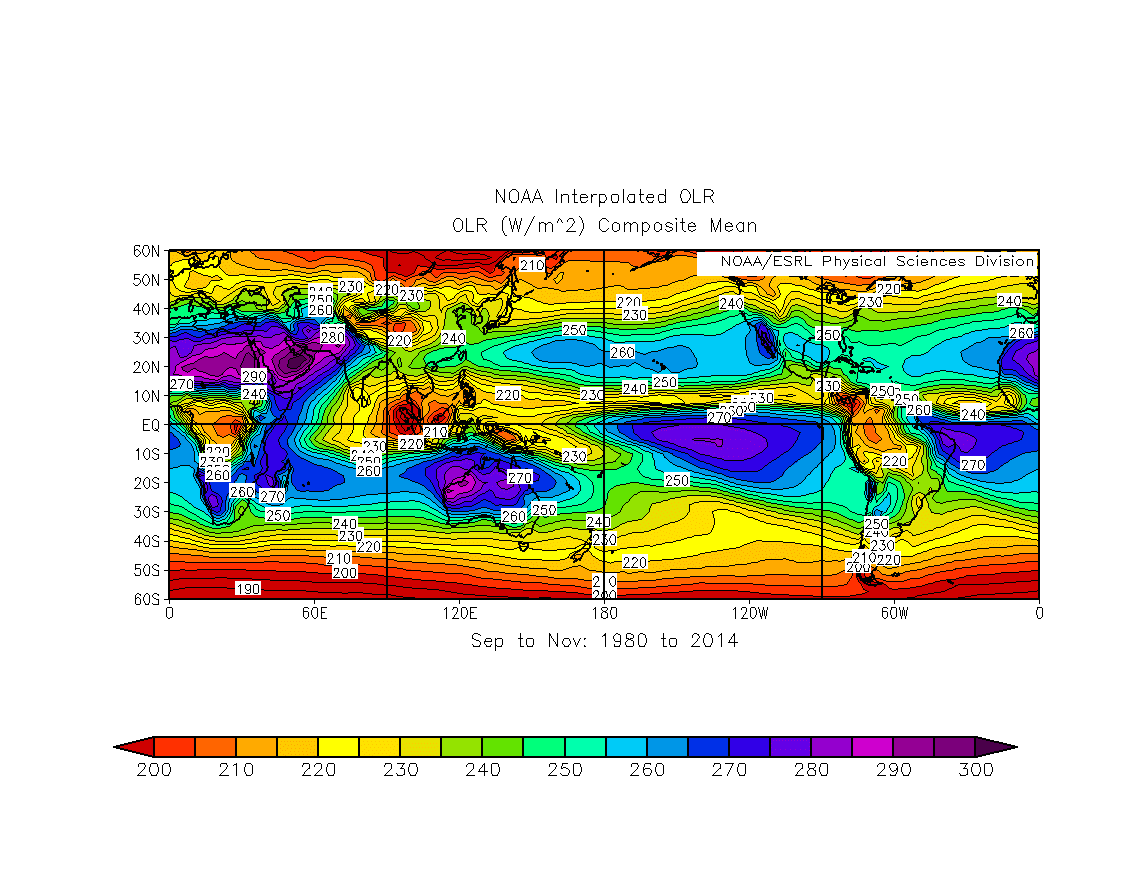
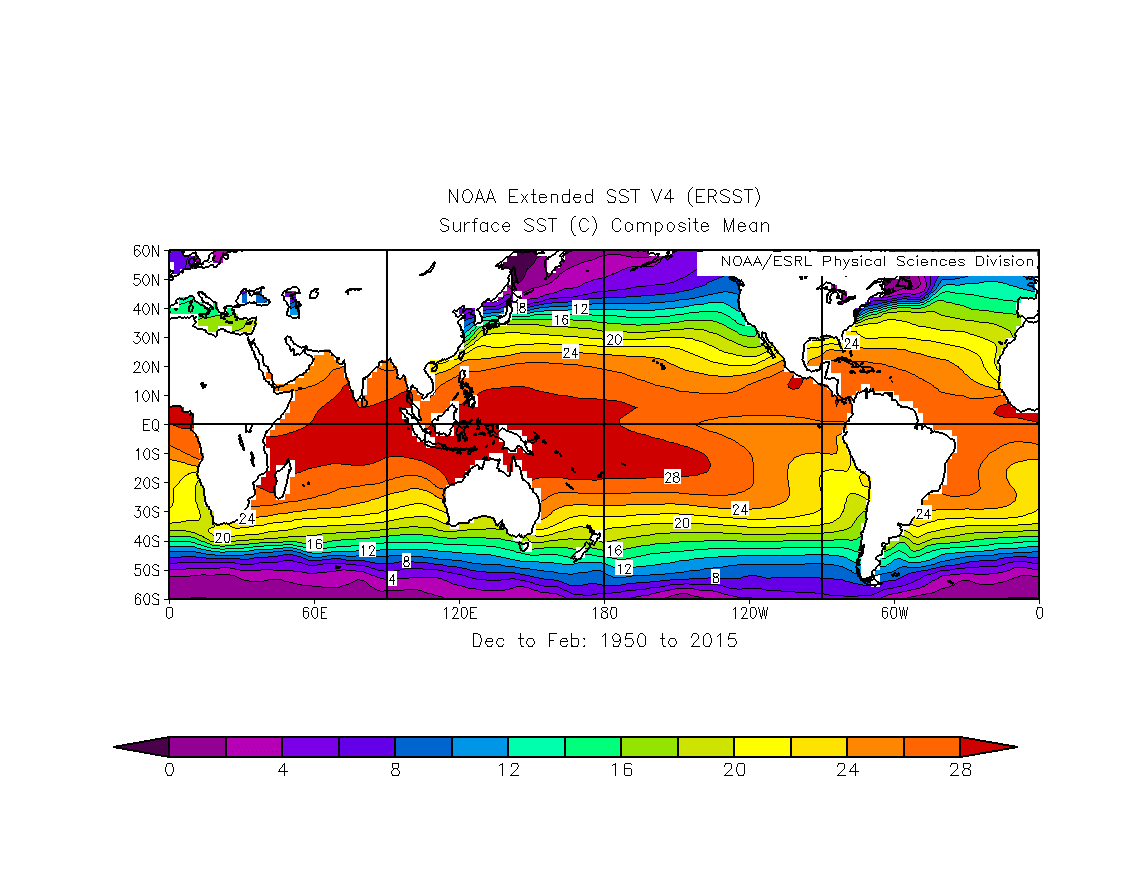
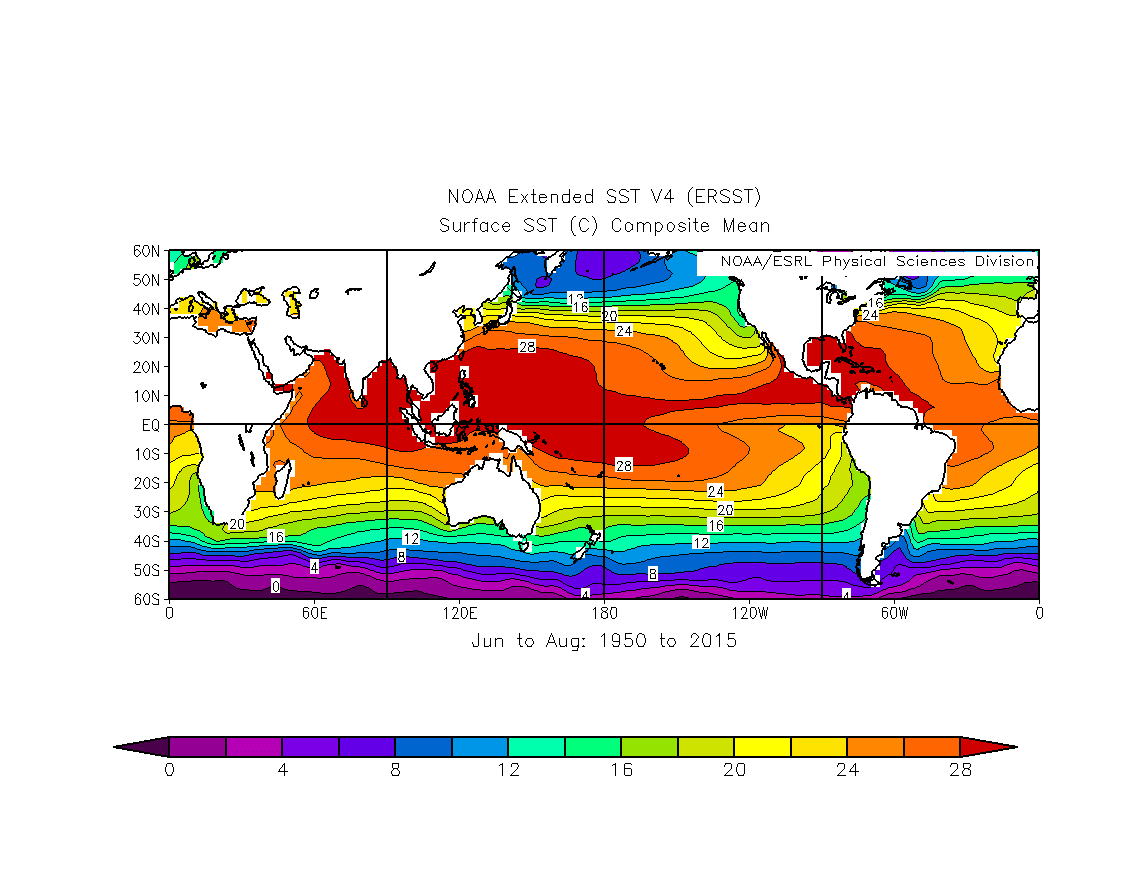
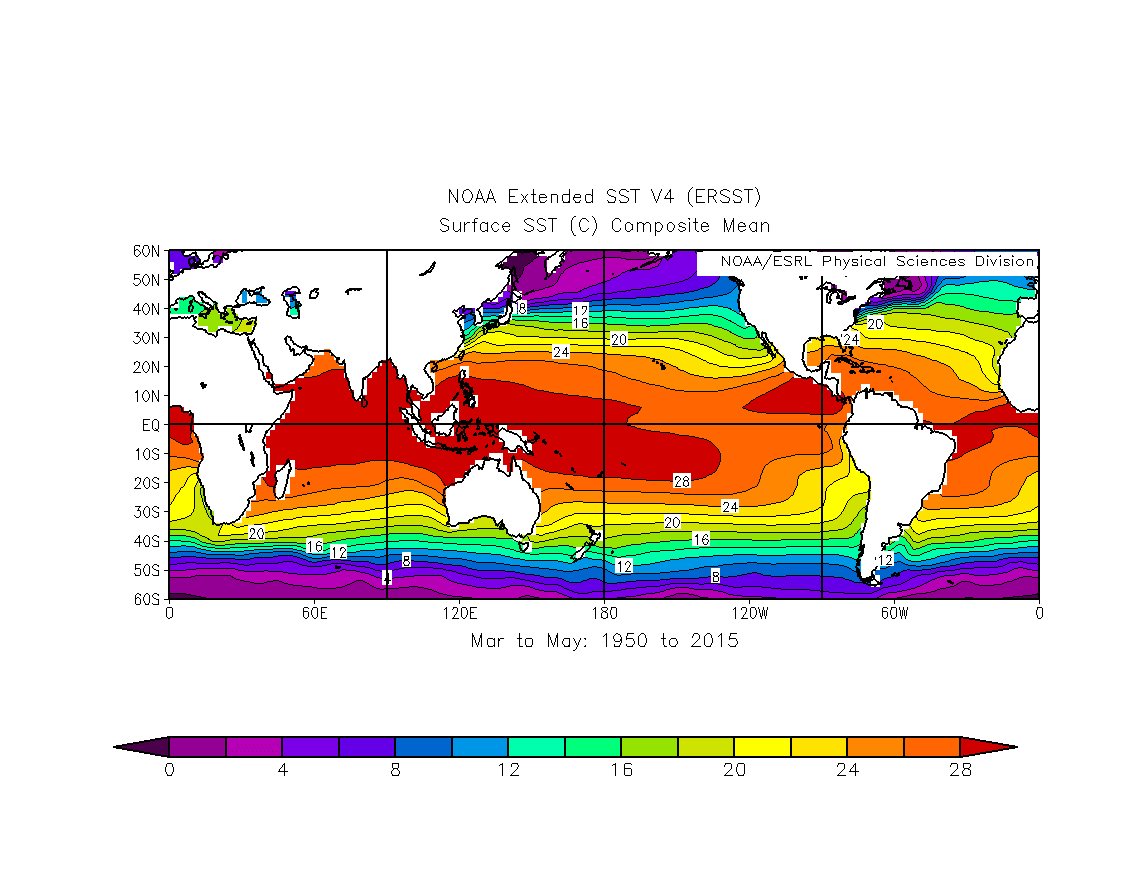
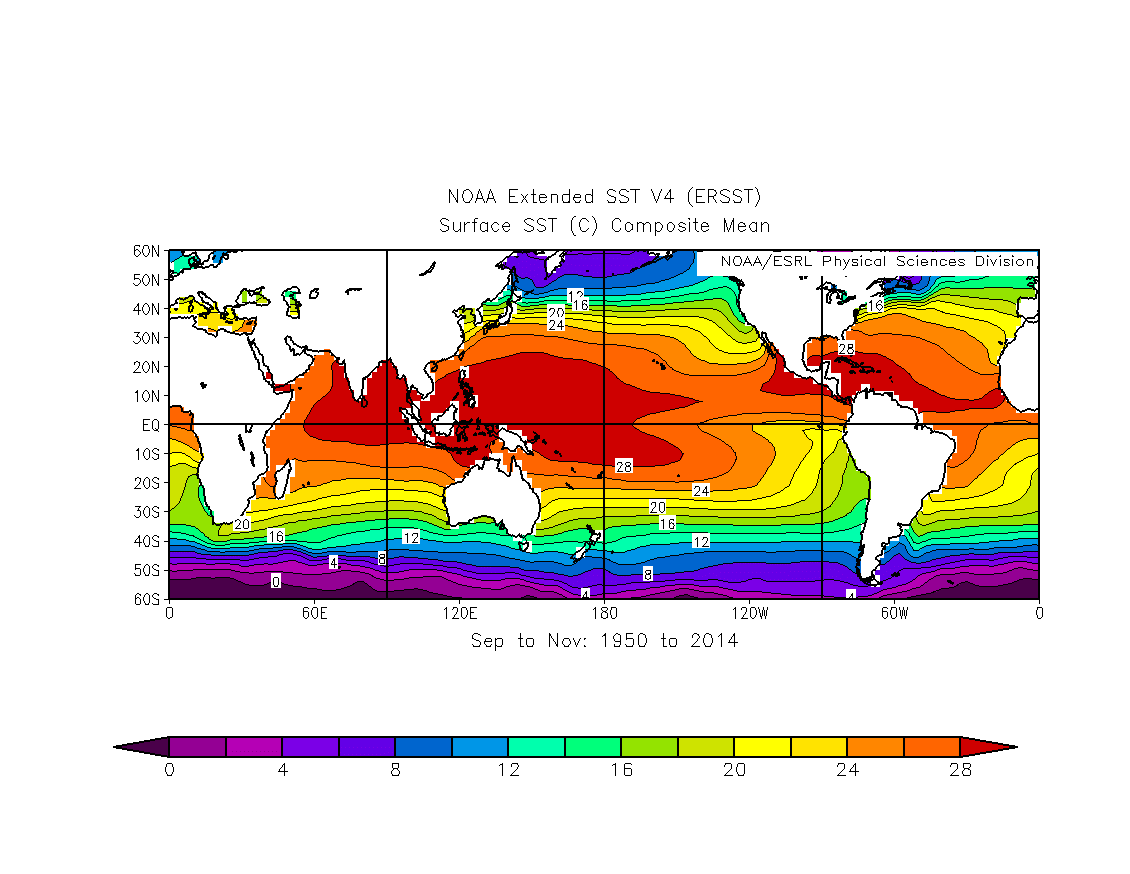
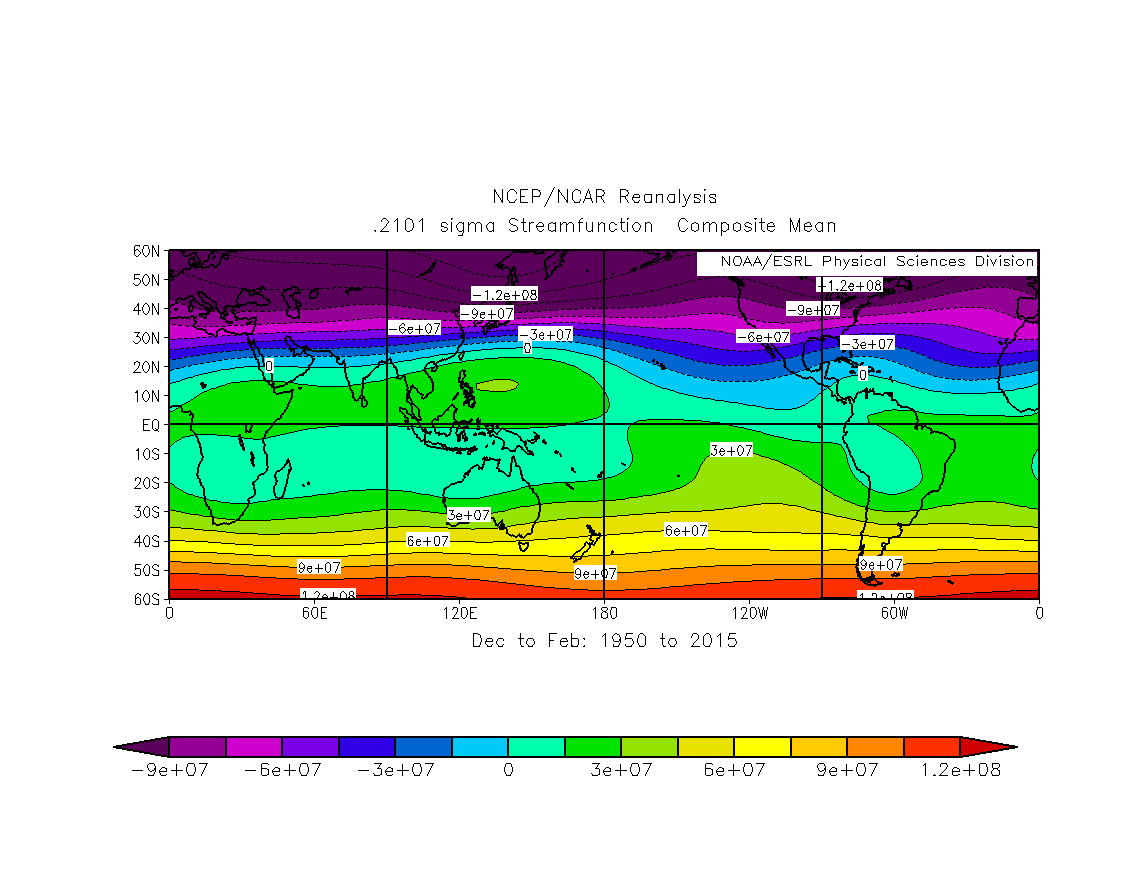
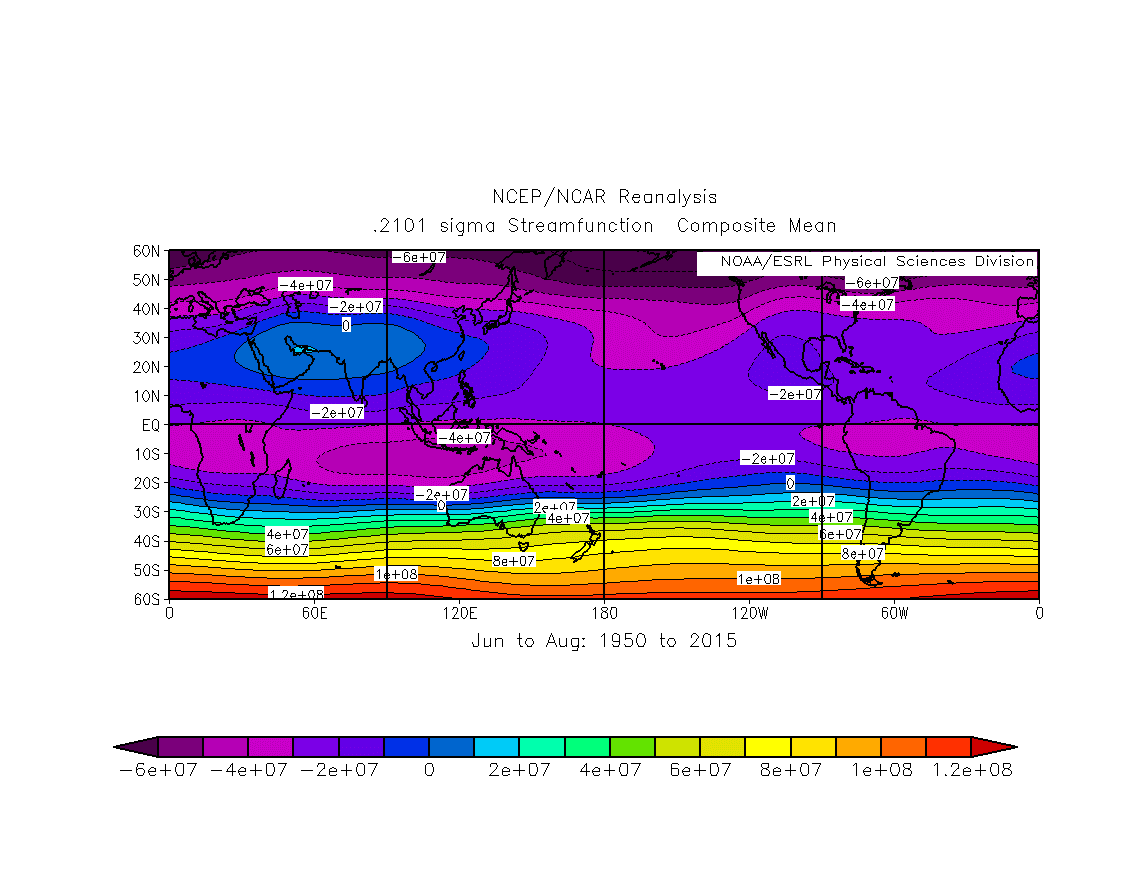
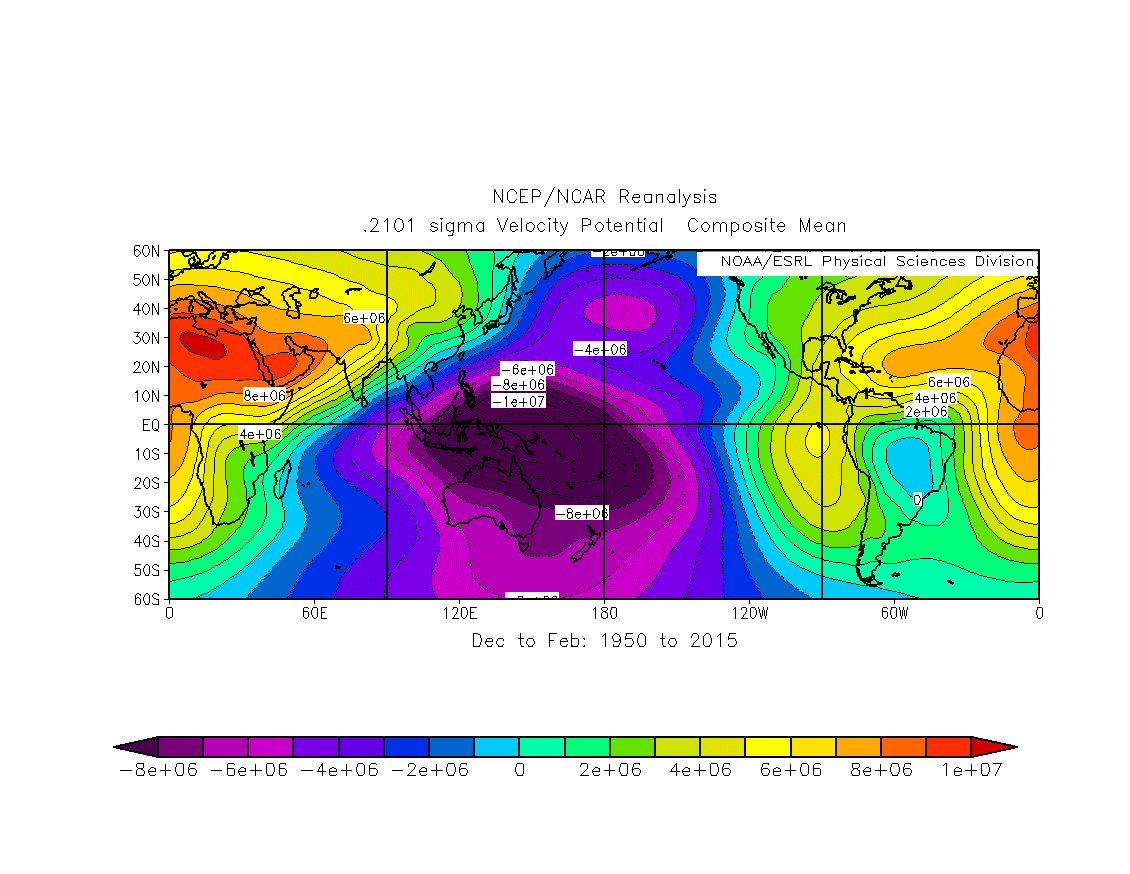
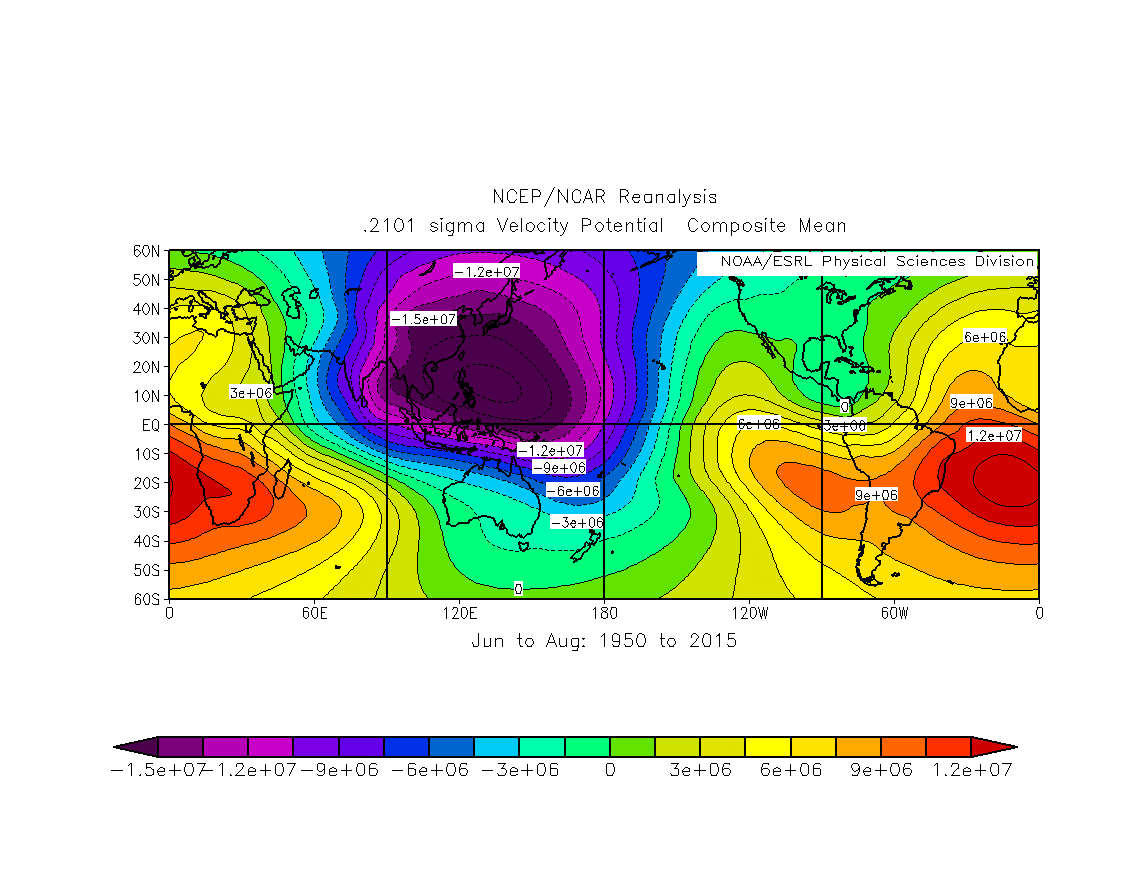
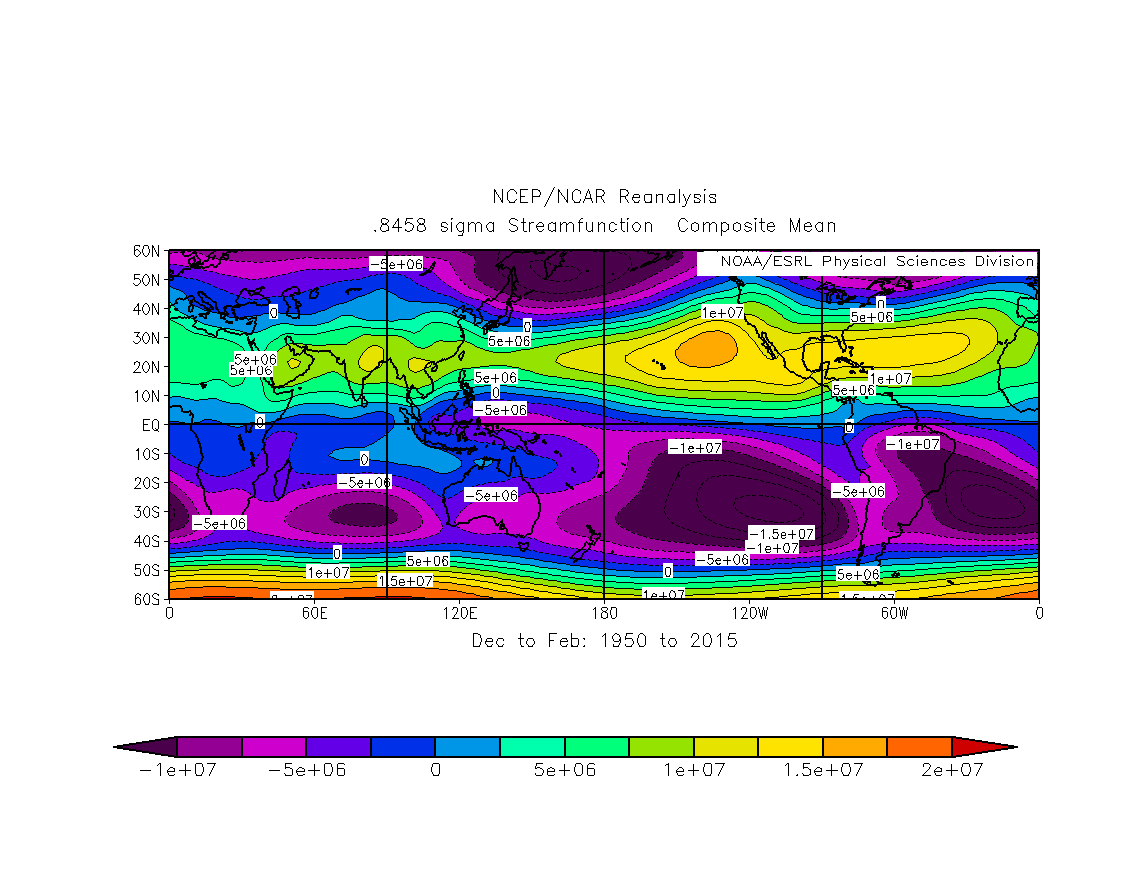
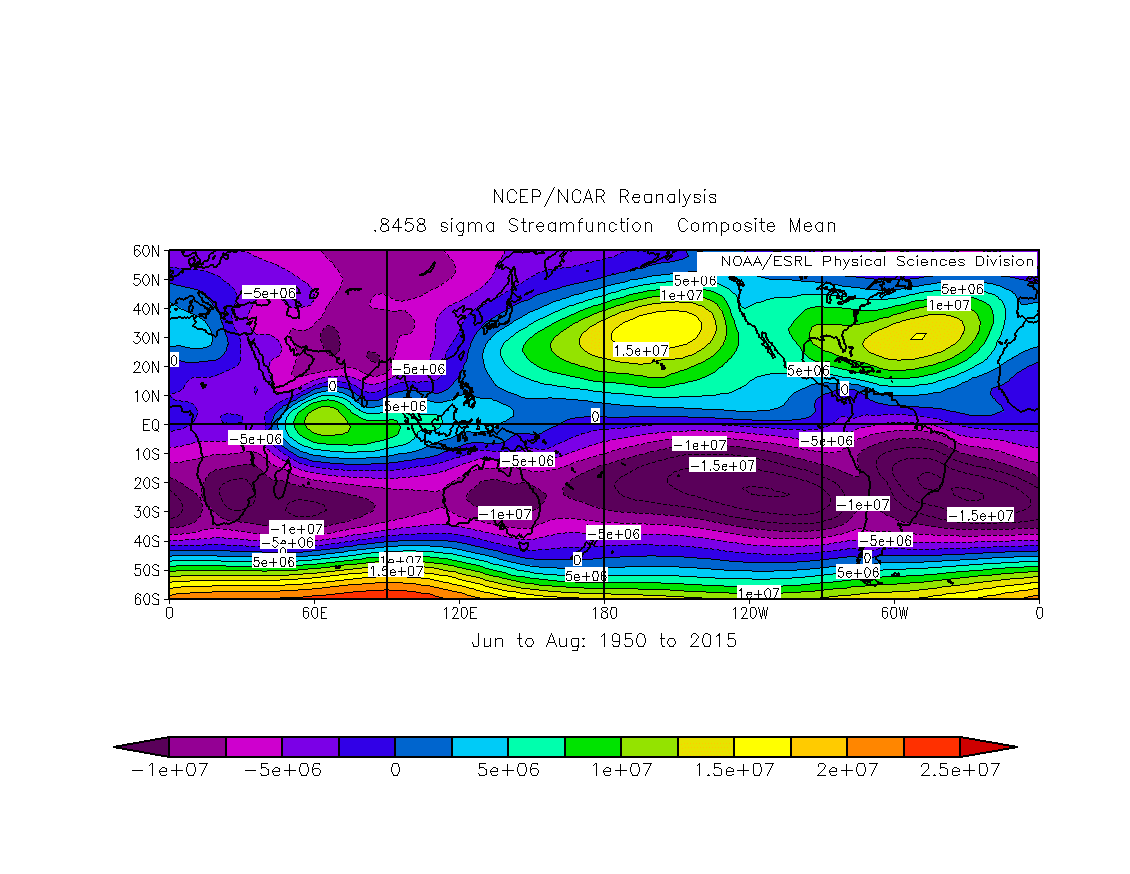
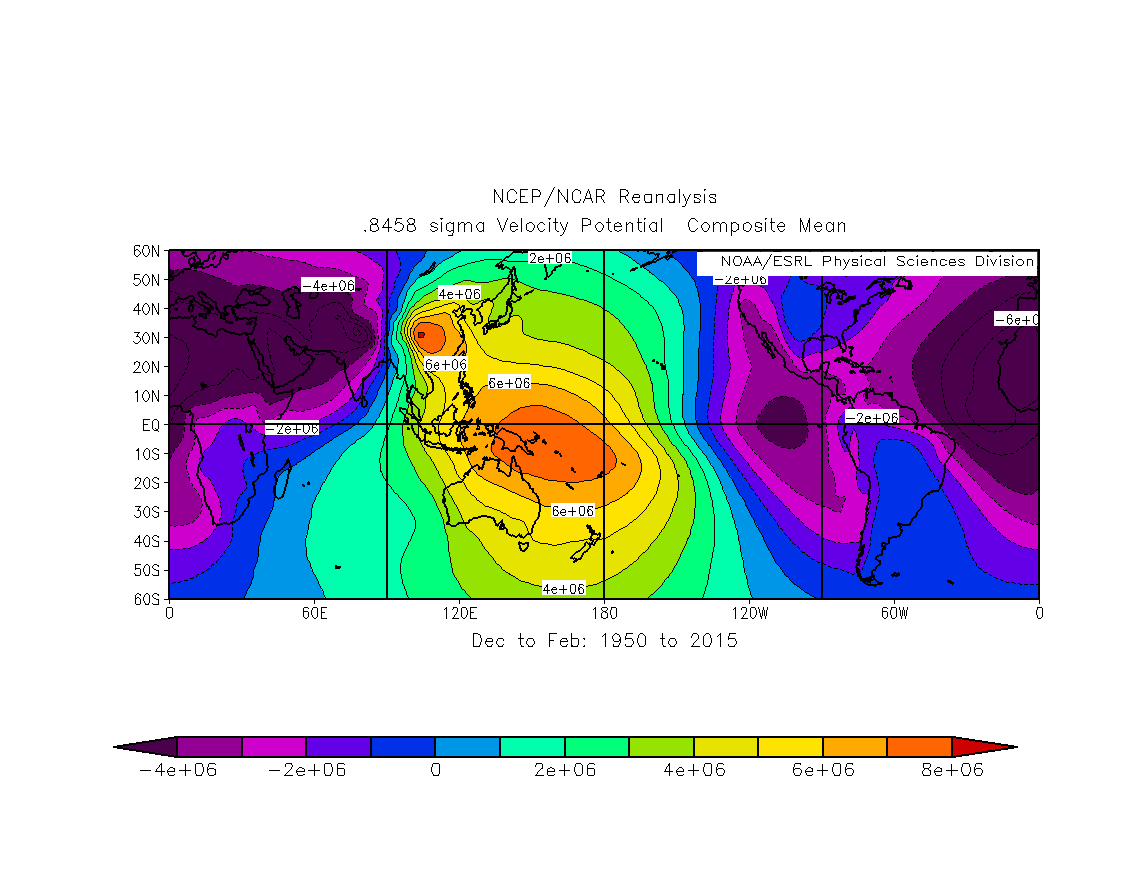
Tropics Mean Flow Patterns (1950-2015, except SON through 2014)
Global Climatology of 850 and 200 hPa Closed Anticyclones
The following global climatology of closed anticyclones is taken from Galarneau et al. (2008). Closed anticyclones were defined by closed 162 dam and 1236 dam contours at 850 and 200 hPa, respectively. These closed contour values were chosen so as to maximize the likelihood of identifying closed anticyclones in subtropical and lower middle latitudes equatorward of the principal jet streams in both hemispheres.
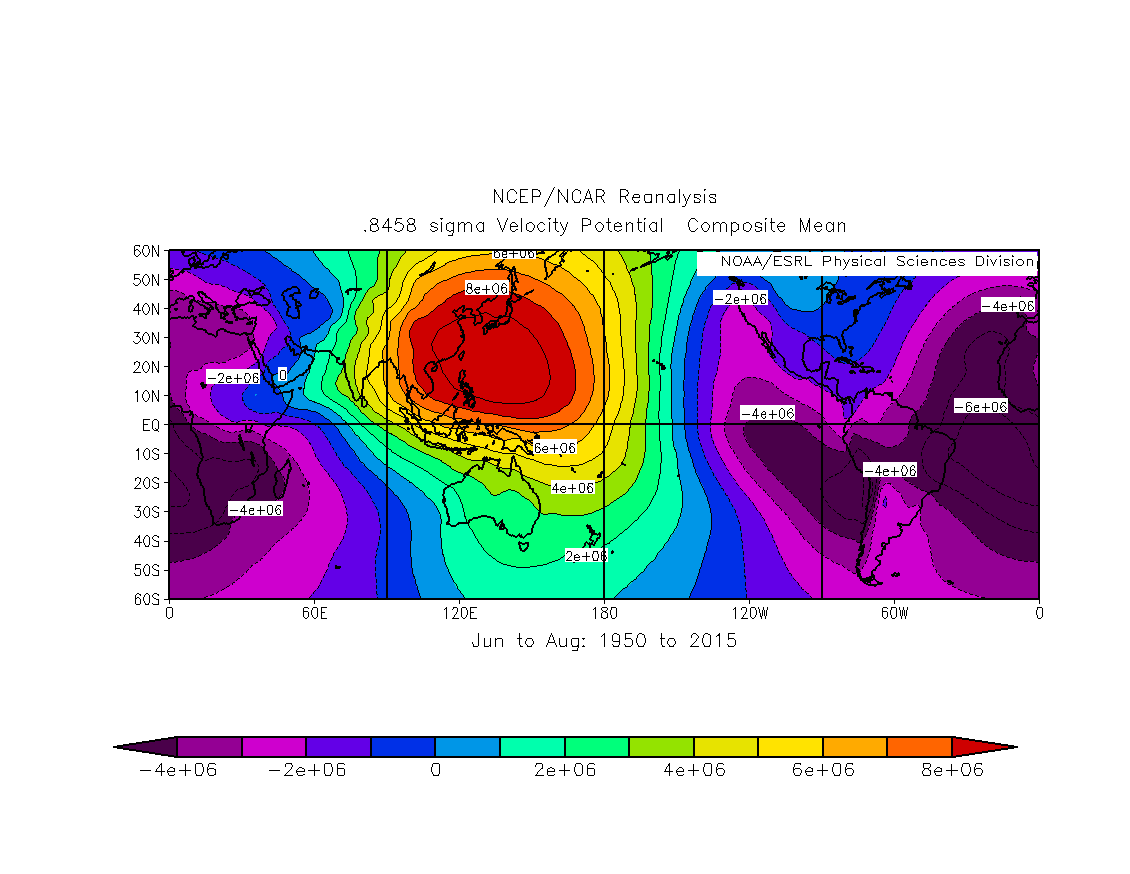
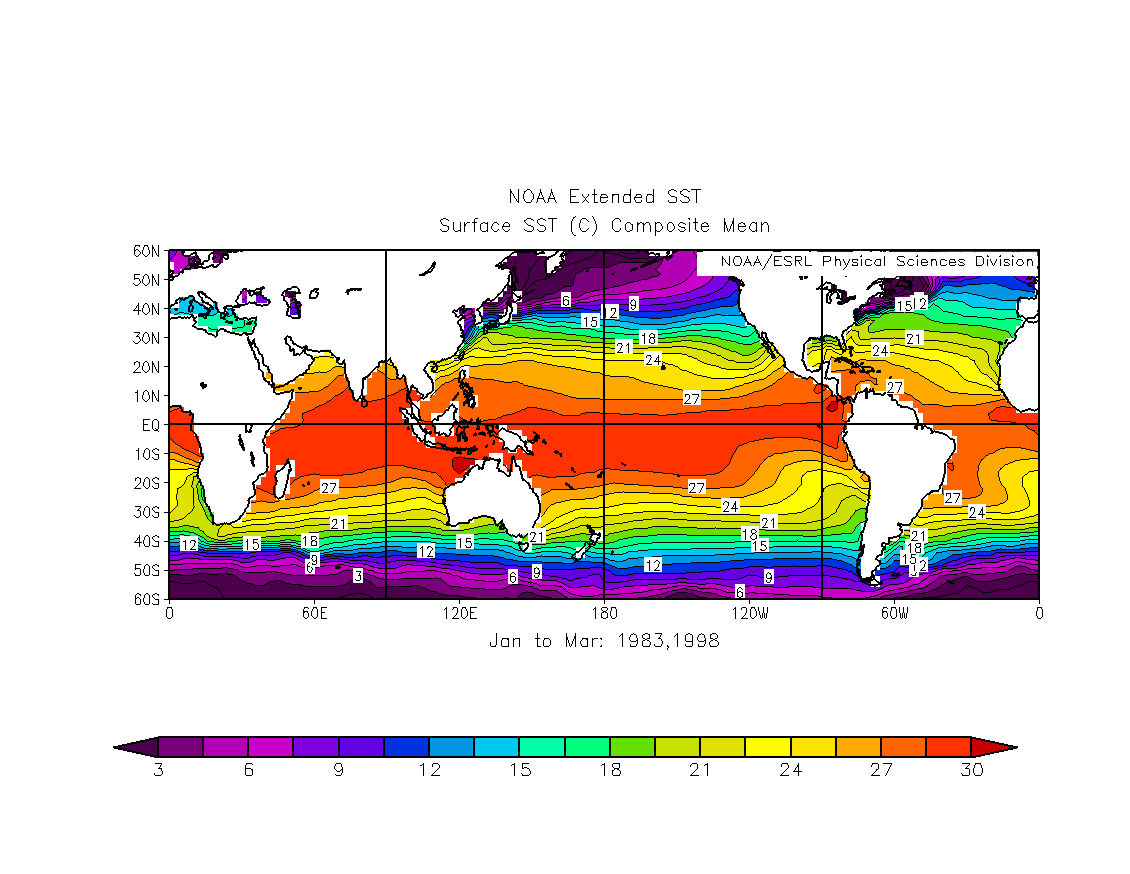
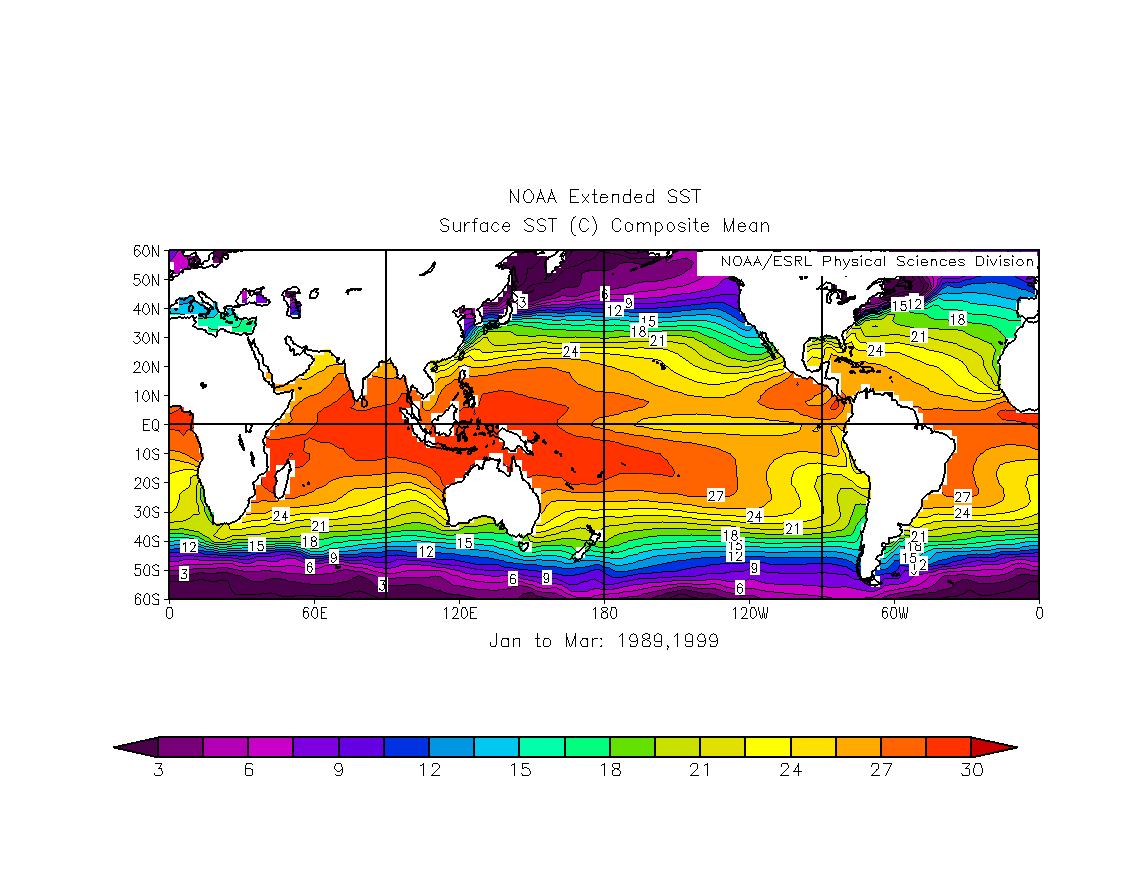
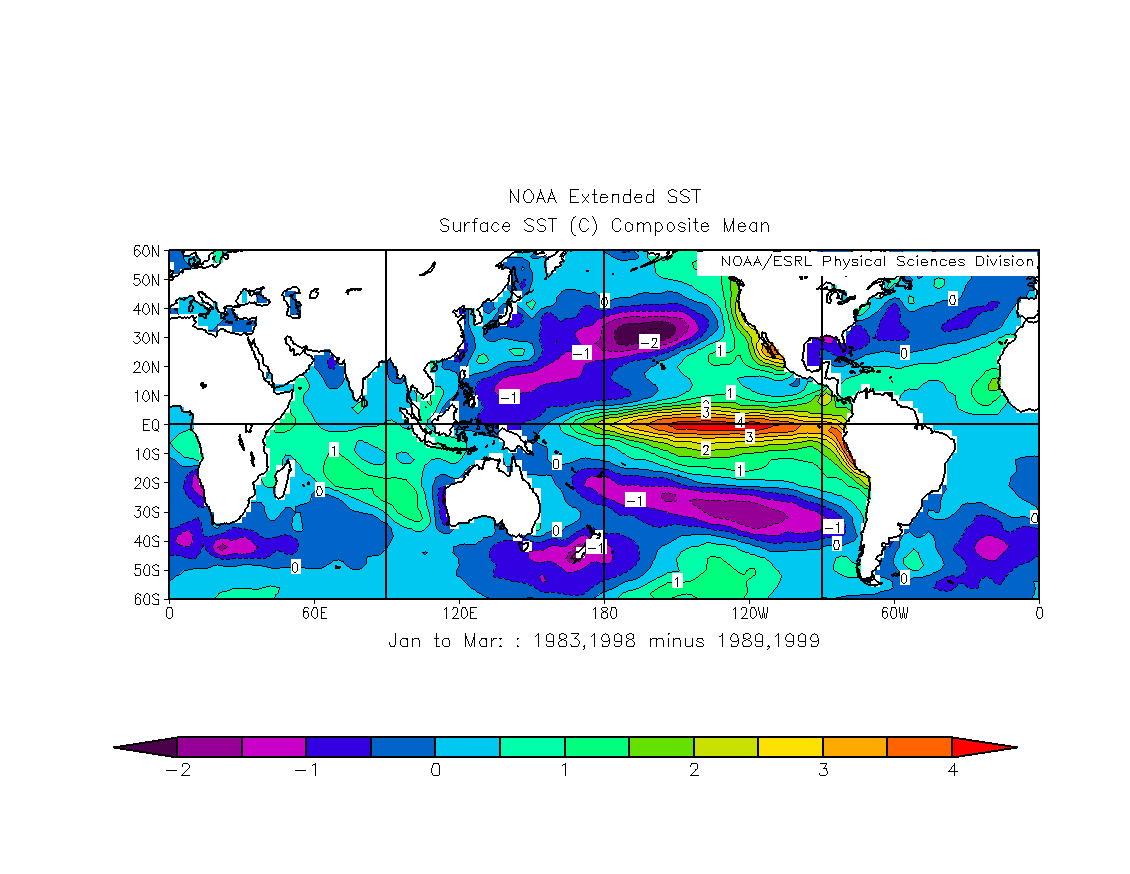
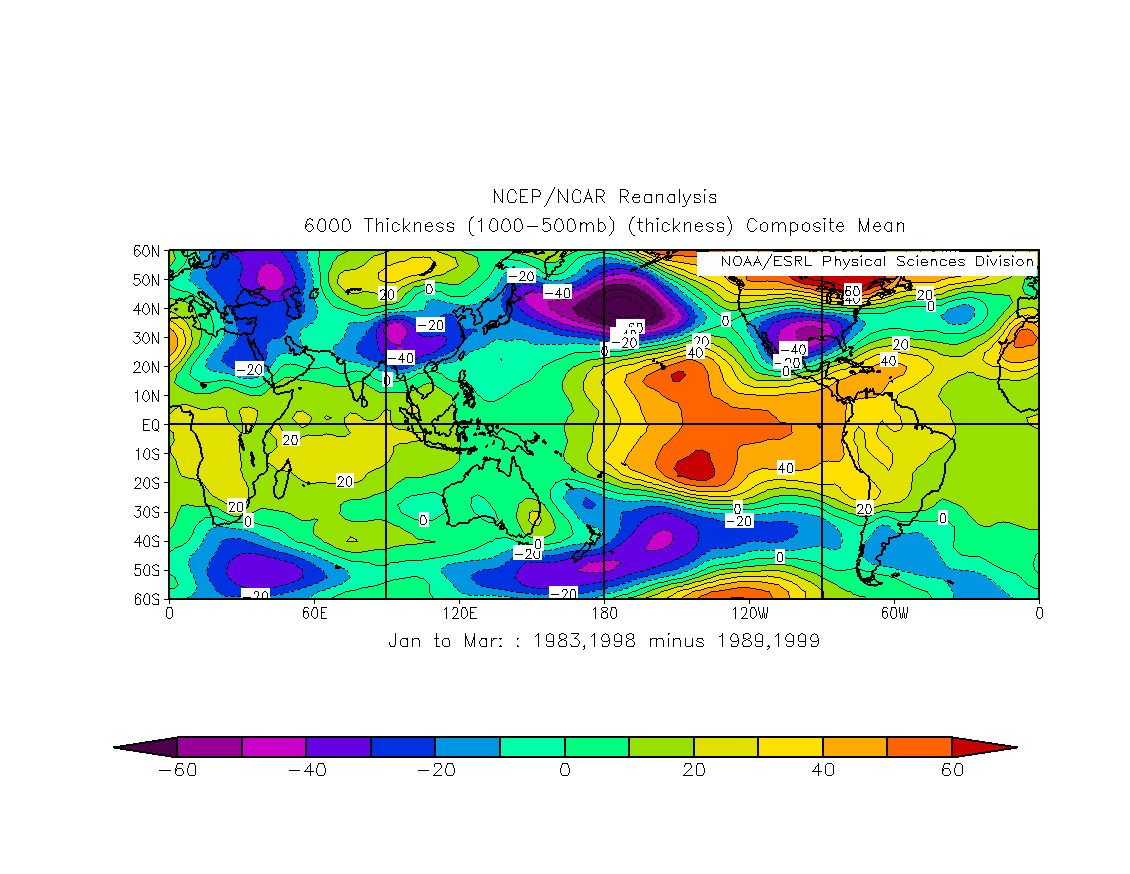
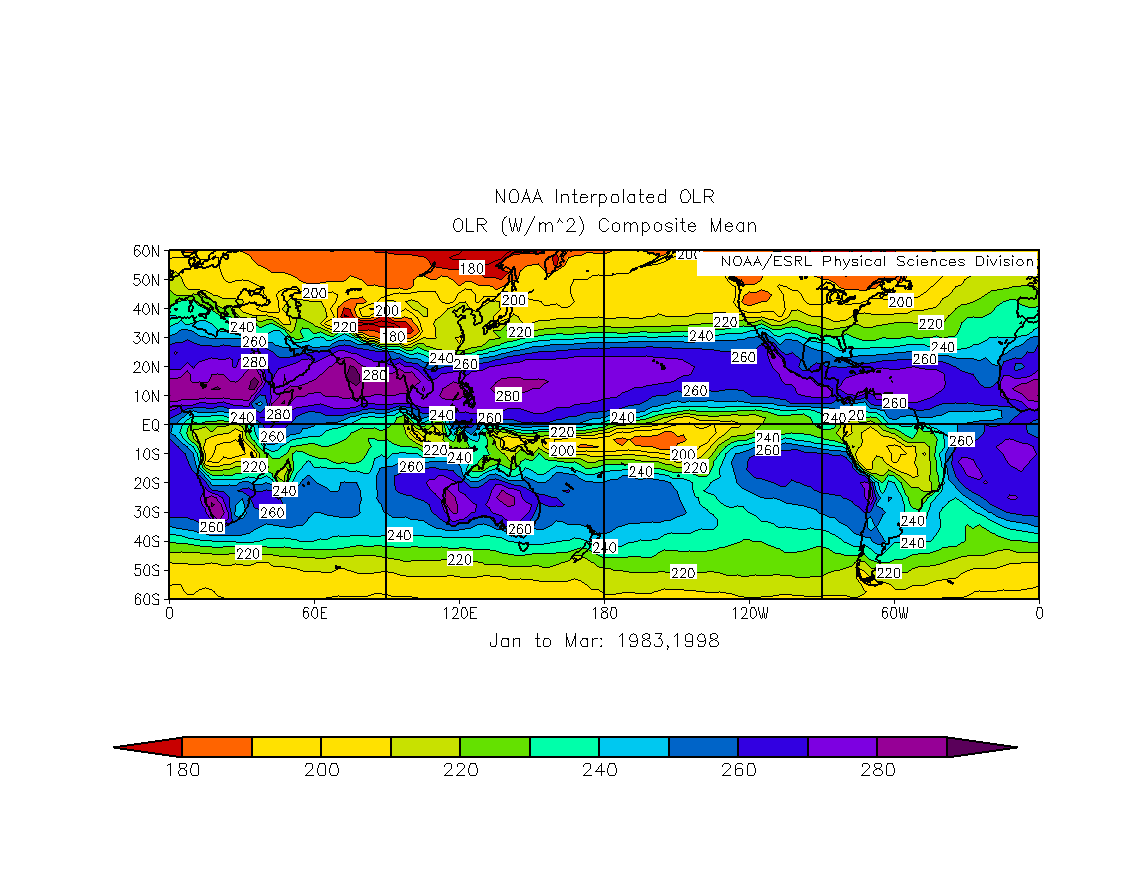
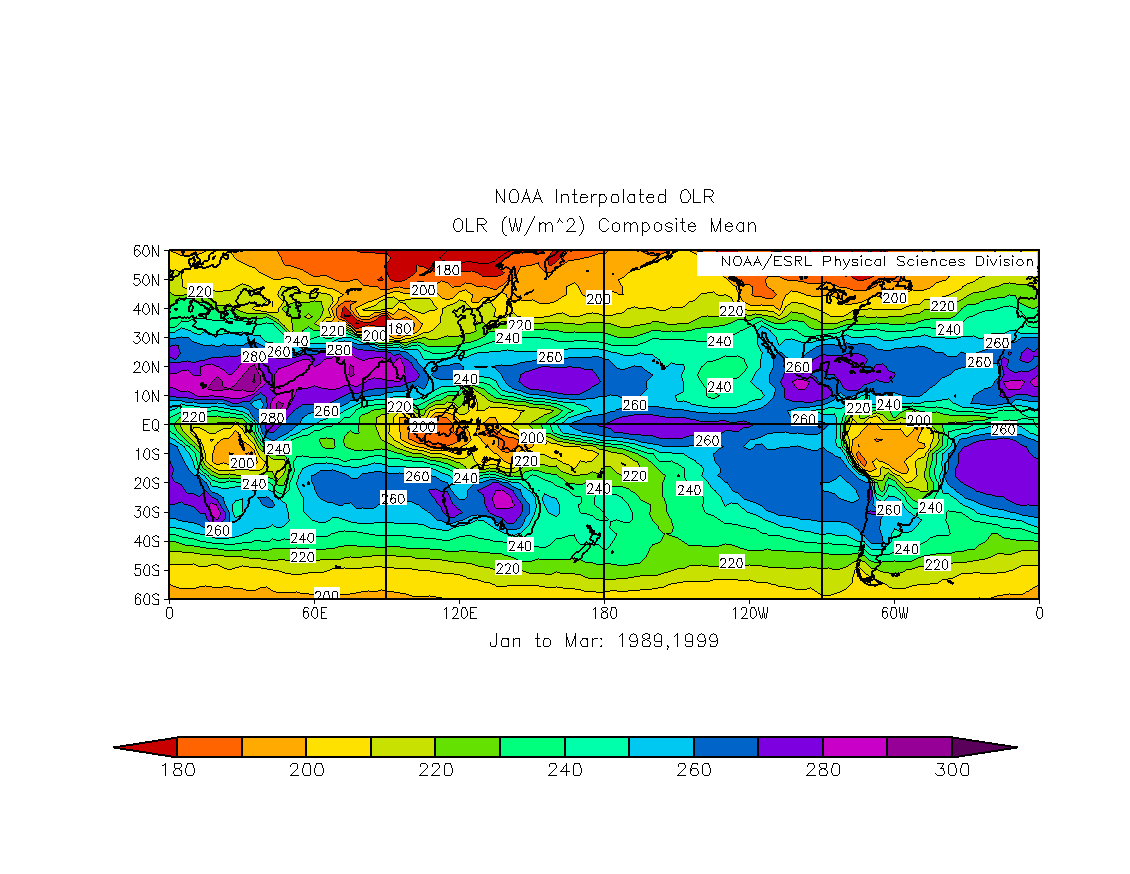
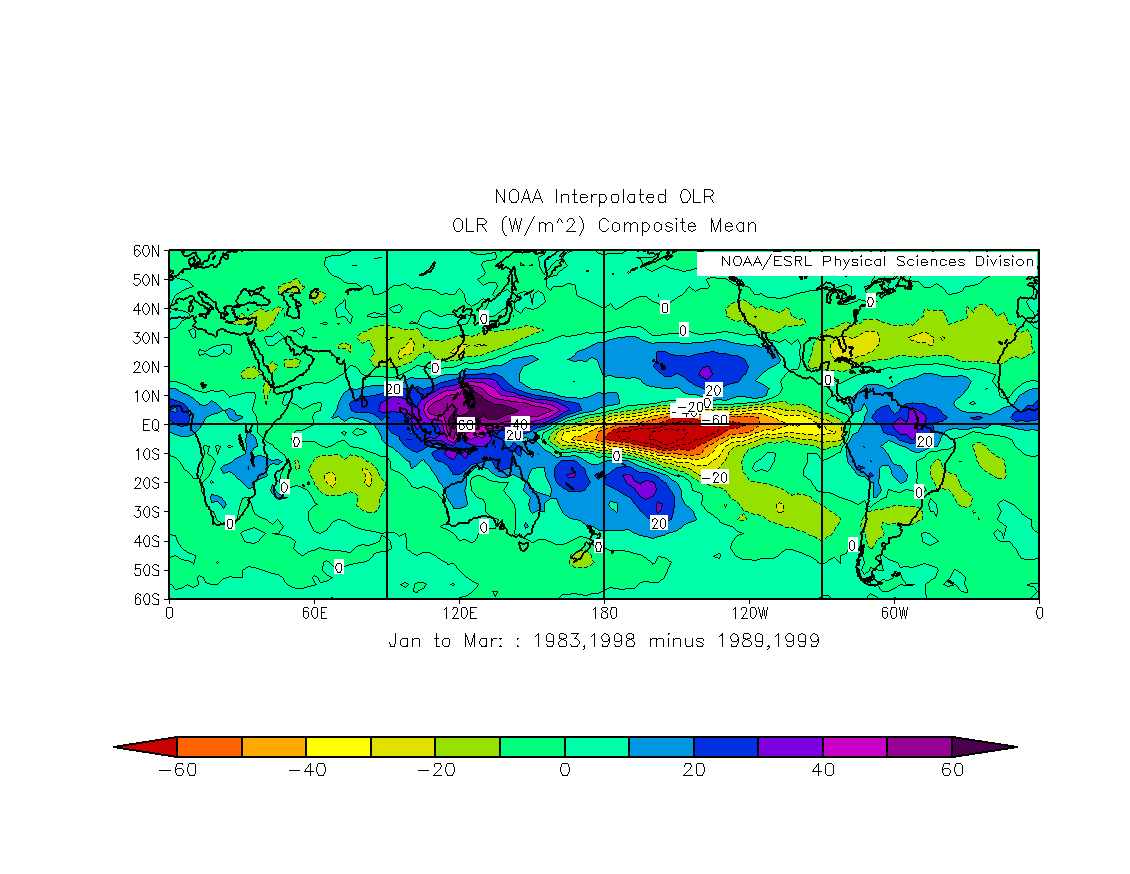
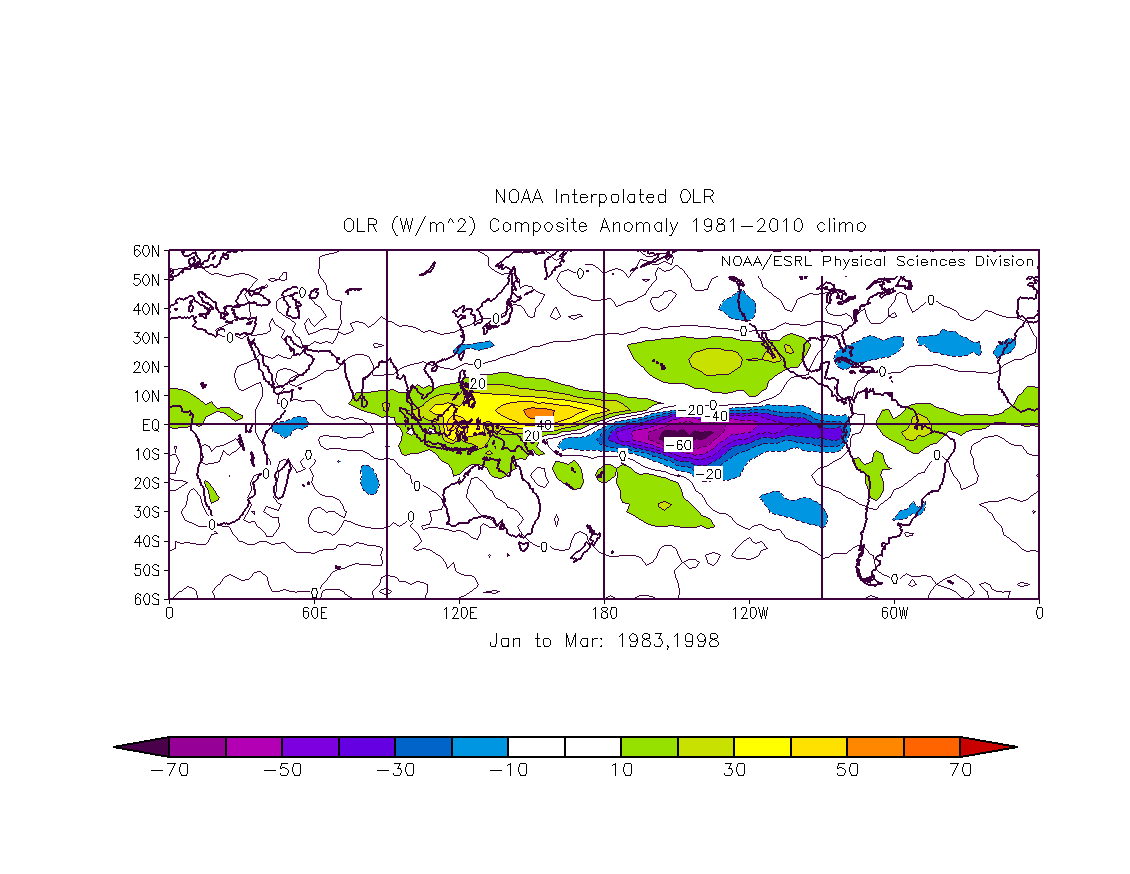
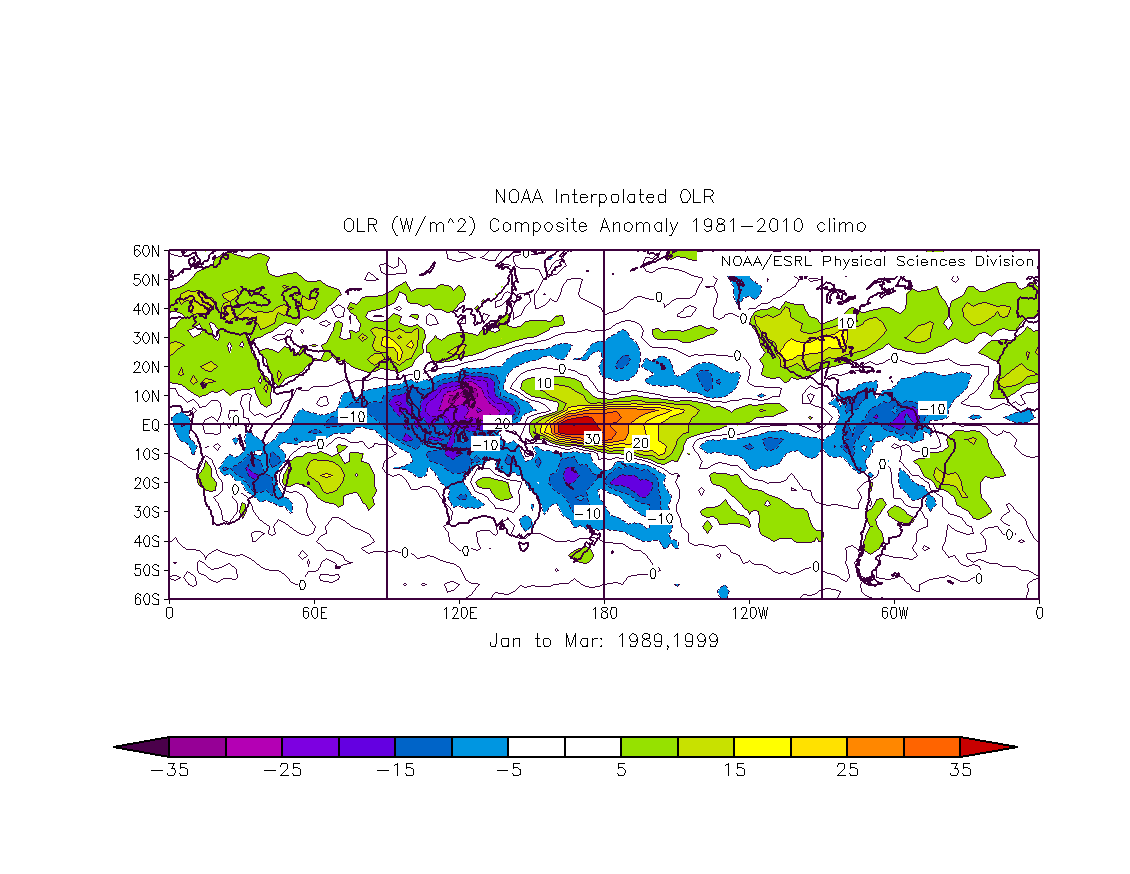
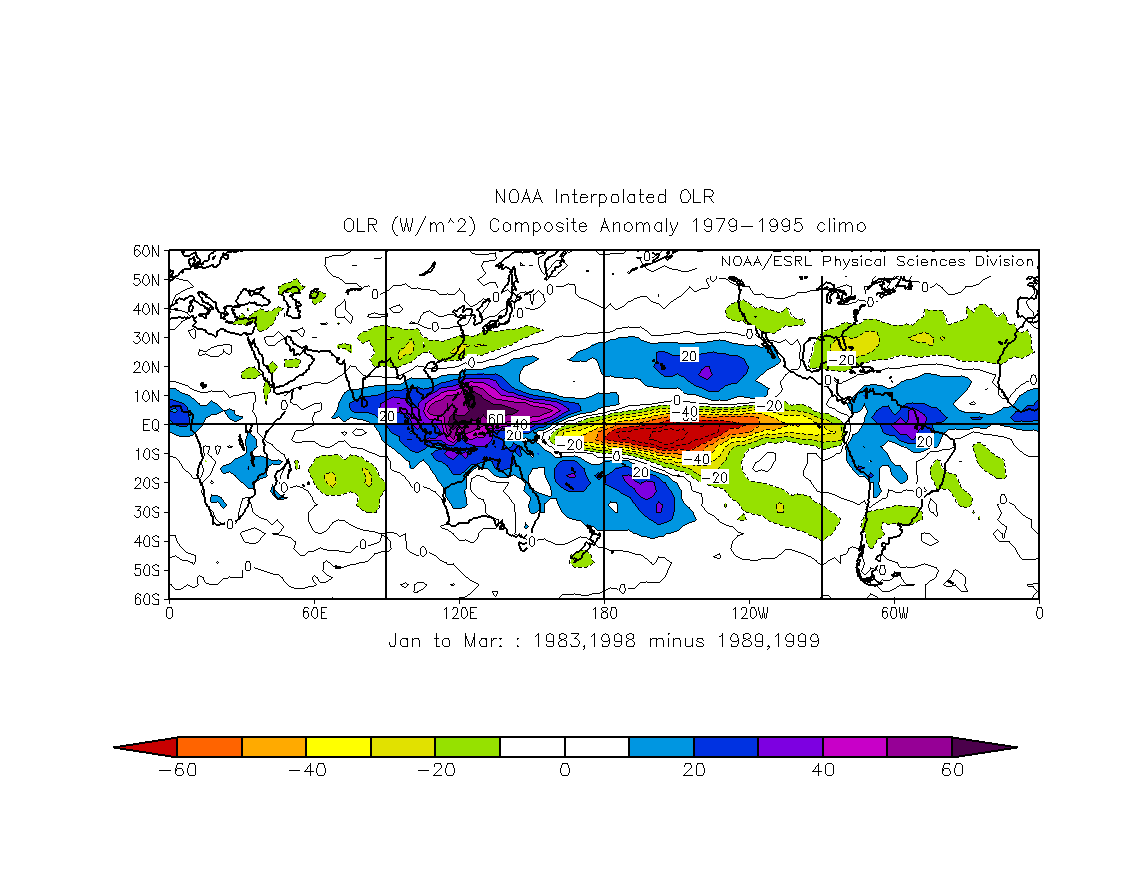
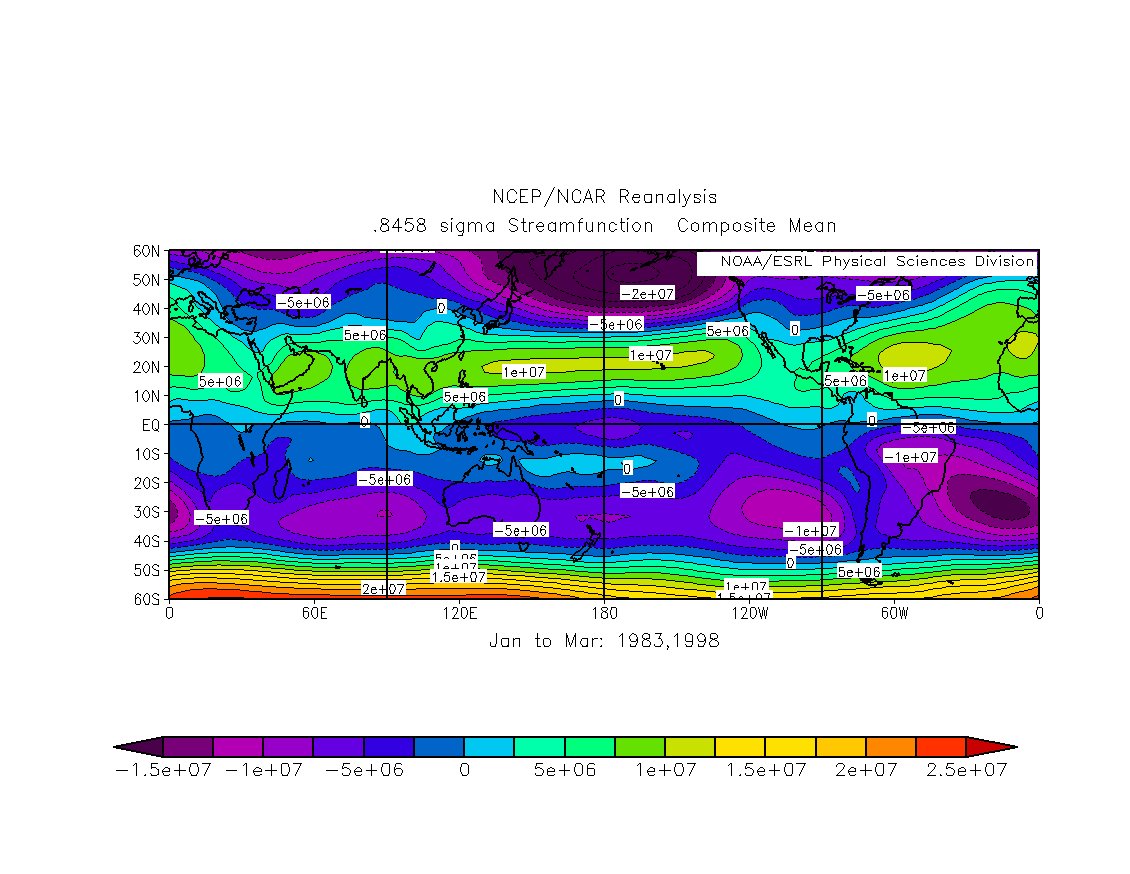
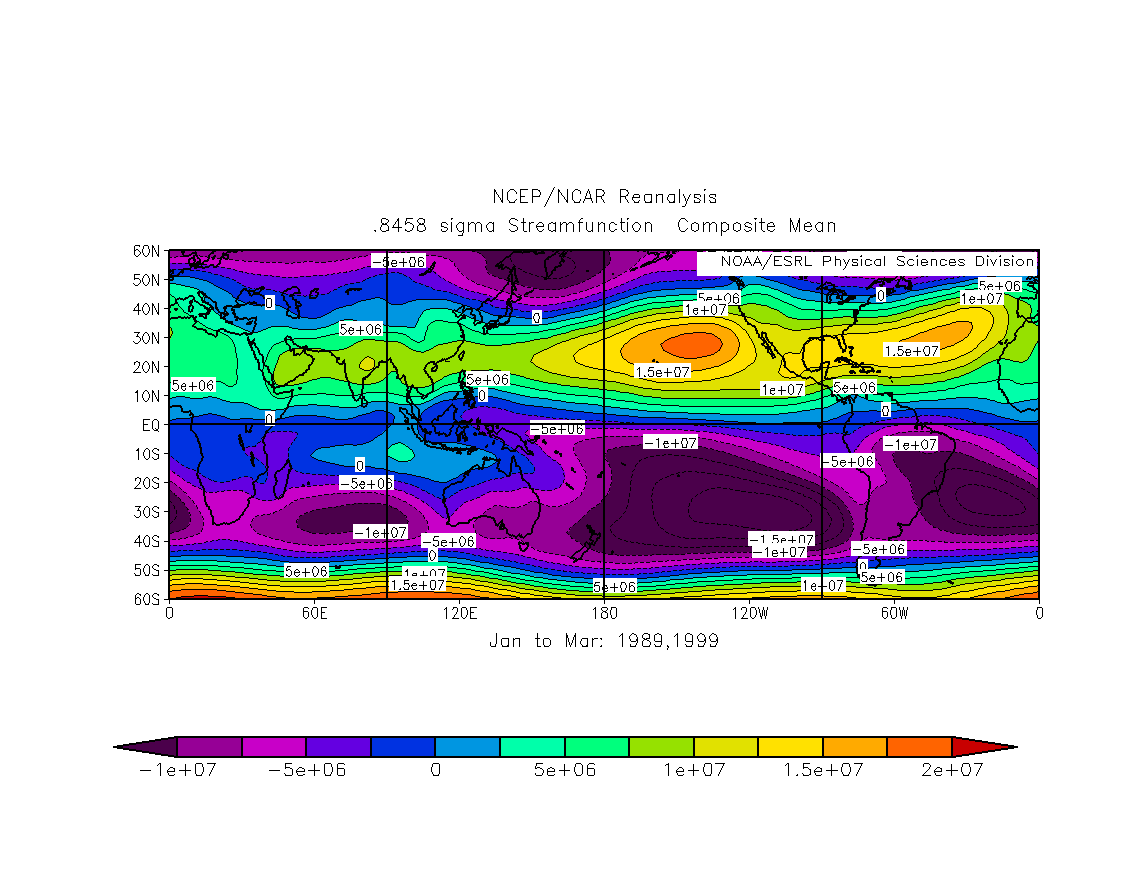
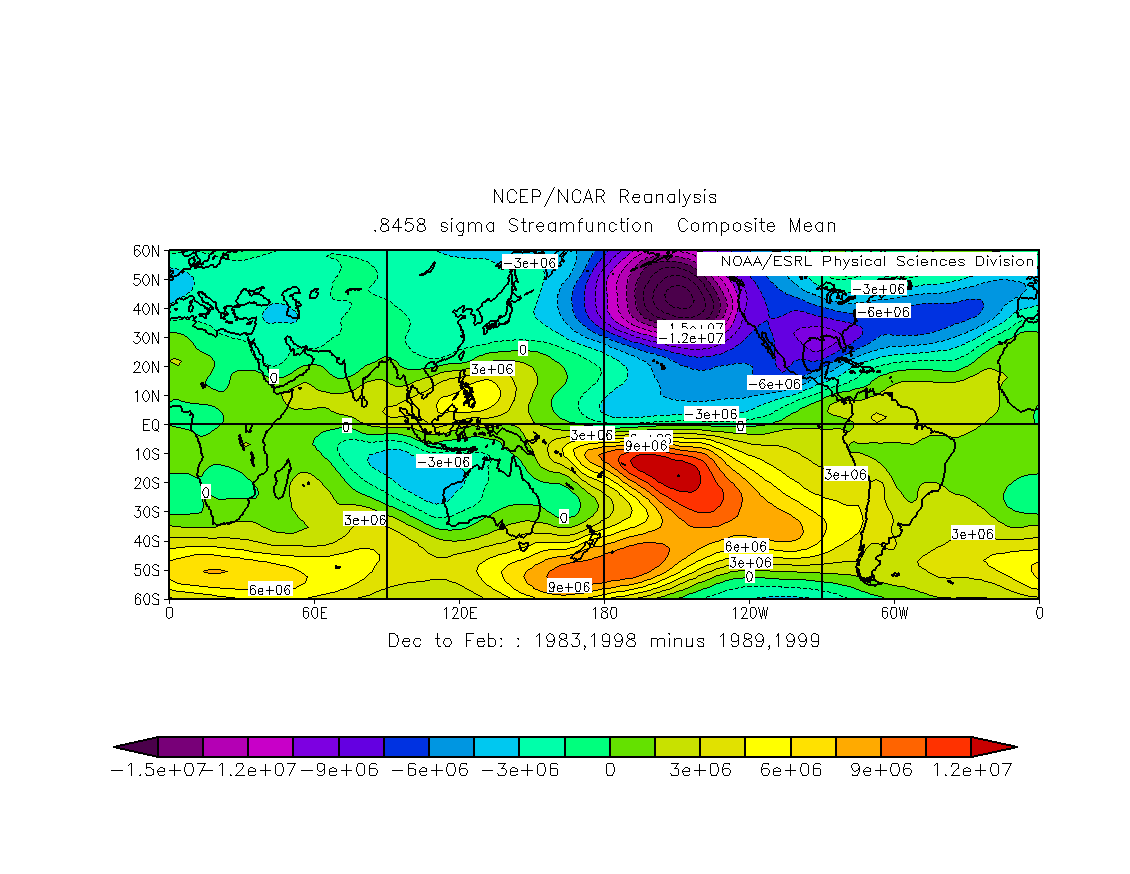
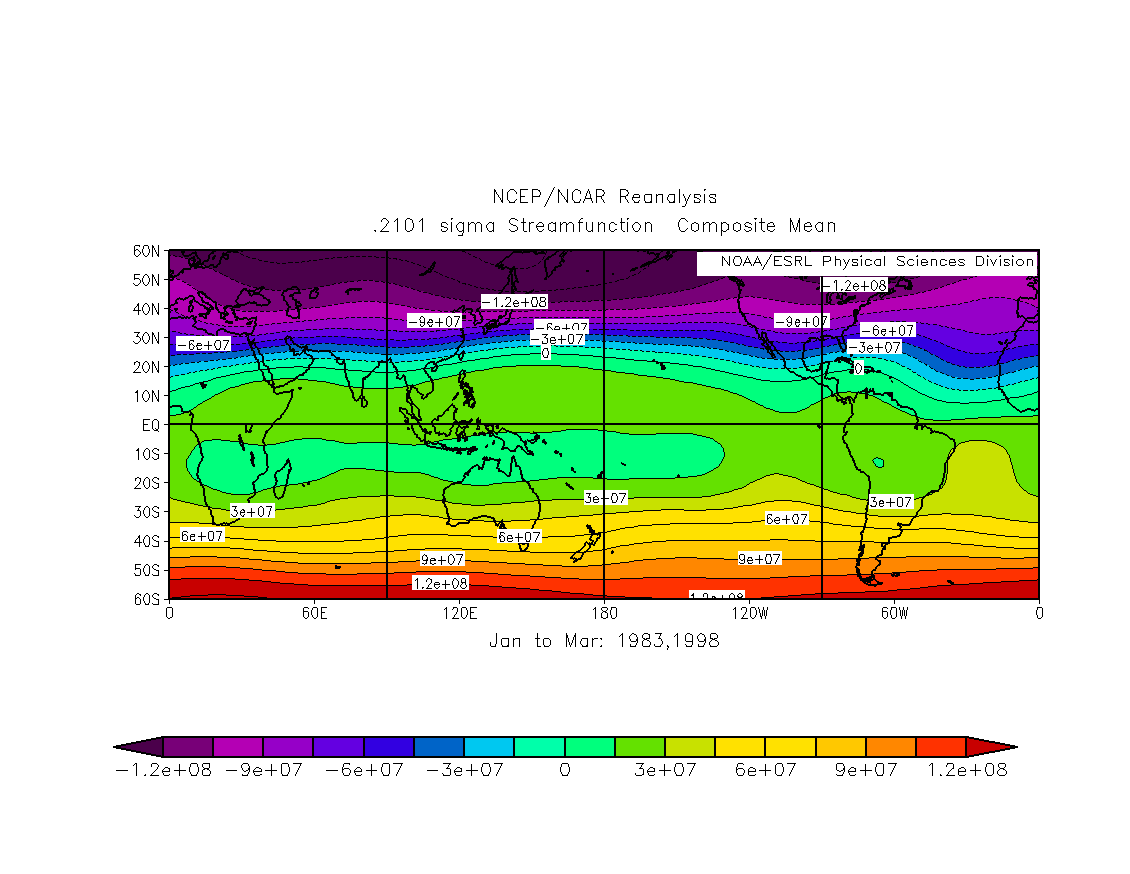
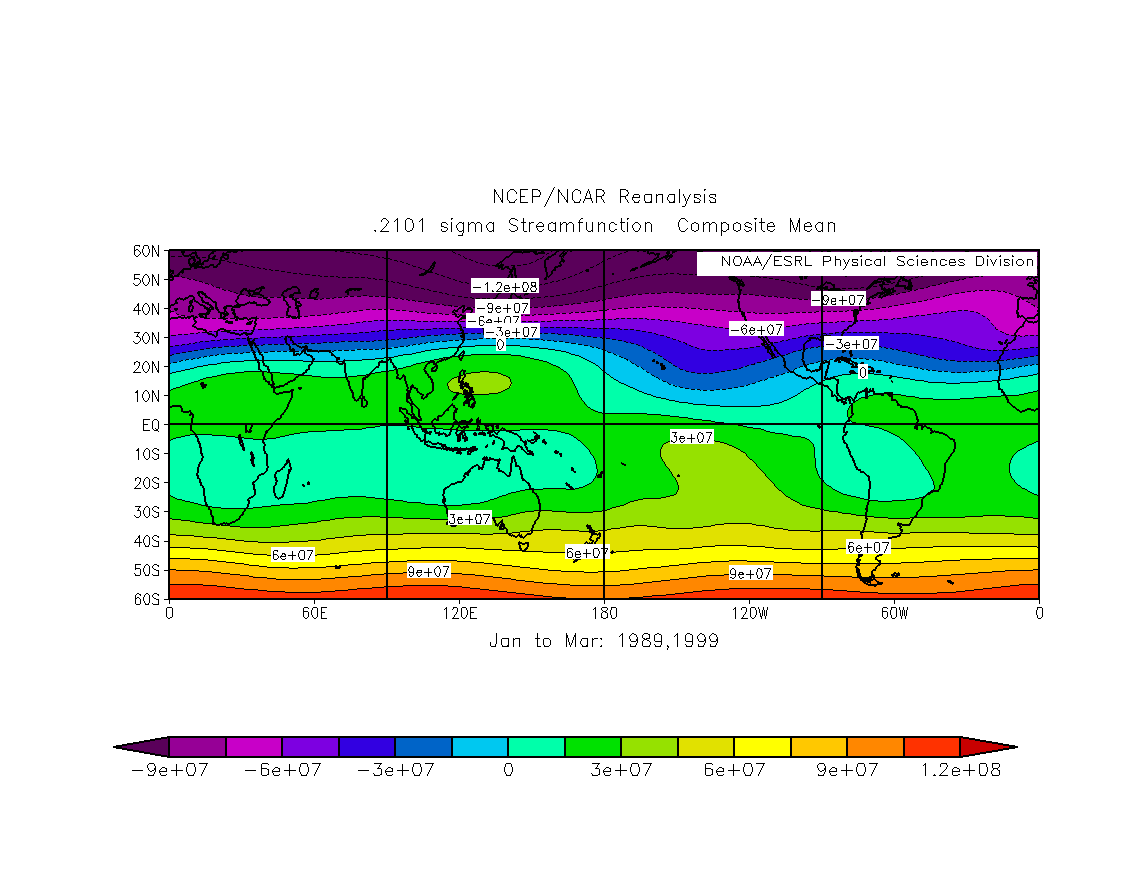
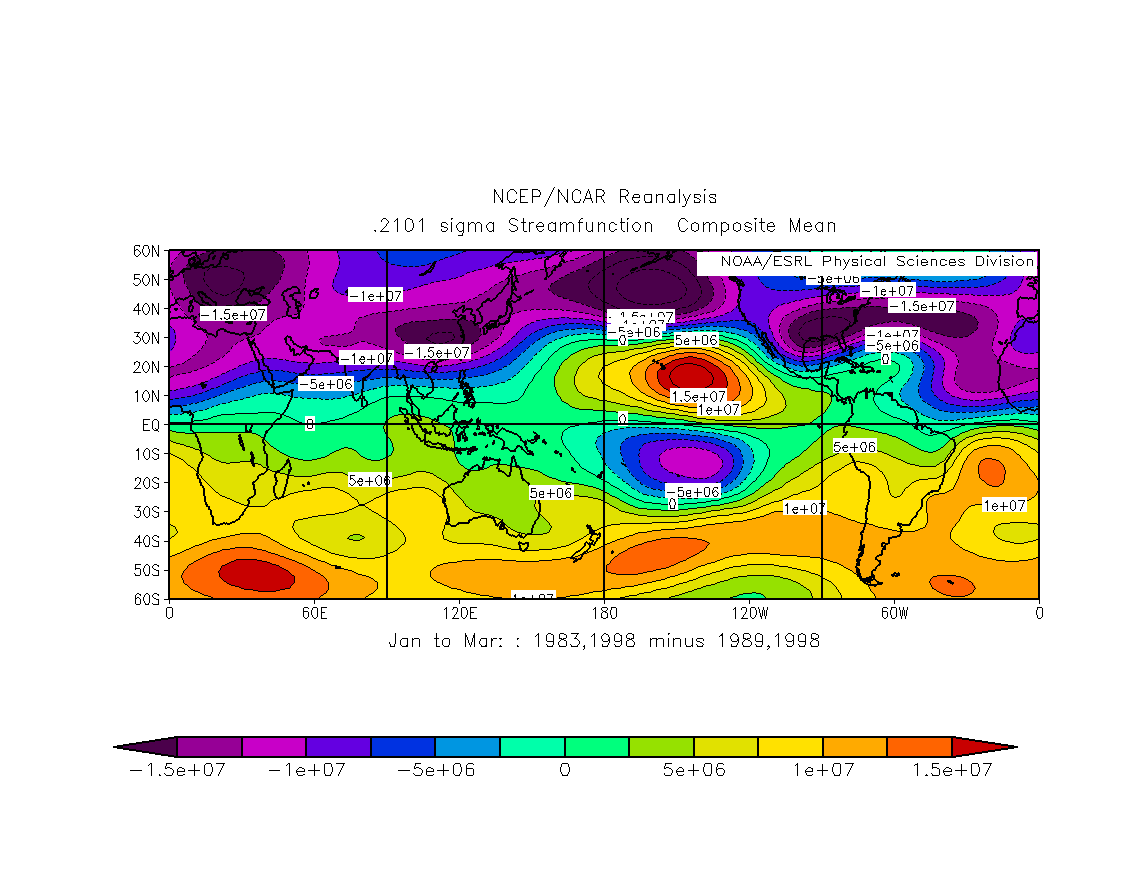
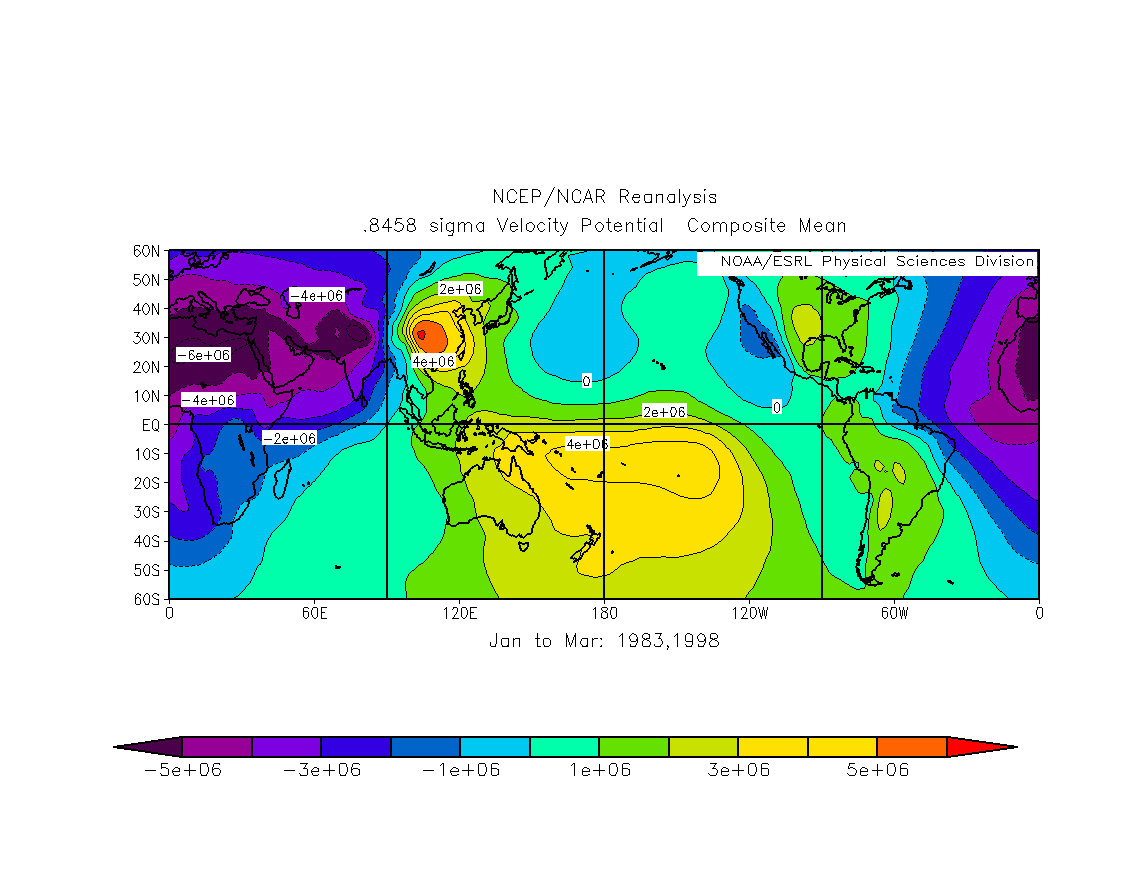
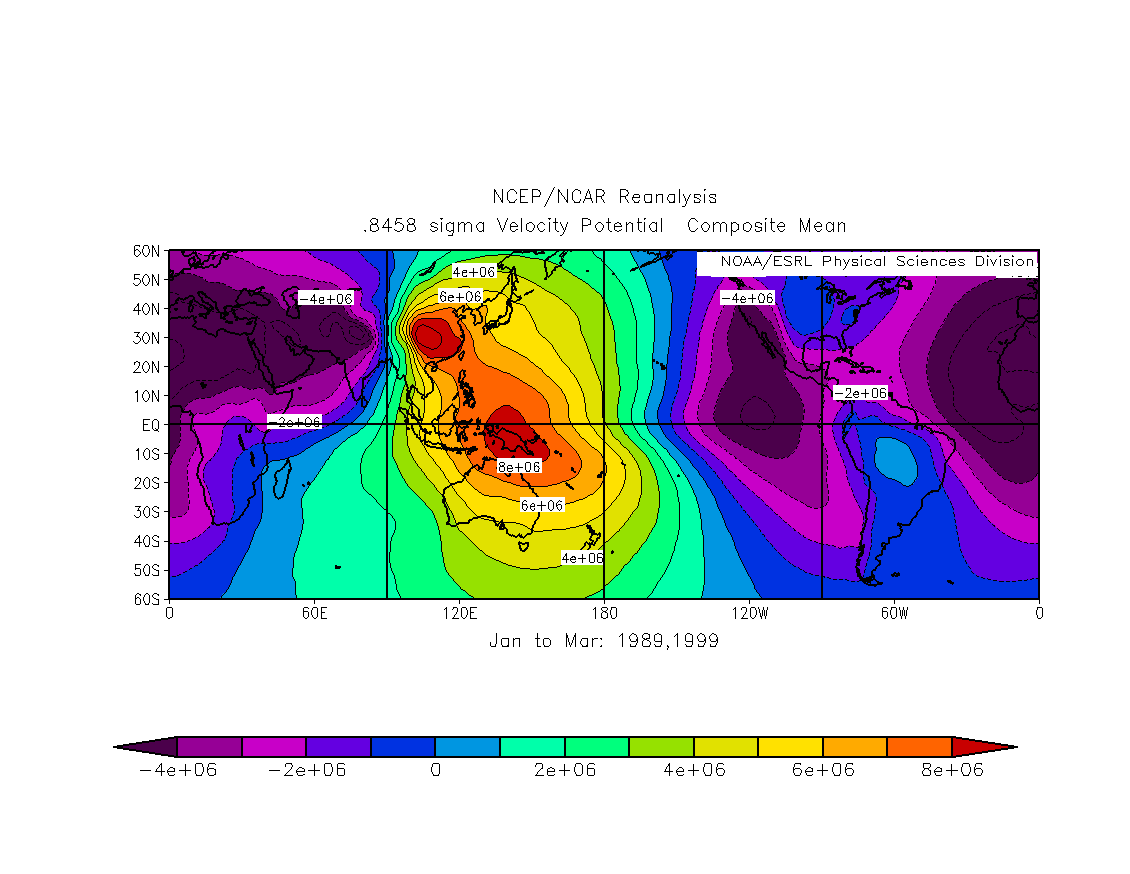
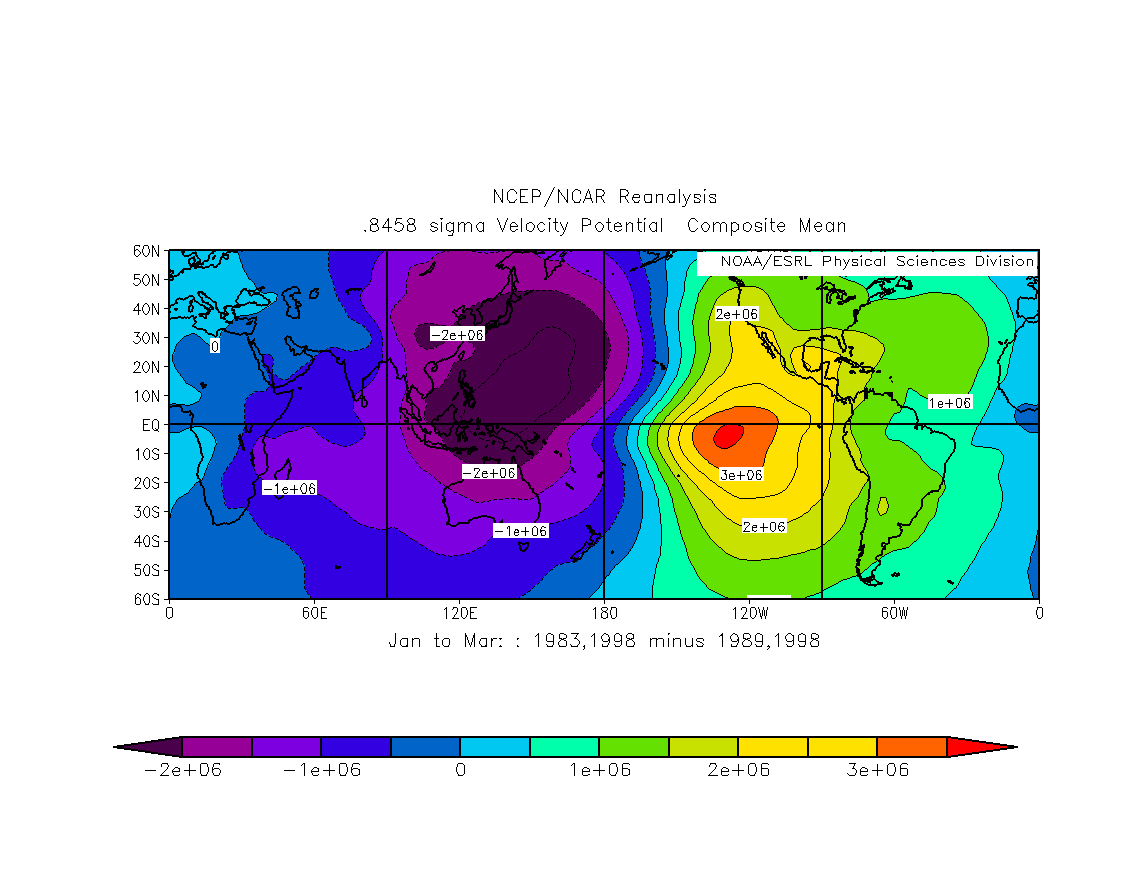
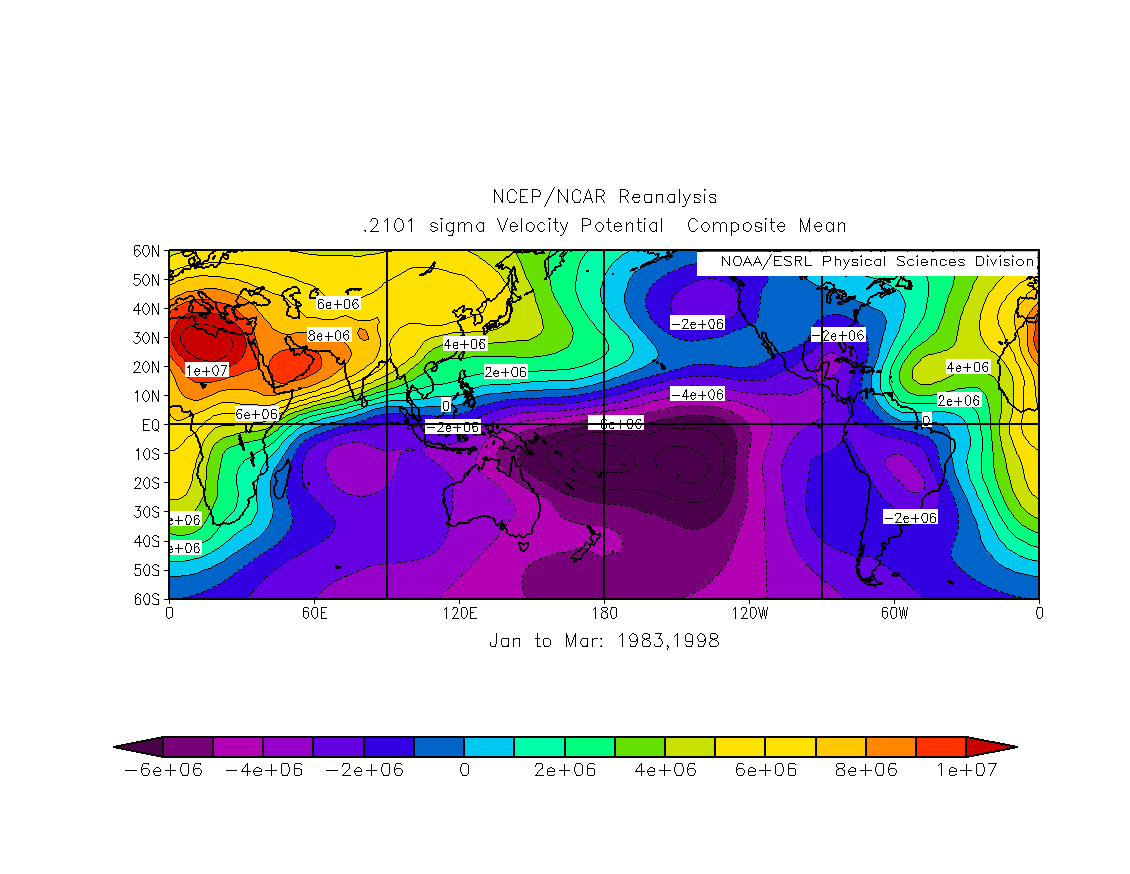
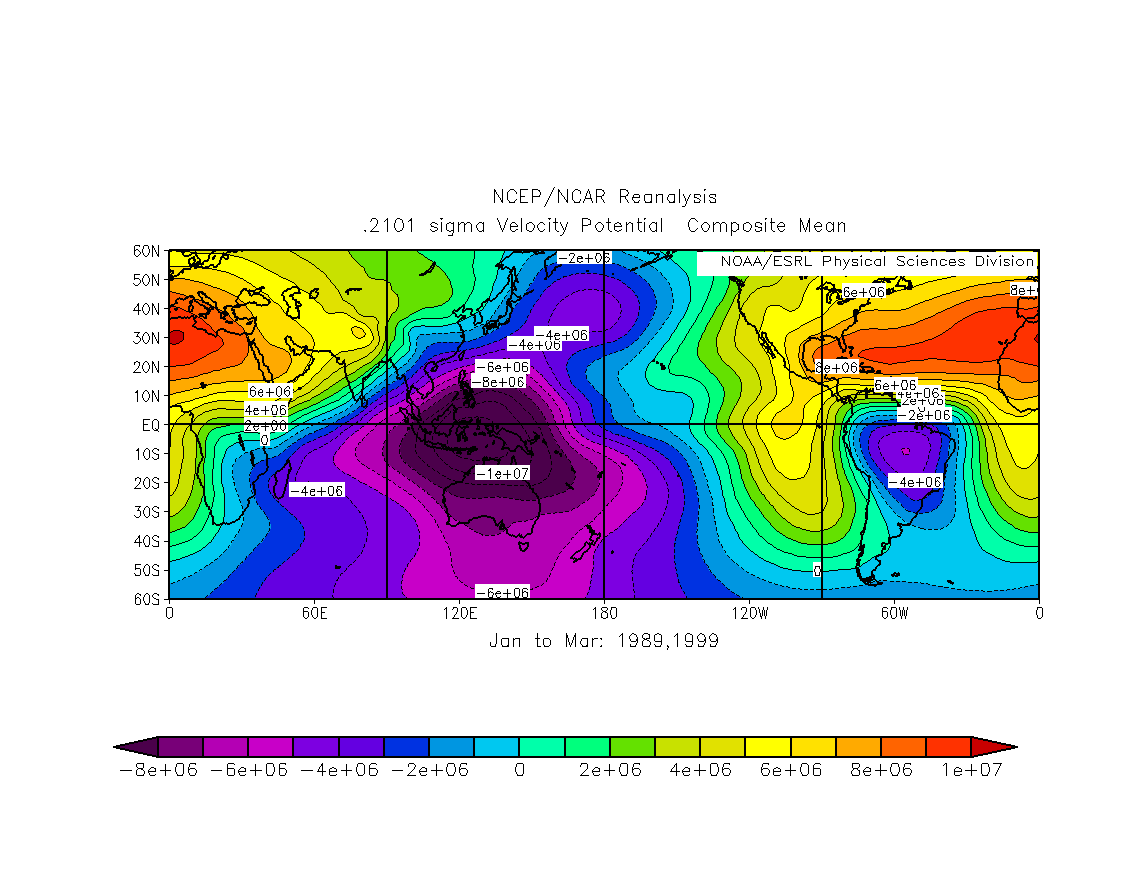
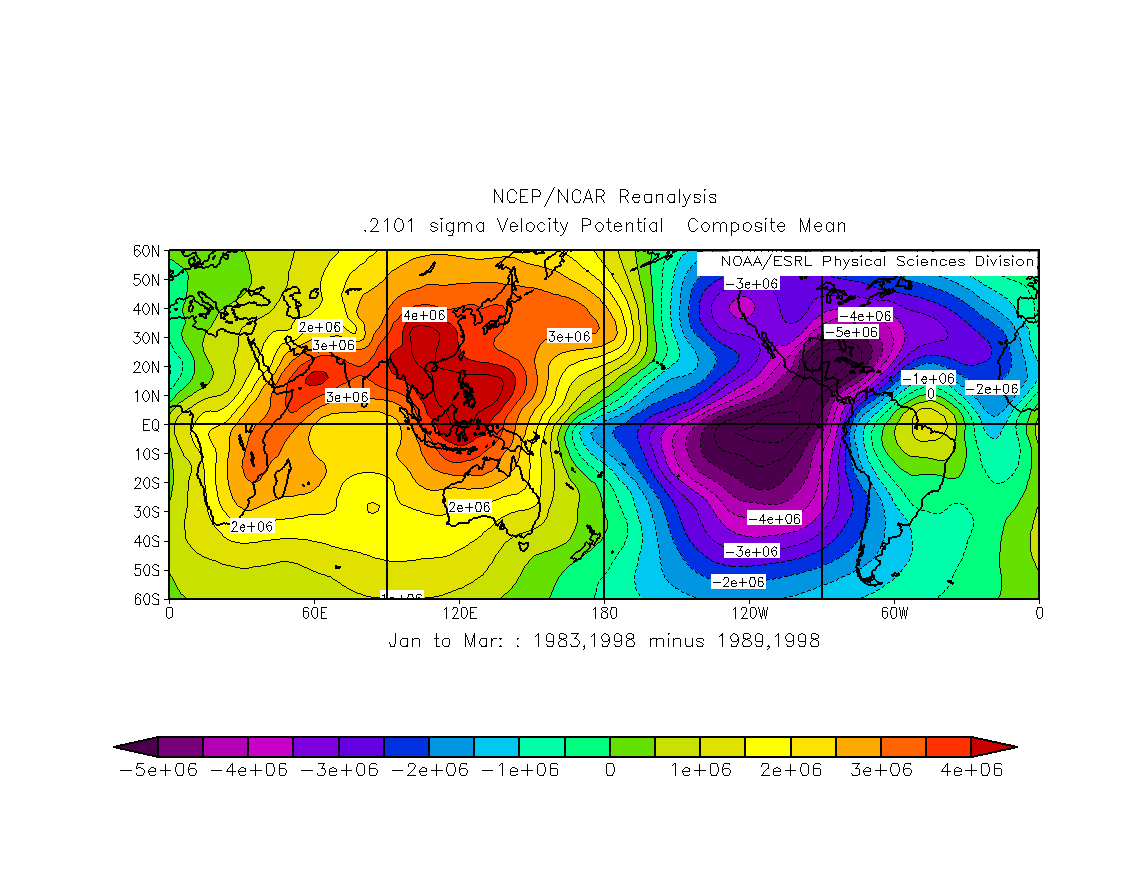
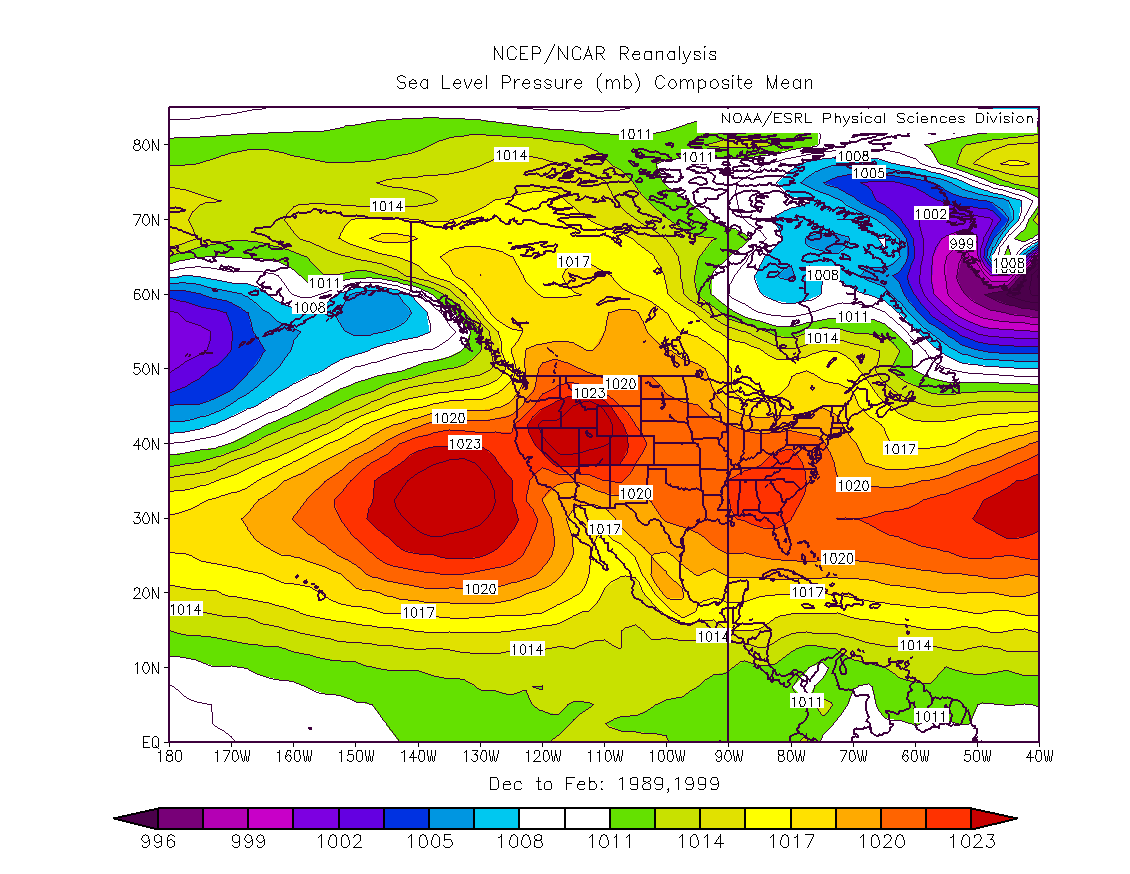
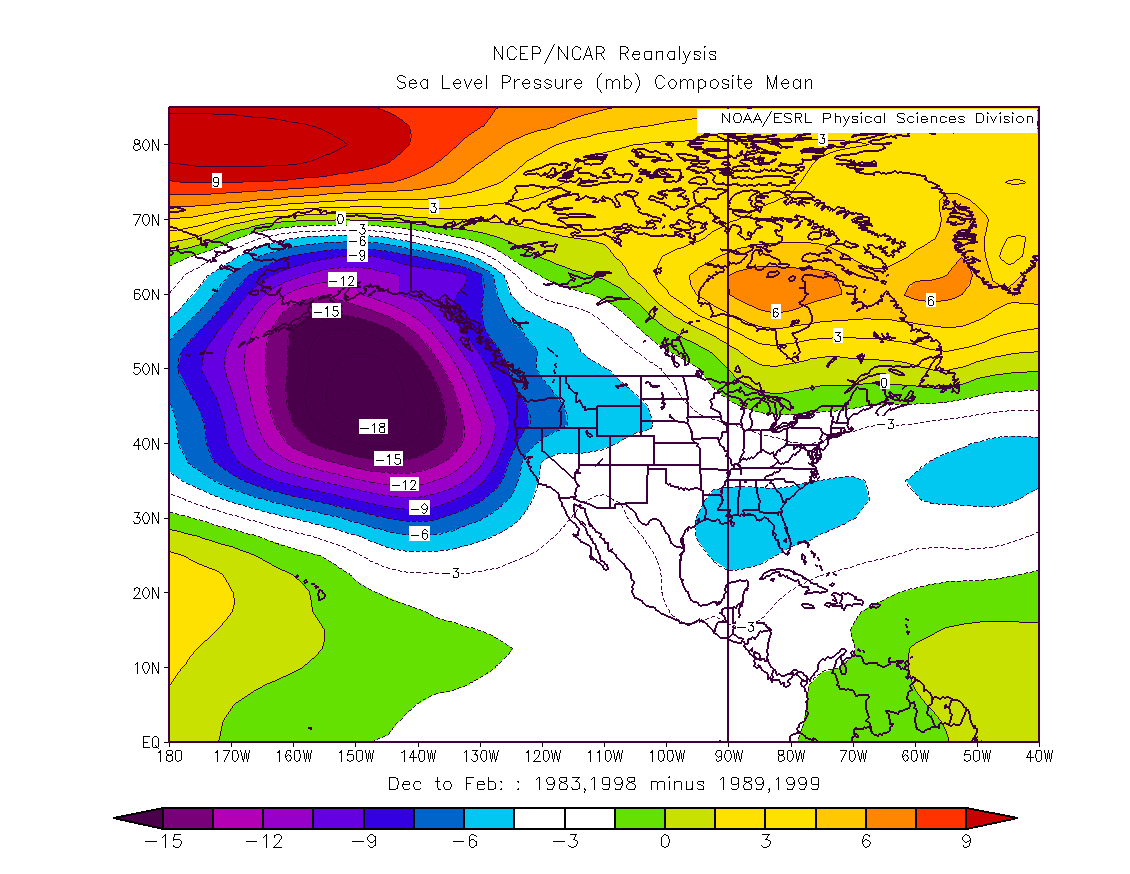
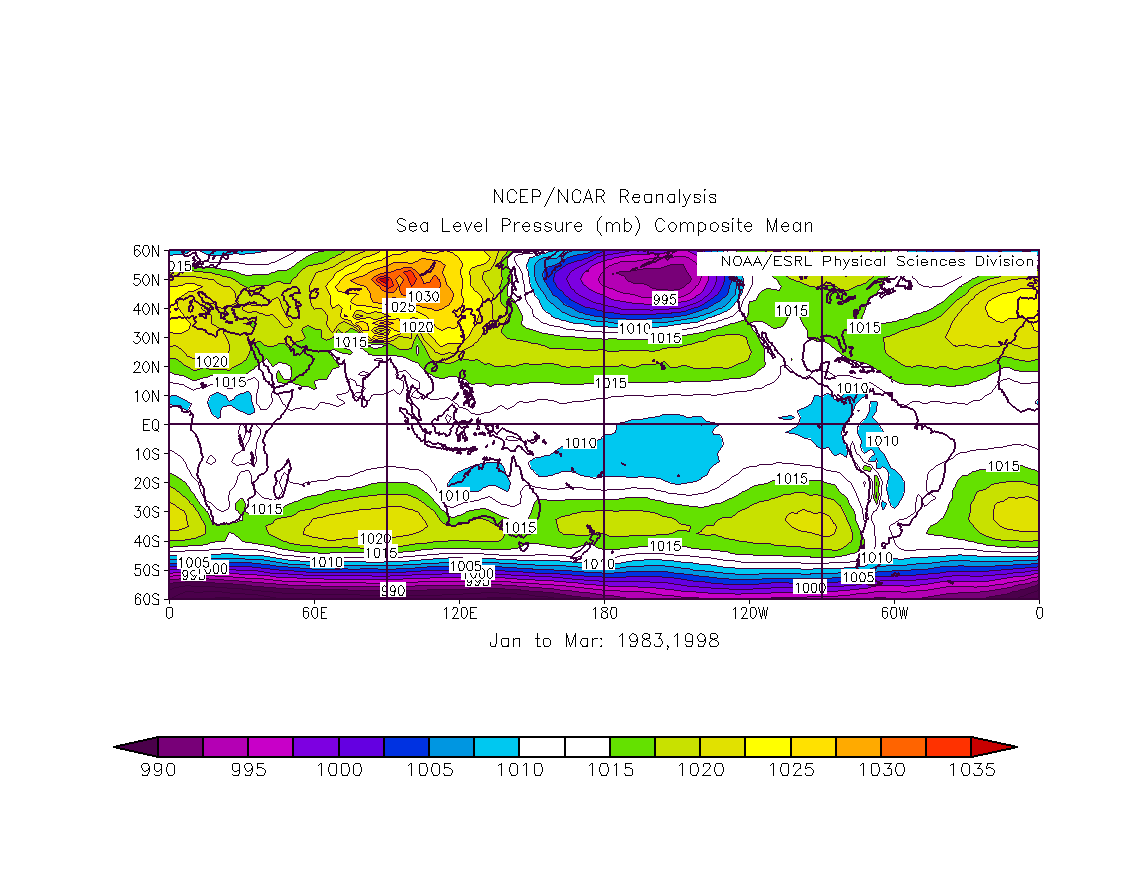
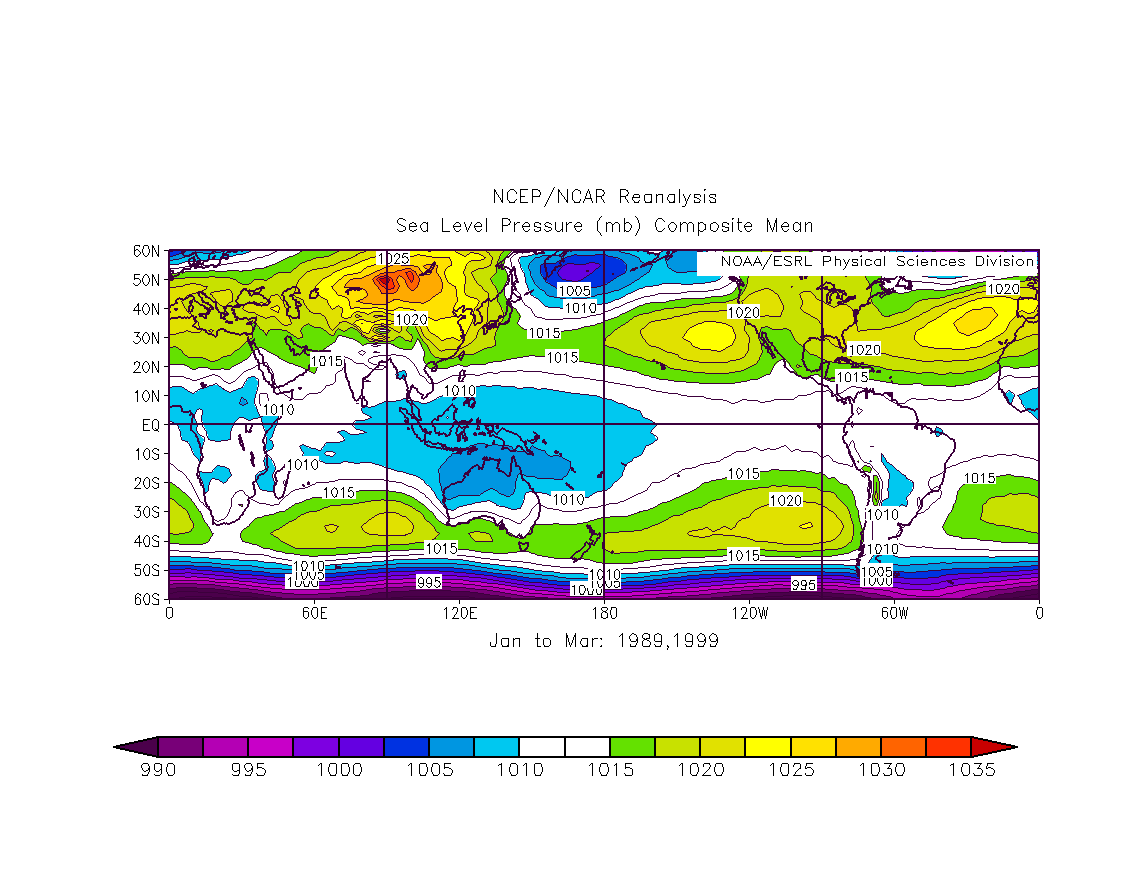
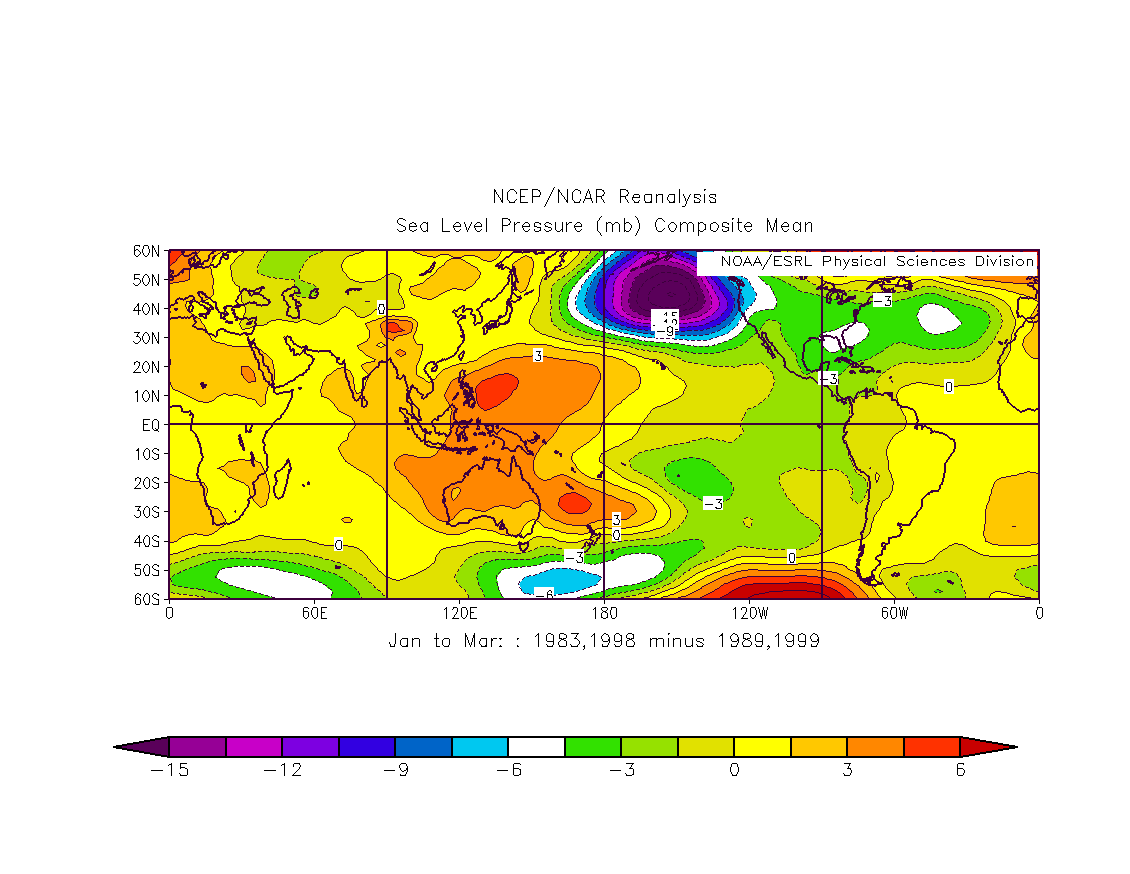
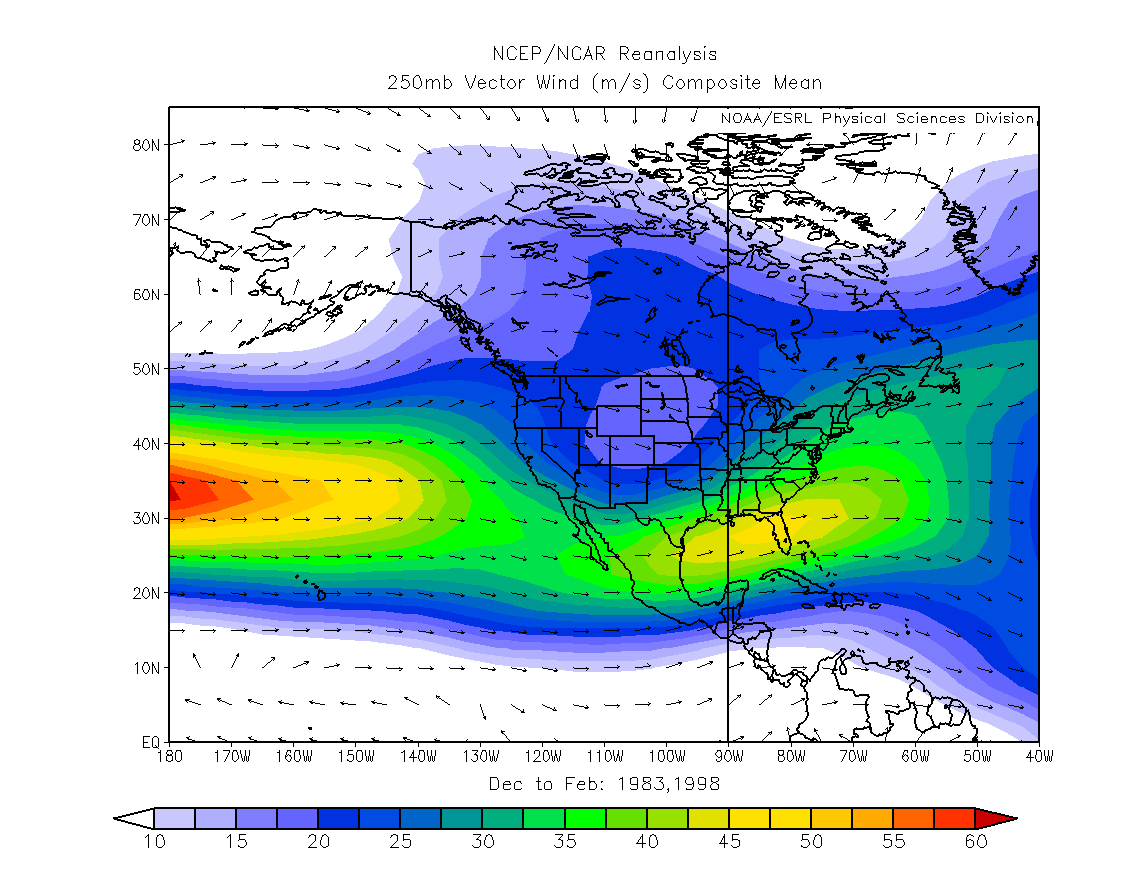
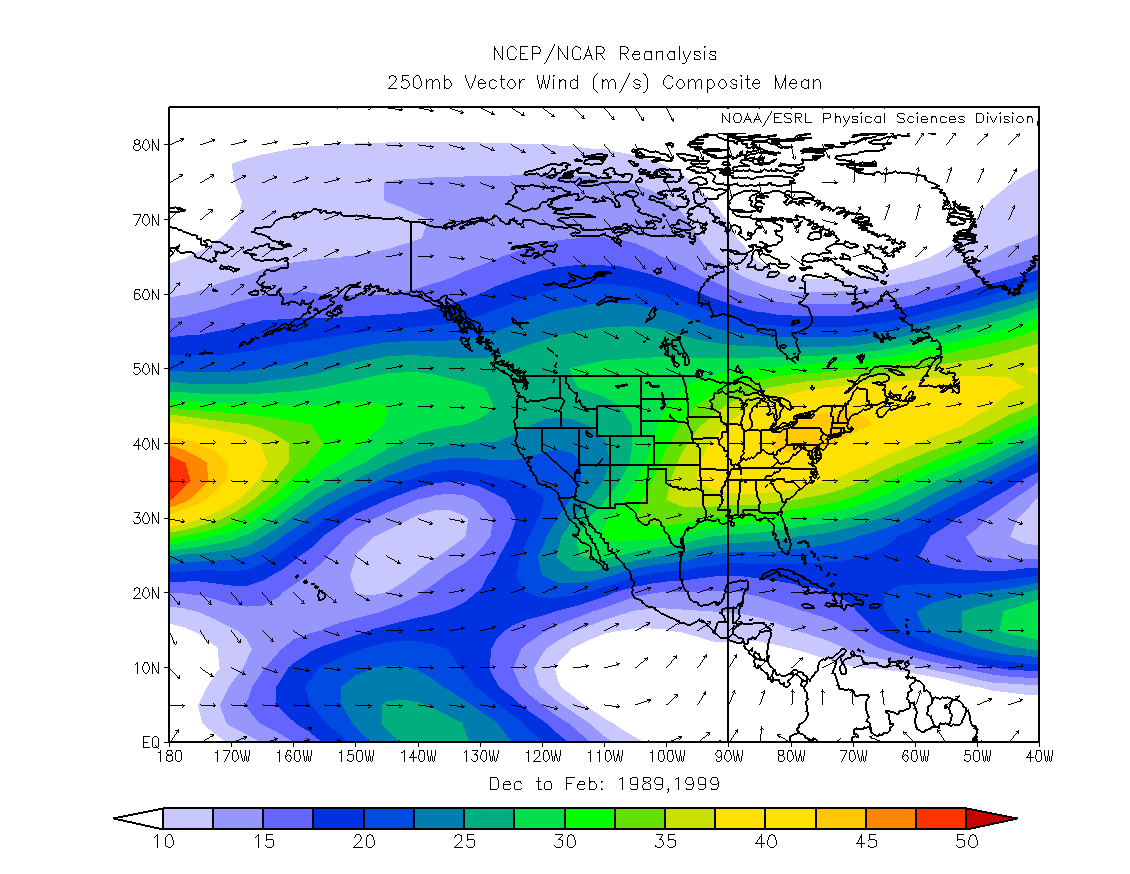
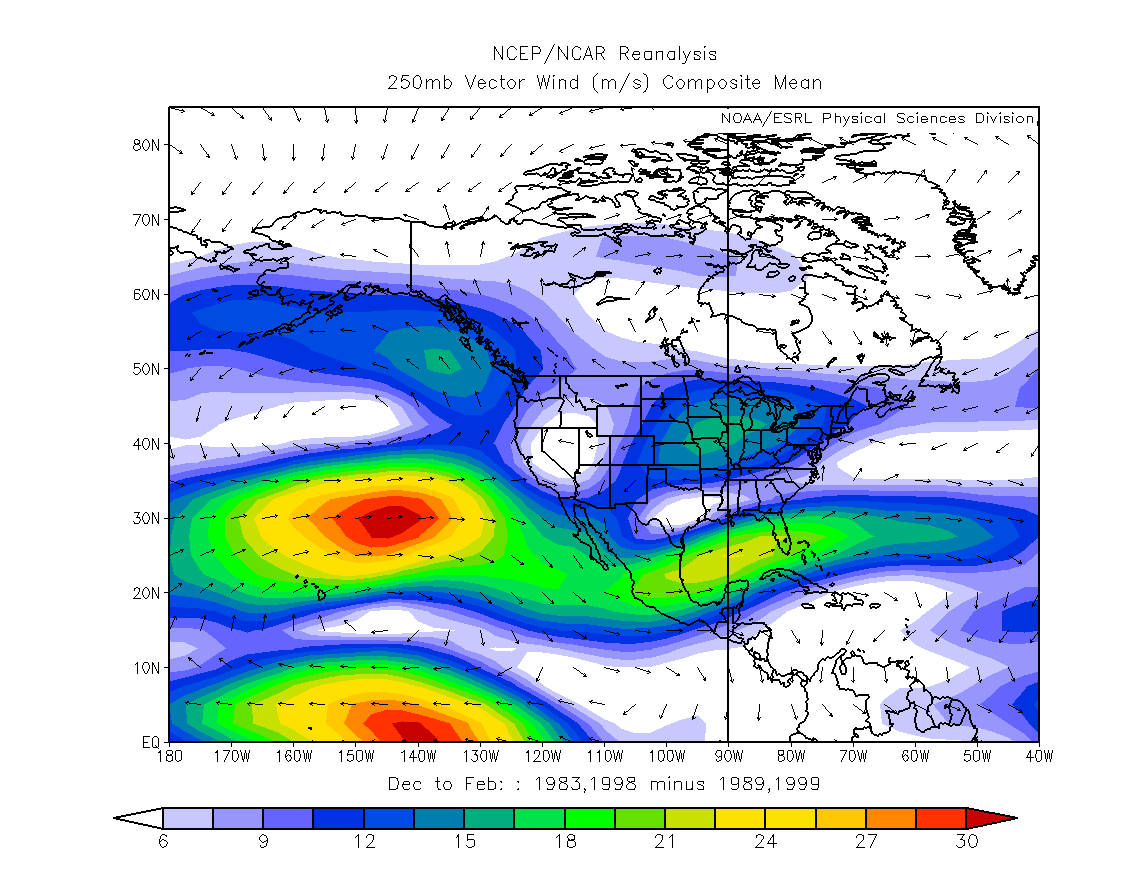
Strong El Nino (JFM 1983 & 1998) and Strong La Nina (JFM 1989 & 1999) Comparison: Means and Differences
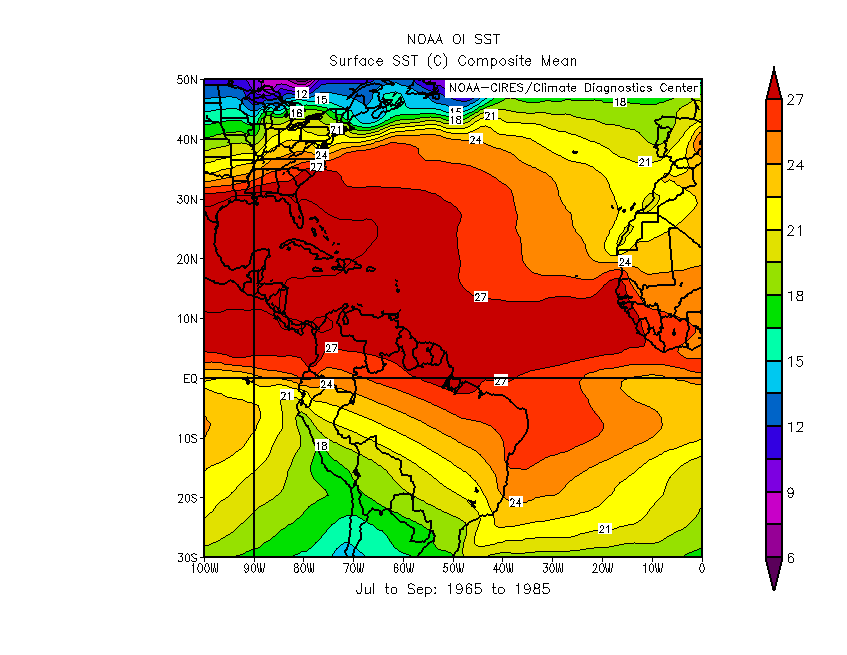
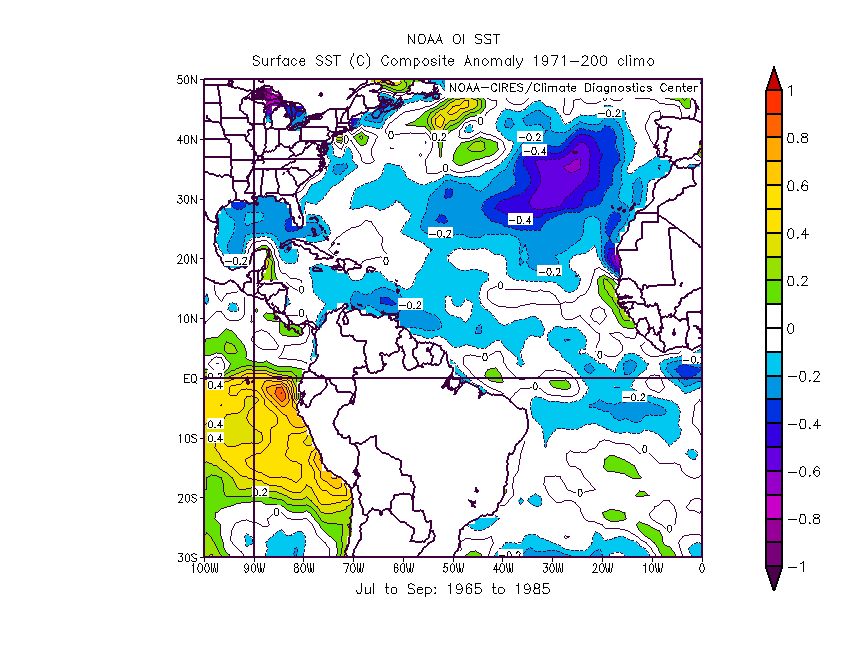
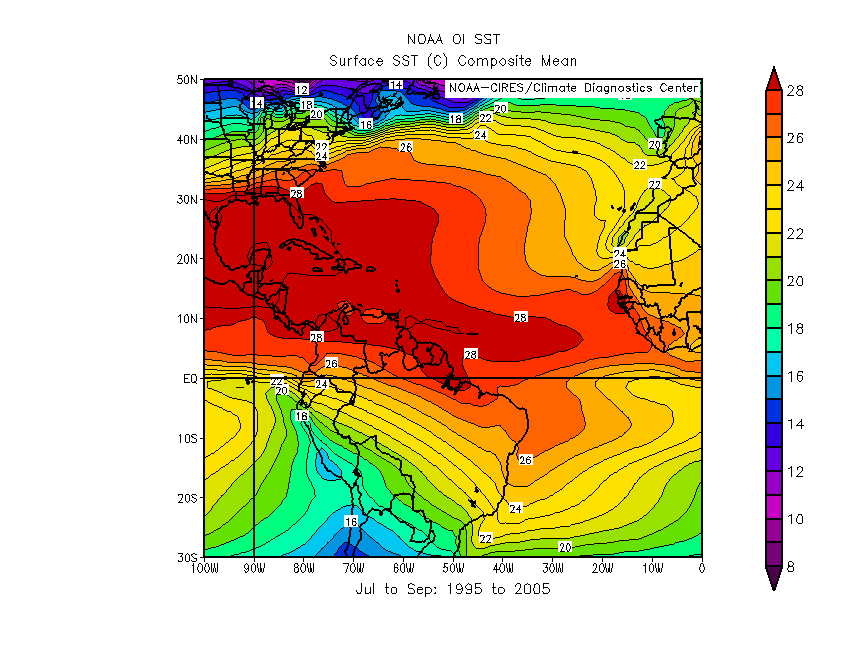
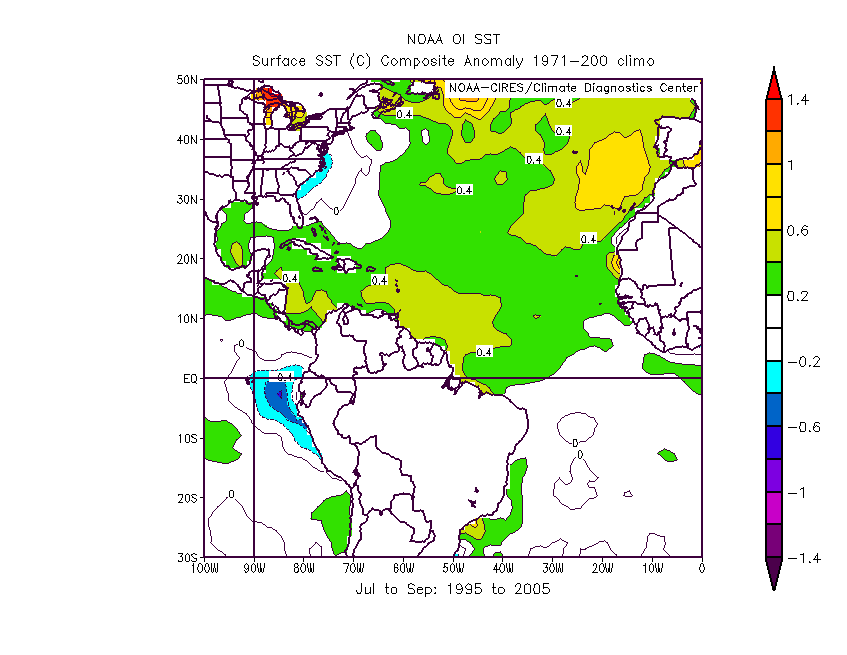
Atlantic Multidecadal Oscillation (AMO)
| • Mean SSTs 1965-1985 JAS | • Anomaly SSTs 1965-1985 JAS |
| • Mean SSTs 1995-2005 JAS | • Anomaly SSTs 1995-2005 JAS |
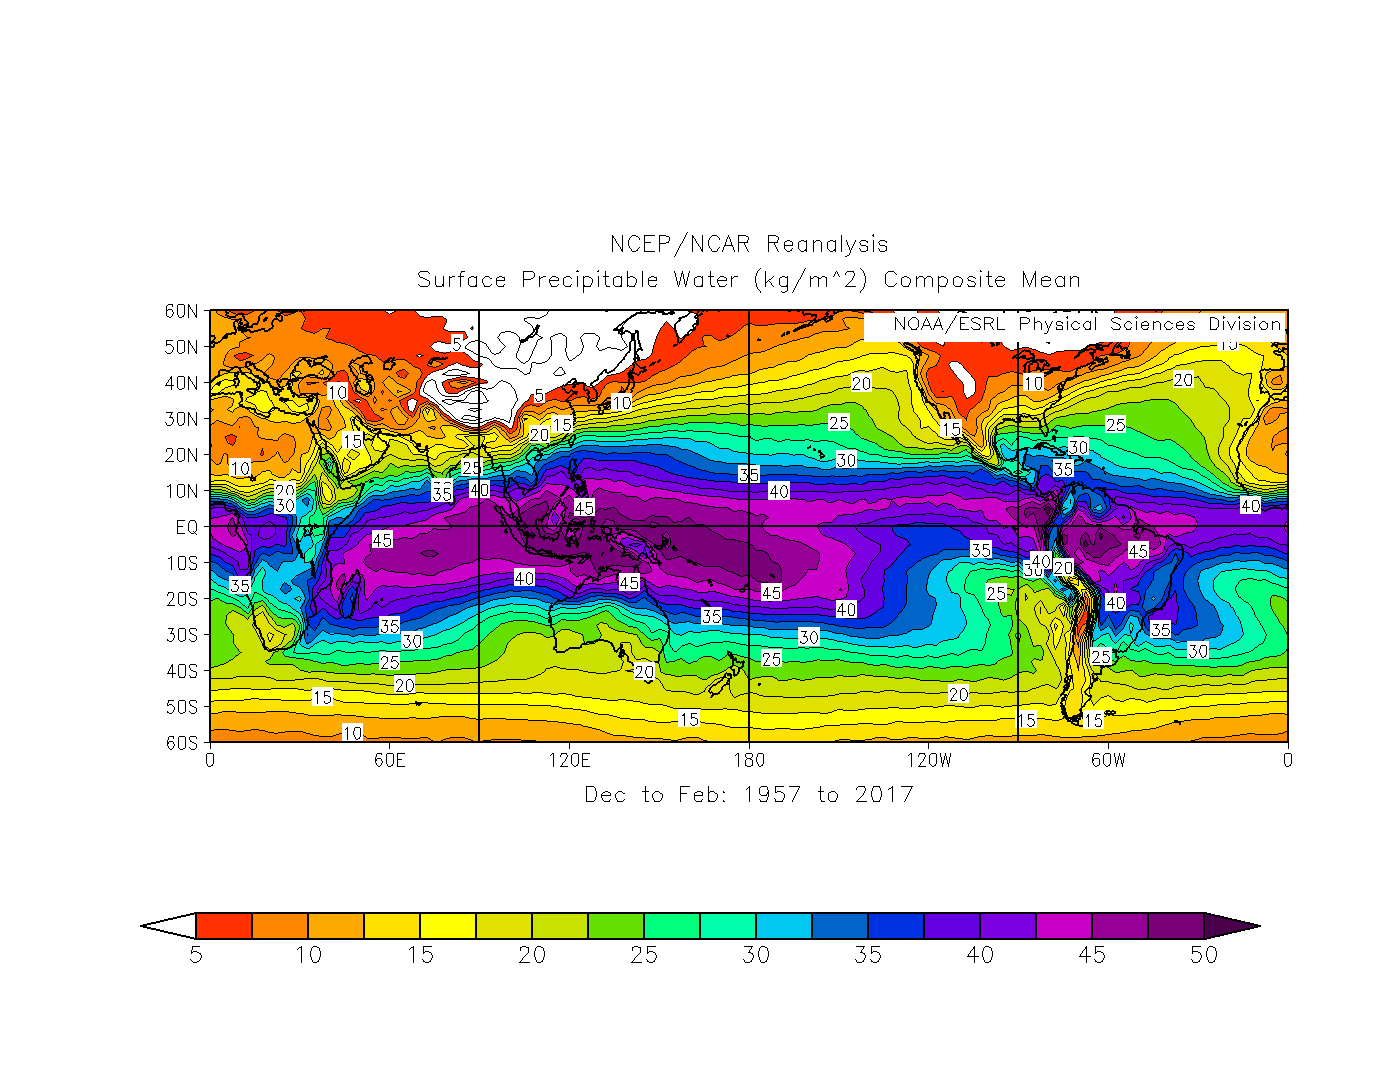
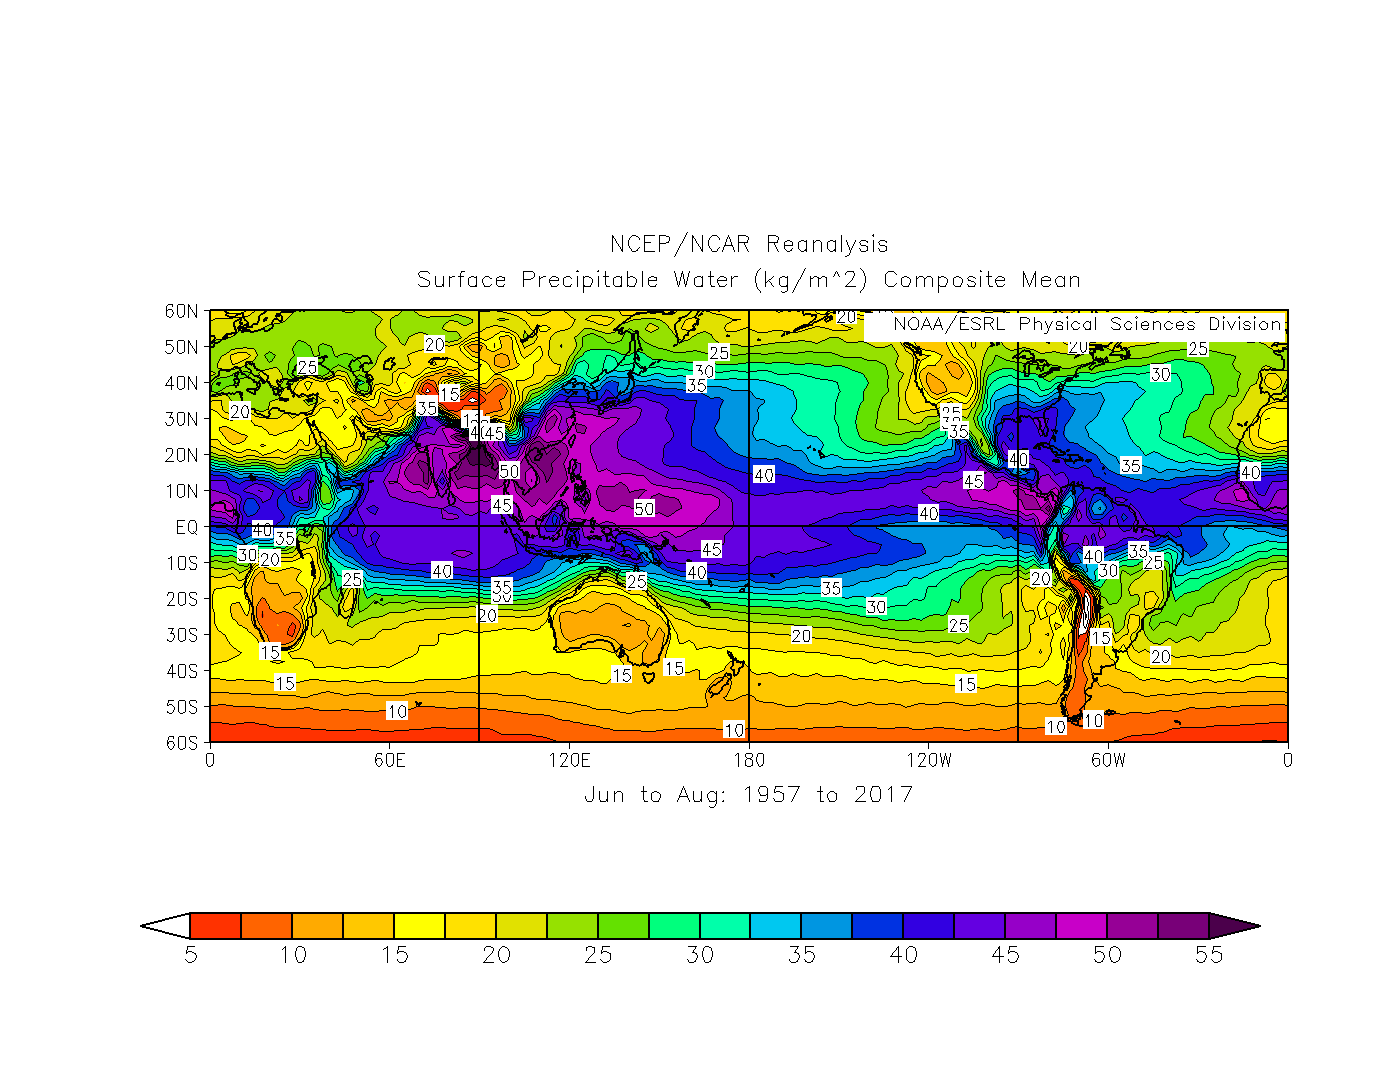
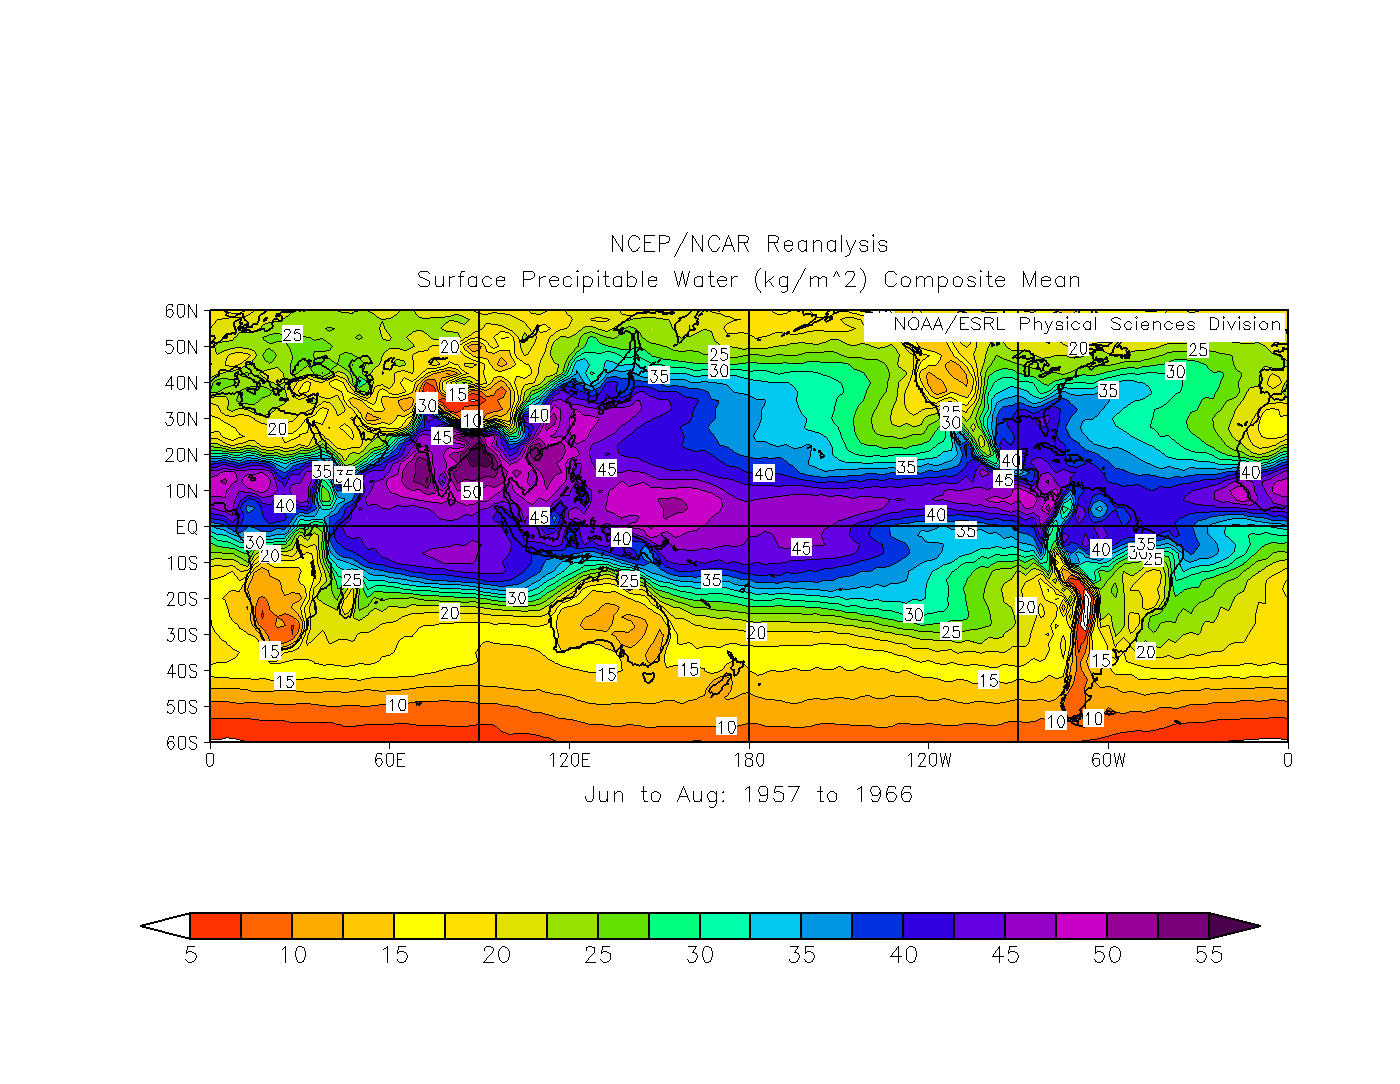
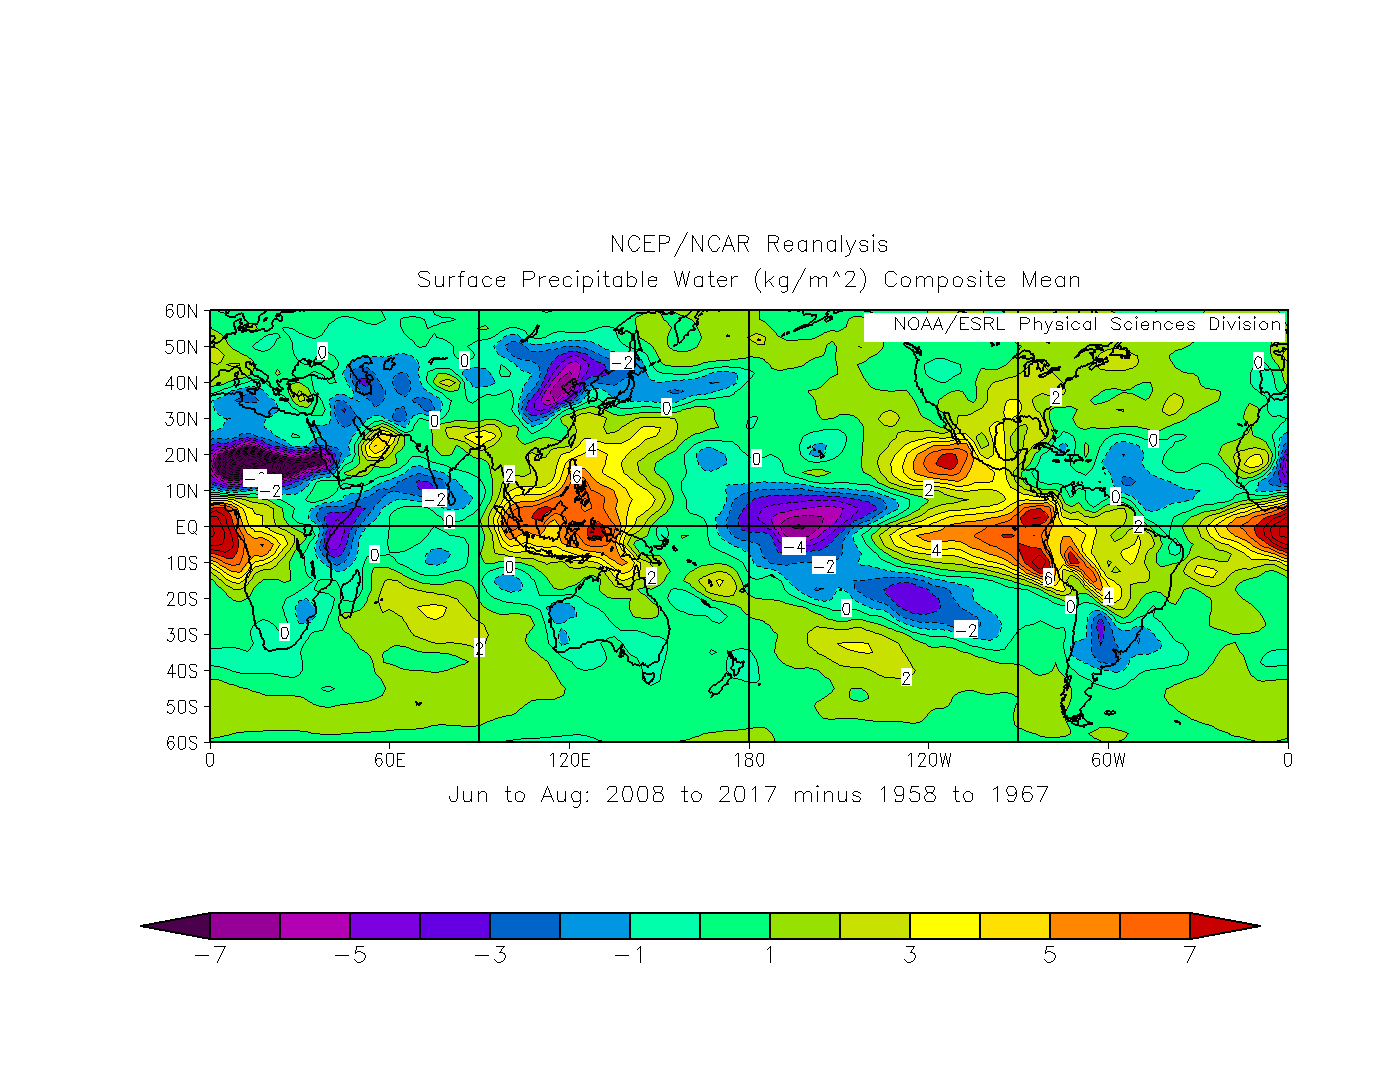
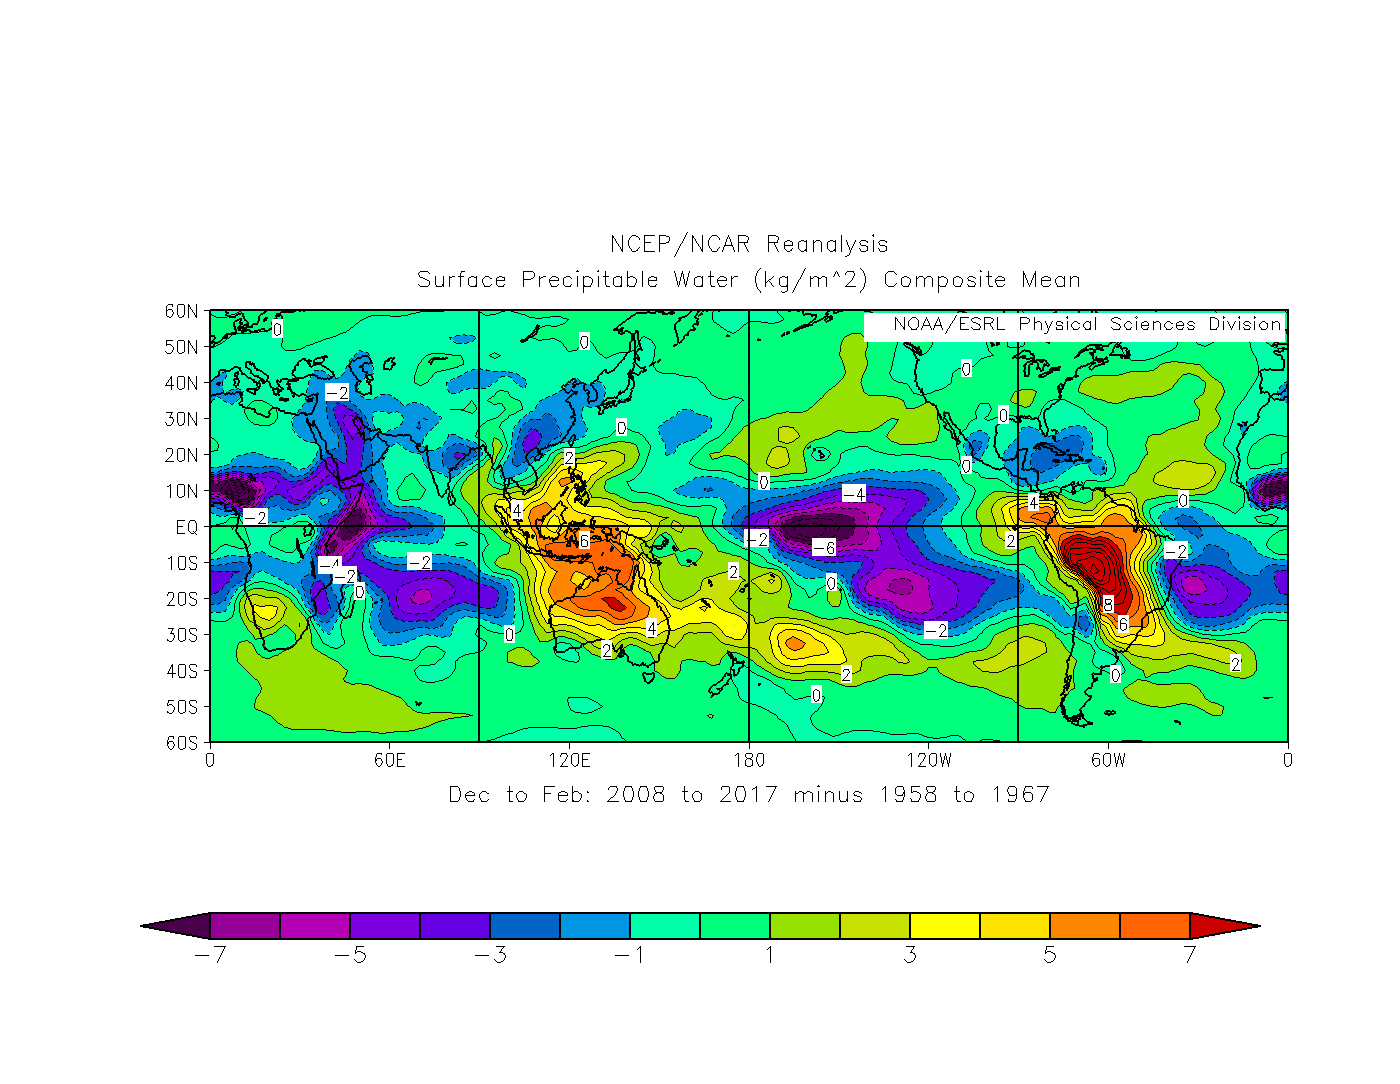
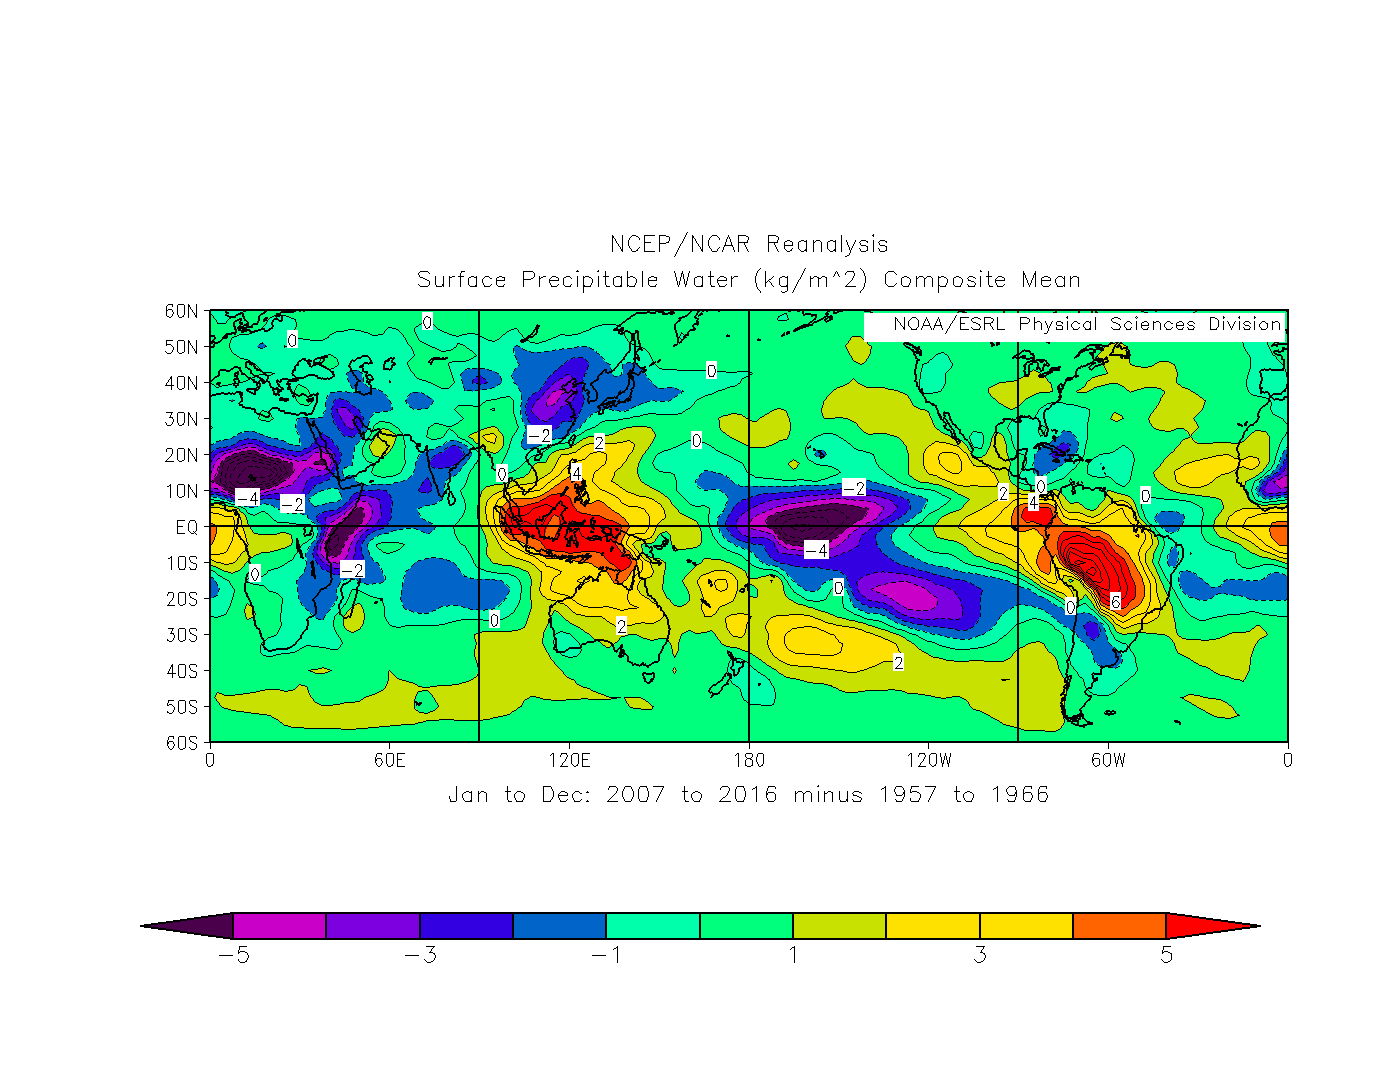
Precipitable Water Figures
| • PW DJF | • PW JJA |
| • PW (1957-1966) | |
| • PW (2007-2016) | |
| • PW JJA (2007-2016 minus 1957-1966) | |
| • PW DJF (2007-2016 minus 1957-1966) | |
| • PW_Annual (2007-2016 minus 1957-1966) |
Global Rainfall Maps from the Sustainable Development Department (SD) of the UN (1961-1990)
- Annual mean Rainfall
- January mean
- February mean
- March mean
- April mean
- May mean
- June mean
- July mean
- August mean
- September mean
- October mean
- November mean
- December mean
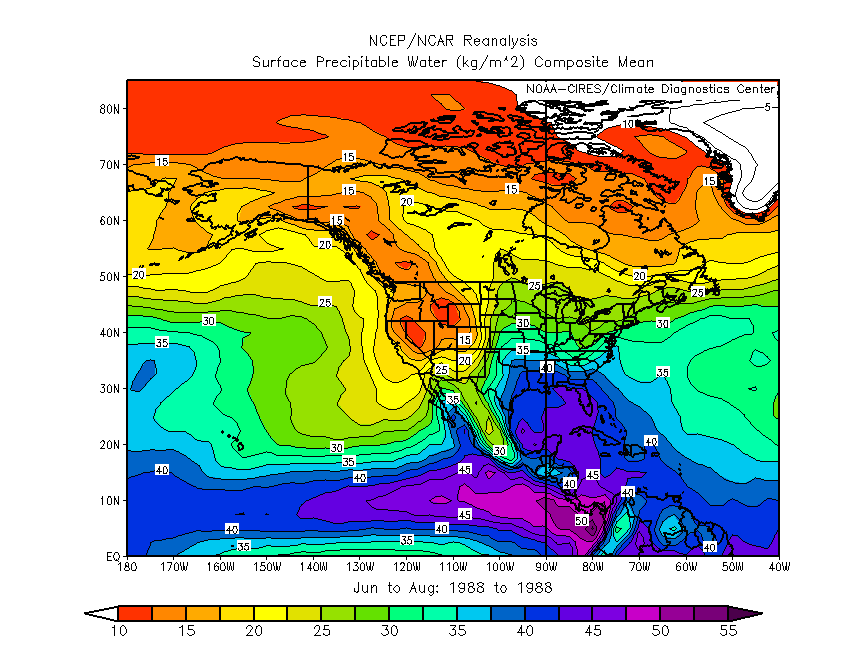
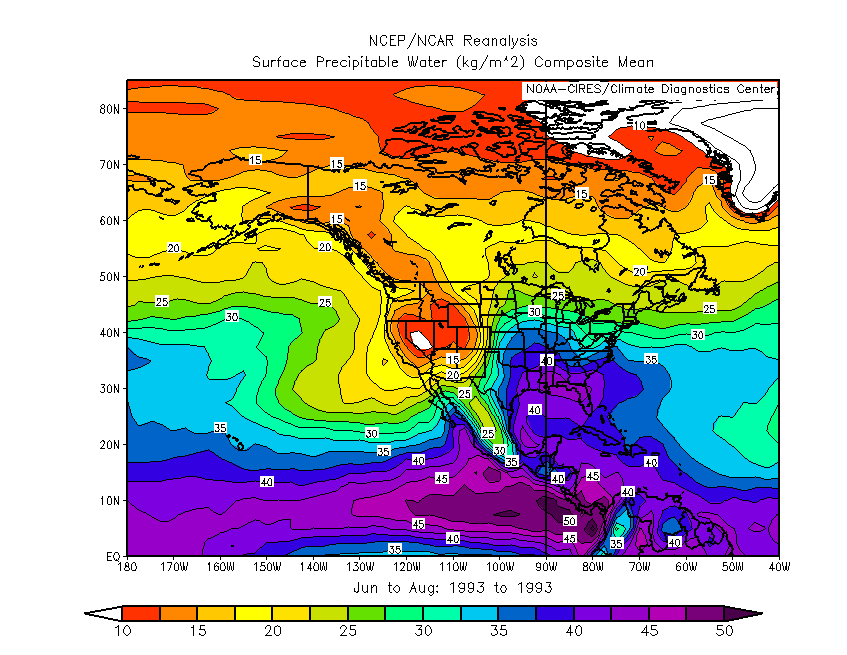
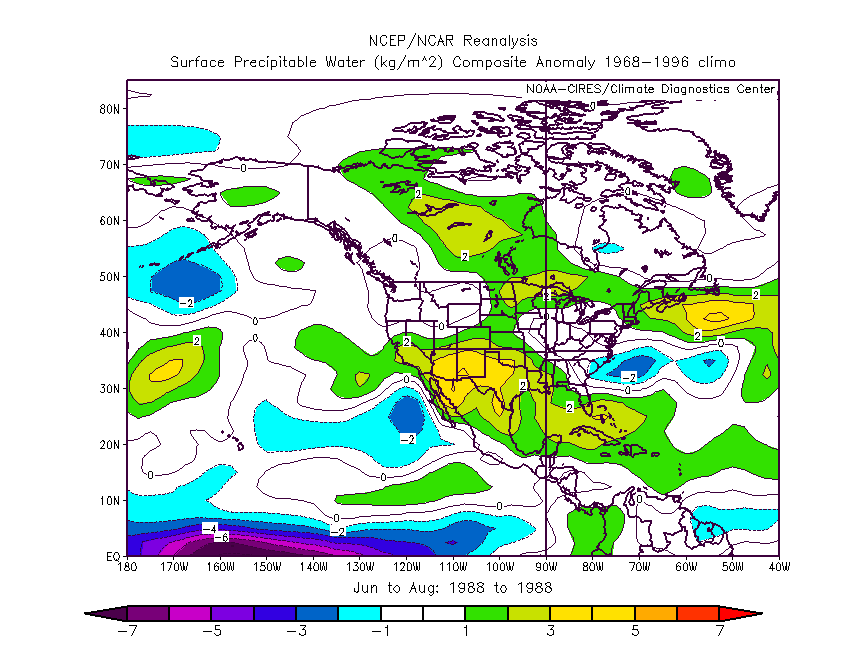
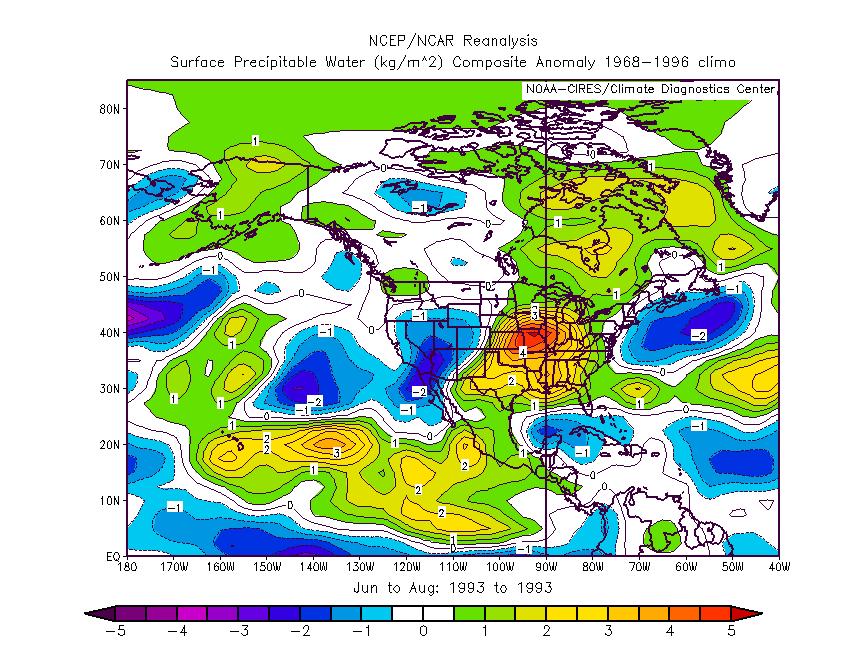
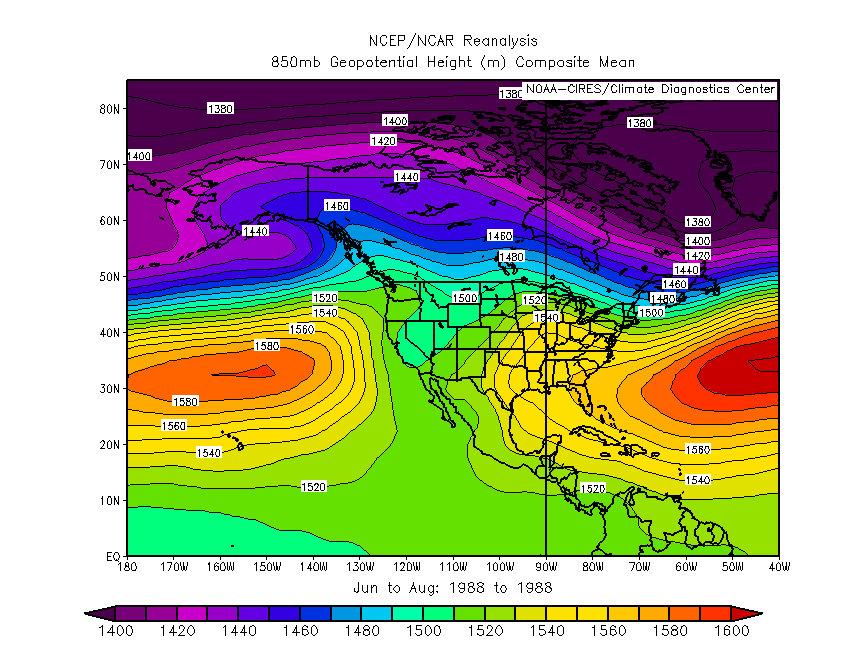
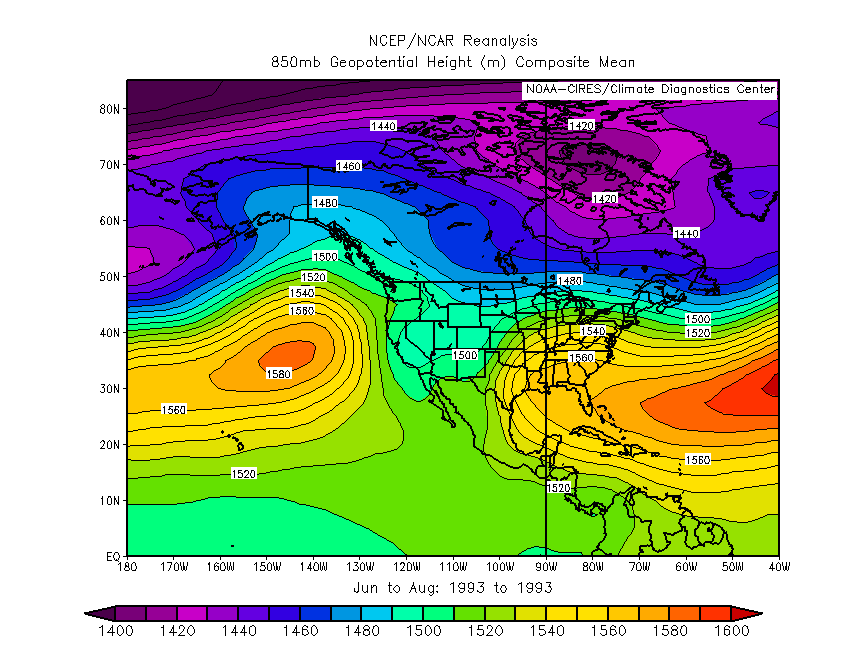
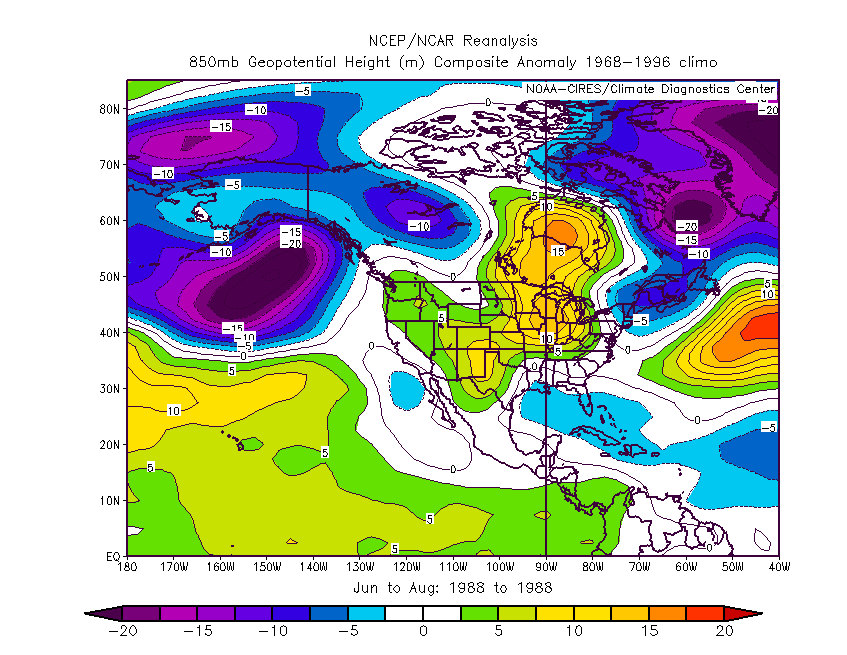
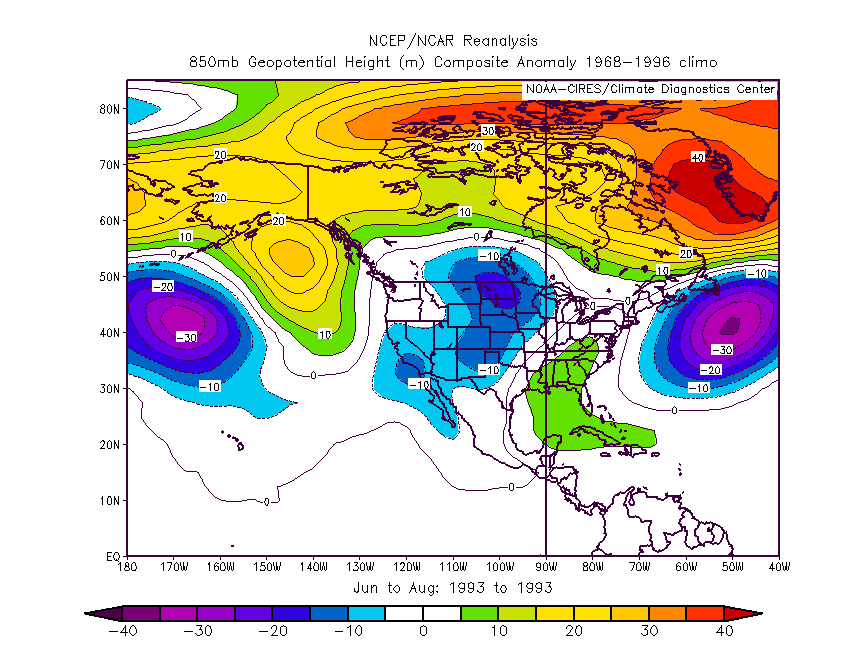
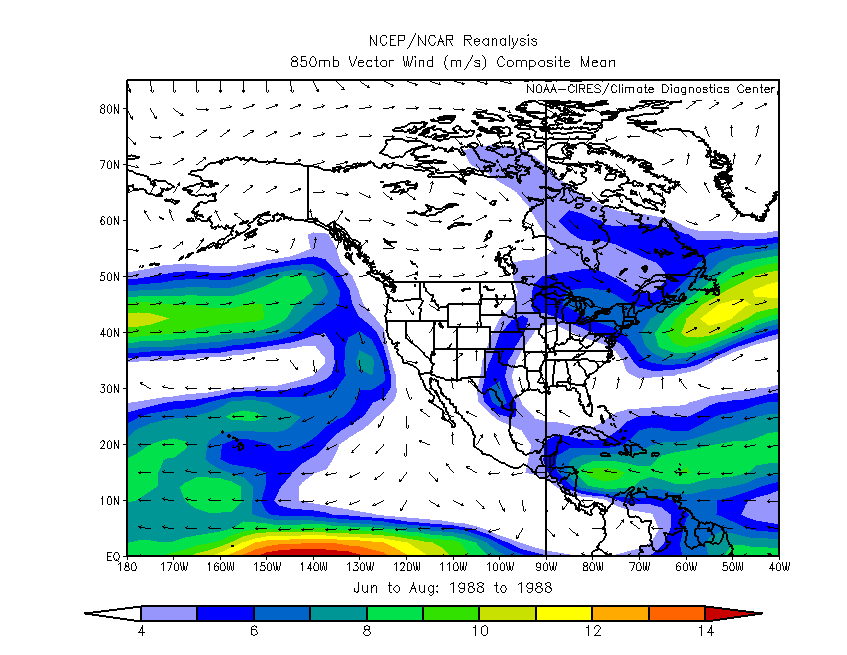
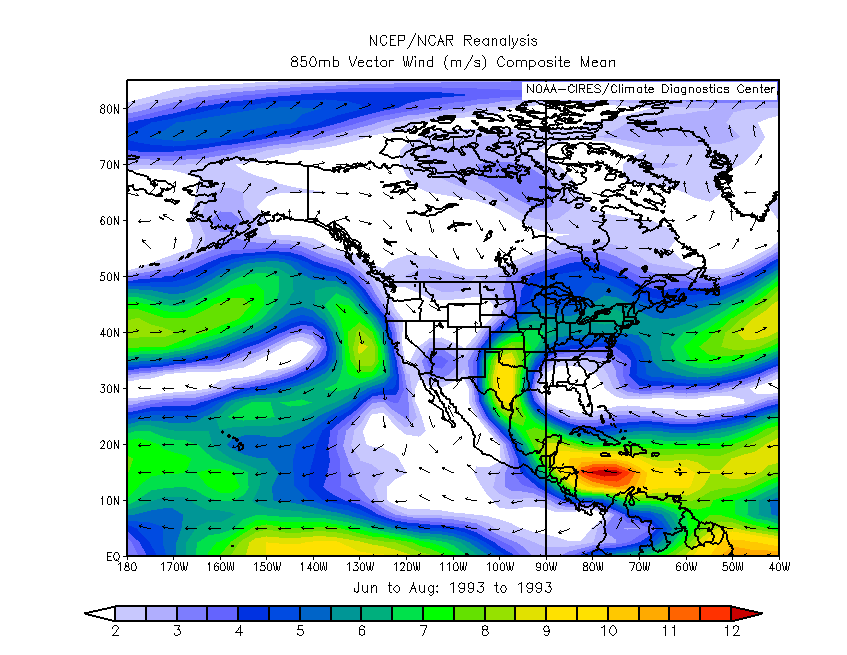
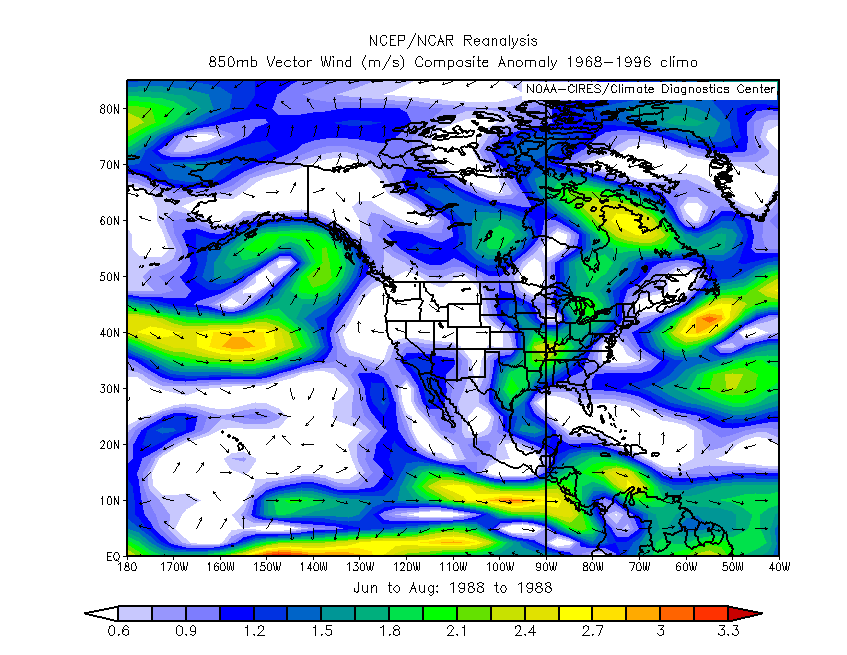
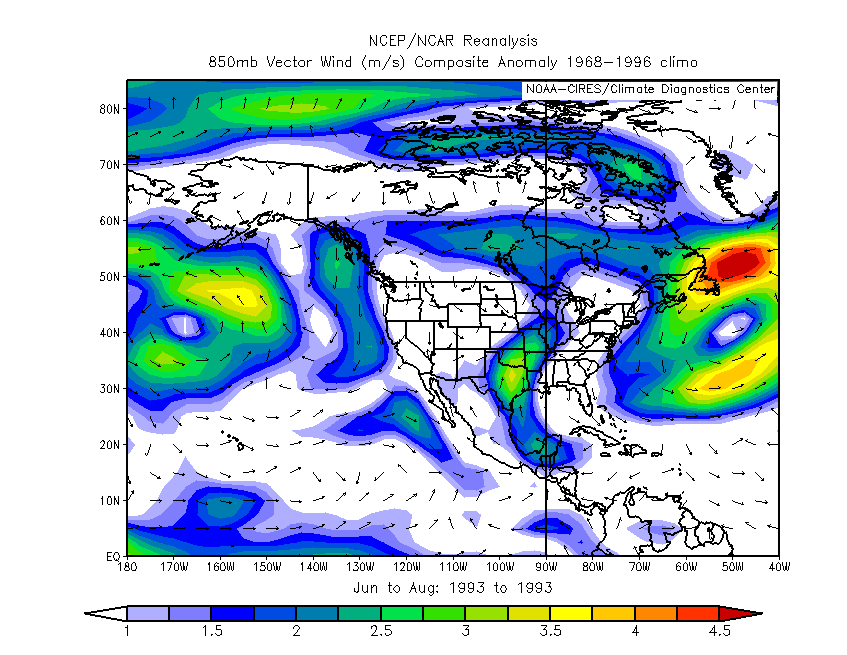
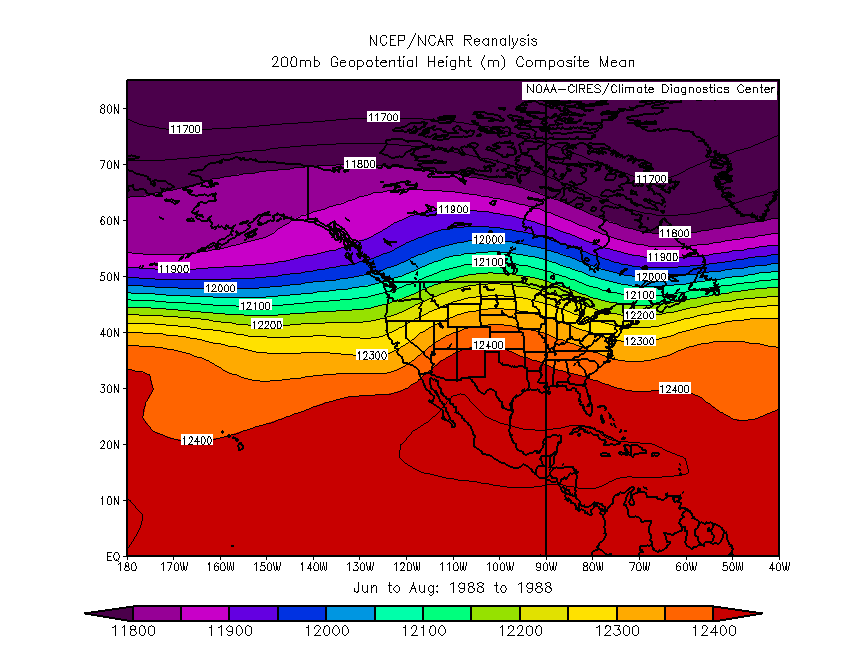
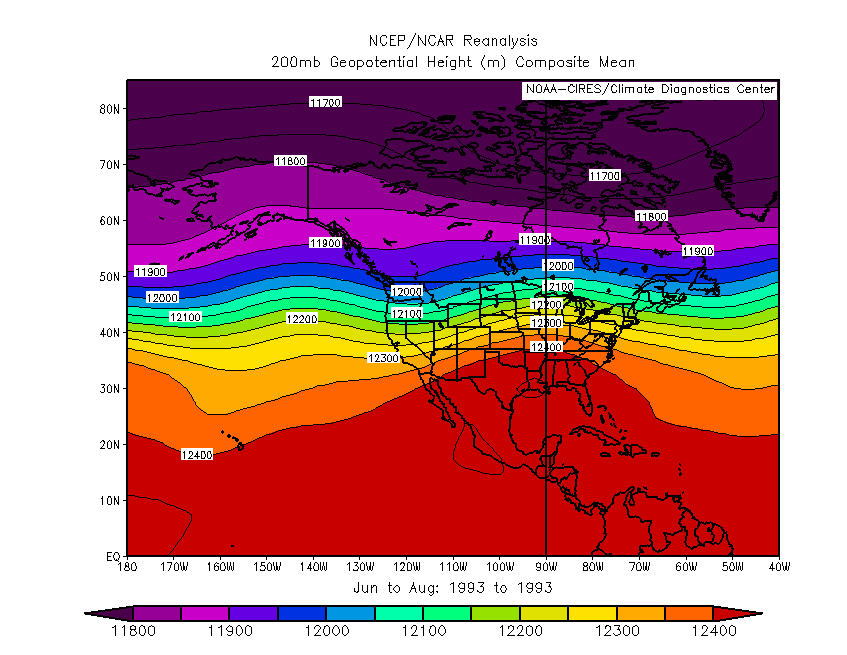
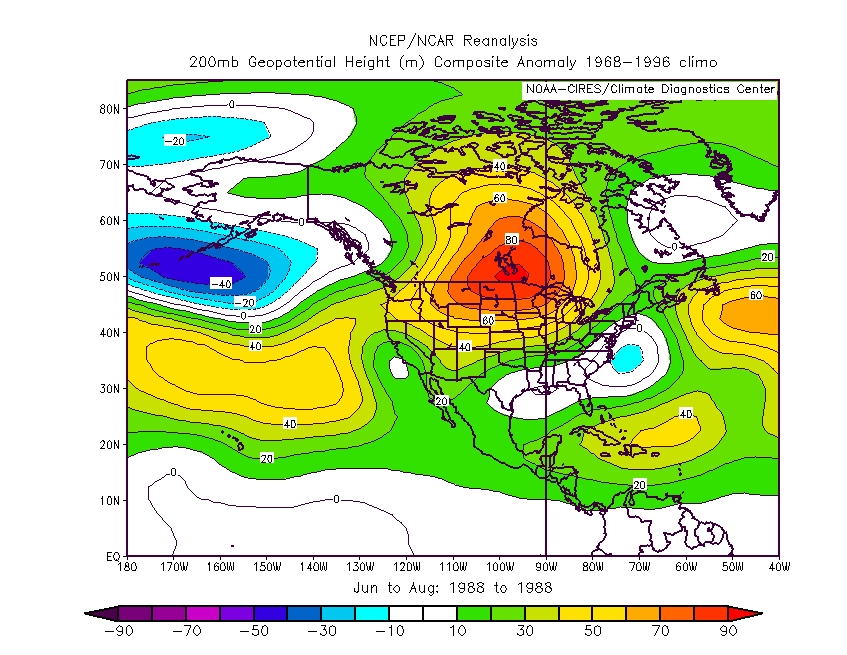
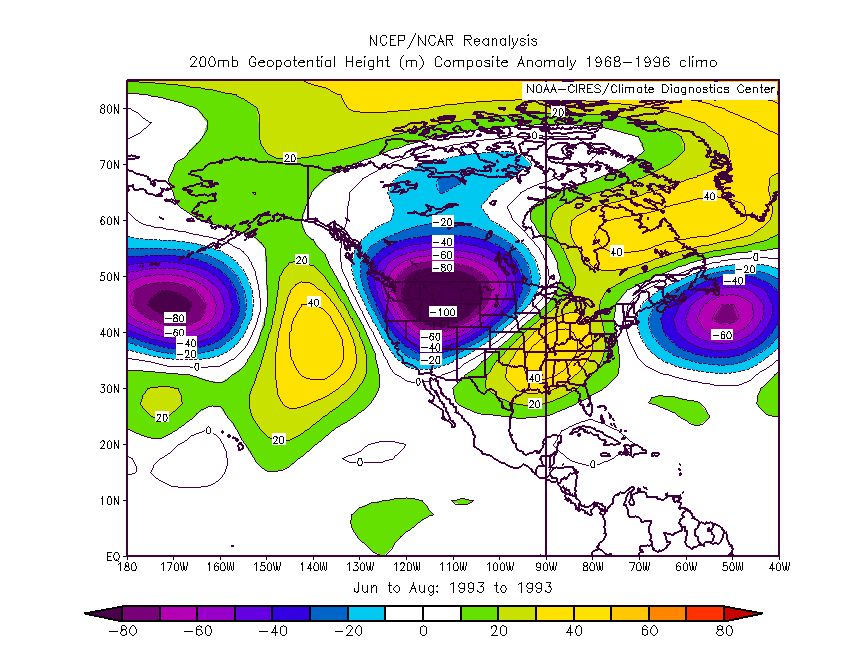
Drought (1988) vs. Wet Year (1993) Over the High Plains
Drought (1976) vs. Wet Year (2007) Over the United Kingdom
- 1976 500 hPa mean heights
- 2007 500 hPa mean heights
- 1976 500 hPa height anomaly
- 2007 500 hPa height anomaly
- 1976 850 hPa temperature anomaly
- 2007 850 hPa temperature anomaly
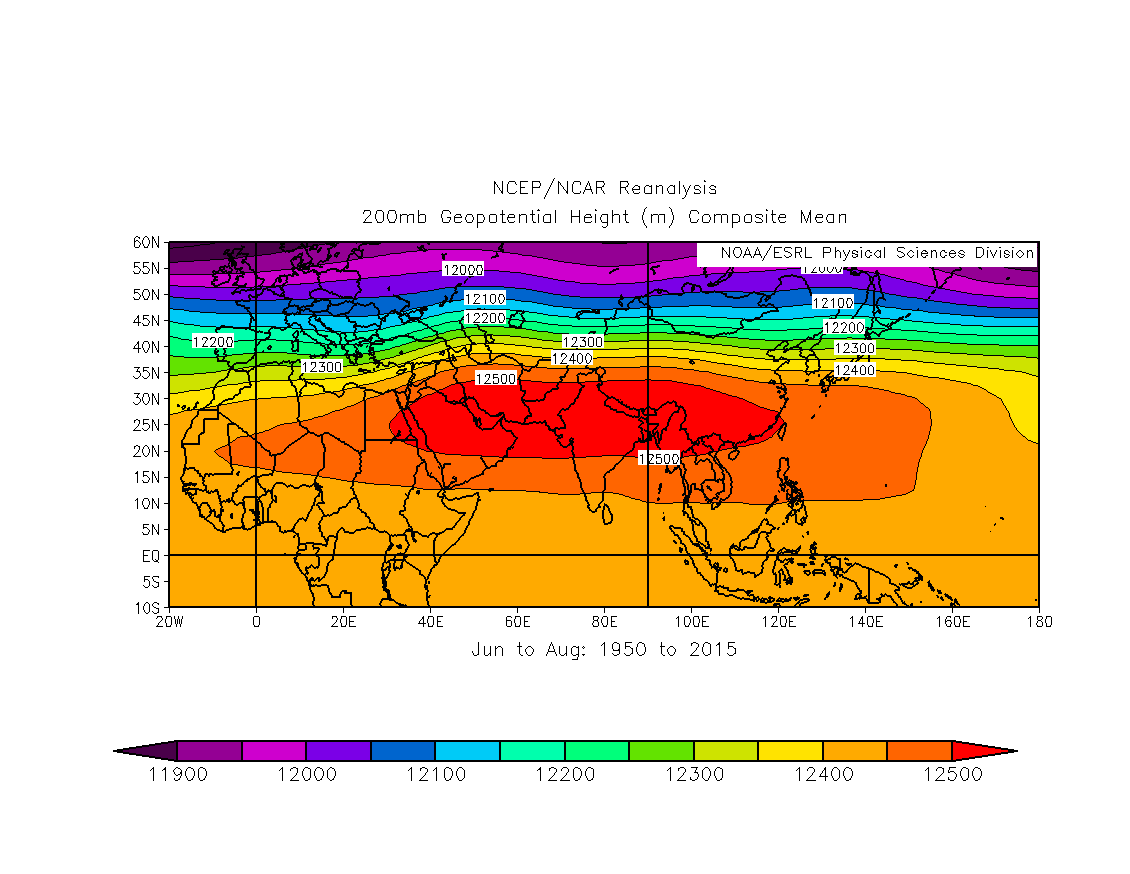
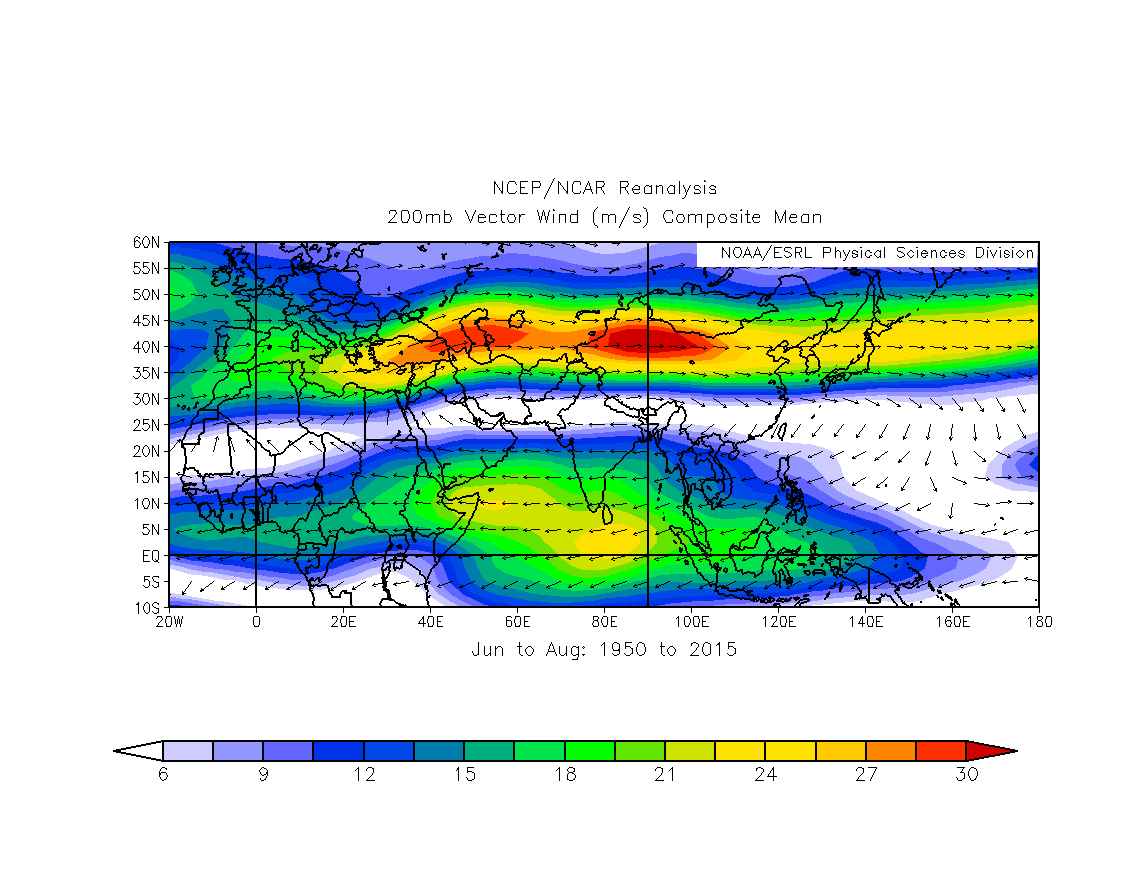
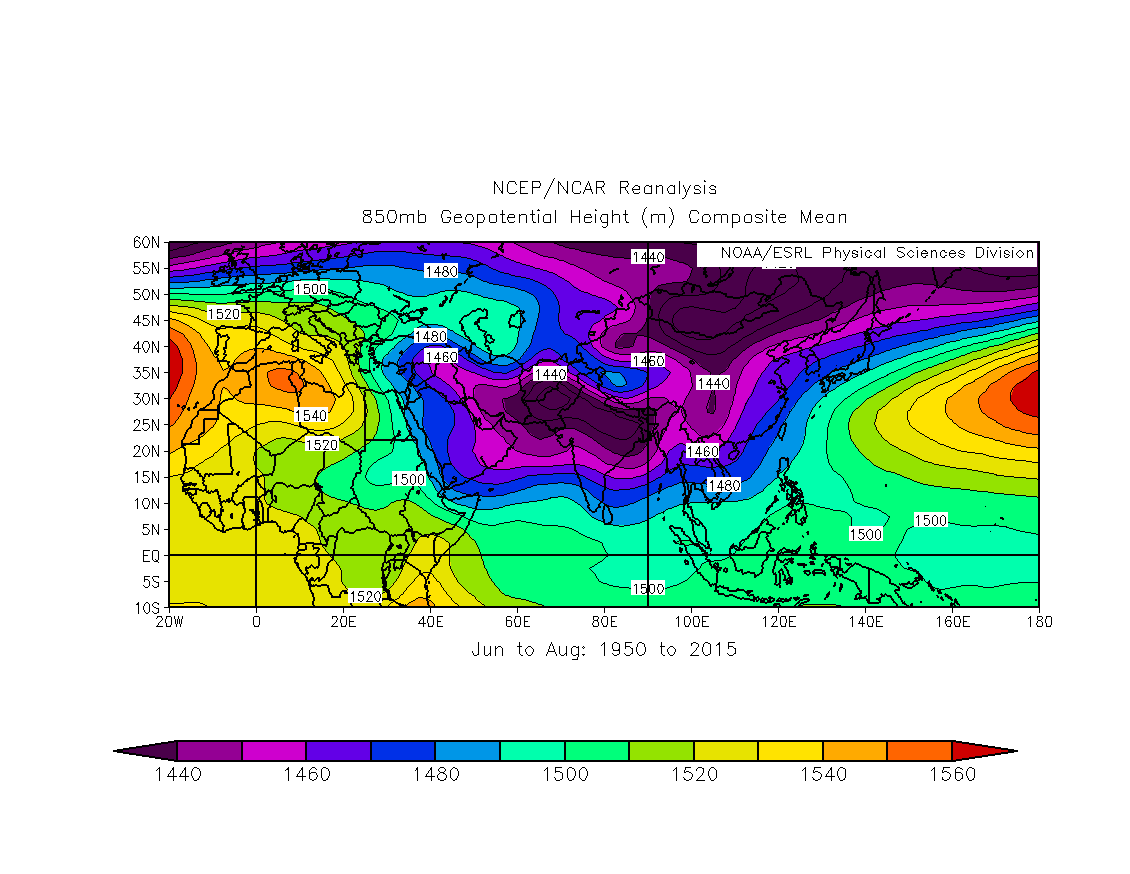
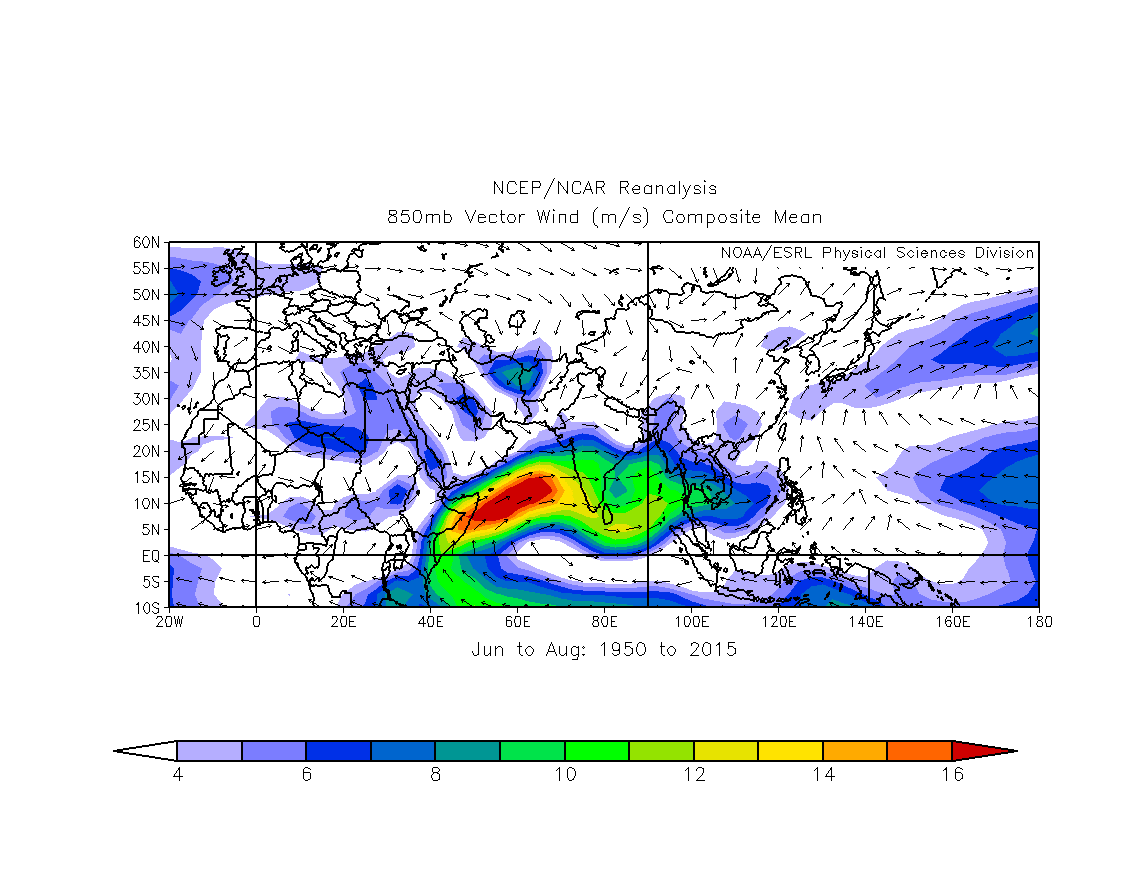
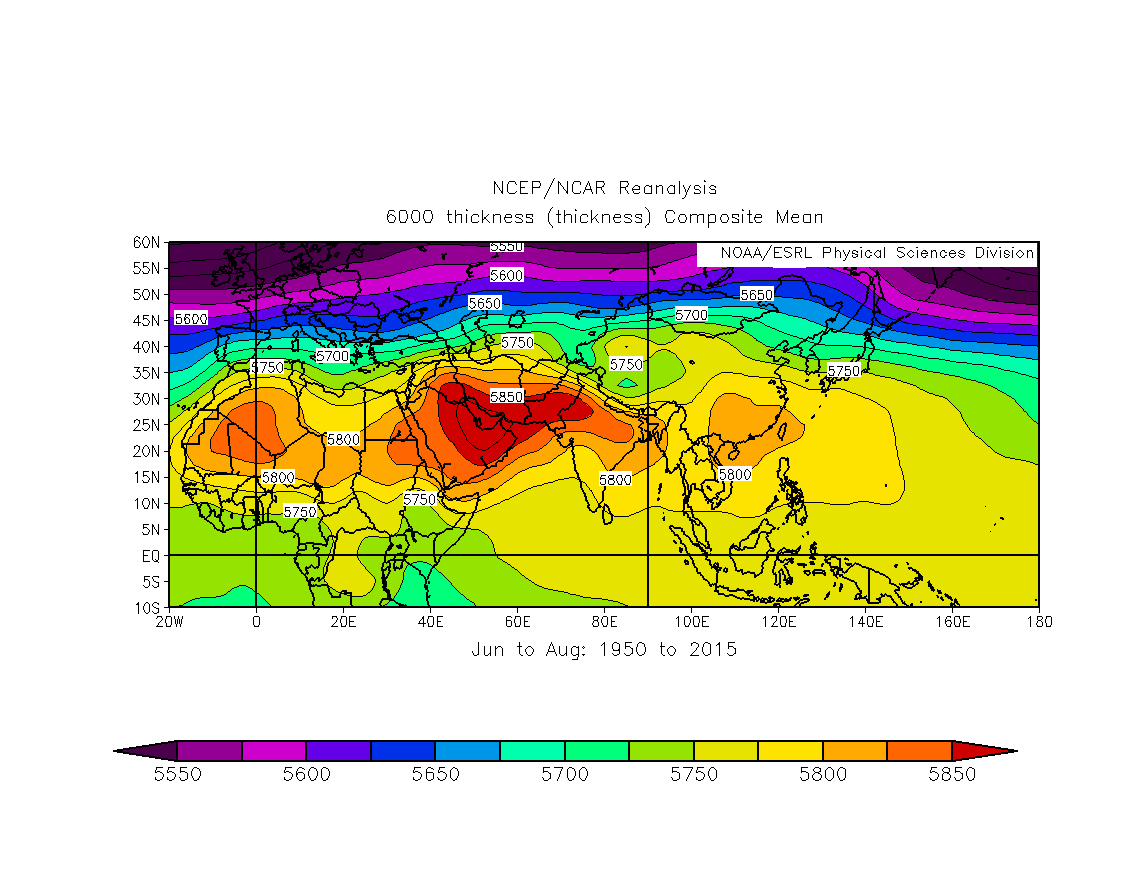
Asiatic Summer (JJA) Monsoon (1950-2015)
- 200 hPa mean heights (m)
- 200 hPa mean vector wind (m/s)
- 850 hPa mean heights (m)
- 850 hPa mean zonal wind (m/s)
- 1000-500 hPa mean thickness (m)
Record Heat in AZ/NM/OK 27-29 June 1994
Midwest Record Heat 14-15 July 1954
Midwest Record Cold 1-5 February 1996
Record Alaskan Cold 16-29 December 1961
Record Western US Cold January 1949
Record Central/Eastern US Cold January 1977
Superstorm 13-14 March 1993
La Reunion World Record Rains
- Topography
- 21-27 January 1980: TC Hyacinthe
- 24-28 February 2007: TC Gamede
Super Outbreak 3 April 1974
- 500 hPa mean heights
- 500 hPa height anomaly
- 850 hPa mean temperature
- 850 hPa temperature anomaly
- 300 hPa vector (total) wind
- 300 hPa meridional wind anomaly
- 850 hPa mean meridional wind
- 850 hPa meridional wind anomaly
- Mean PW
- Anomaly PW
CA Fires of 22-23 October 2007
| Mean SLP | ||||
| • 20 October | • 21 October | • 22 October | • 23 October | • 24 October |
| 850 hPa temperature | ||||
| • 22 October | • 23 October | |||
| 850 hPa temperature anomaly | ||||
| • 22 October | • 23 October | |||
| 850 hPa vector wind | ||||
| • 22 October | ||||
| 850 hPa vector wind anomaly | ||||
| • 22 October |
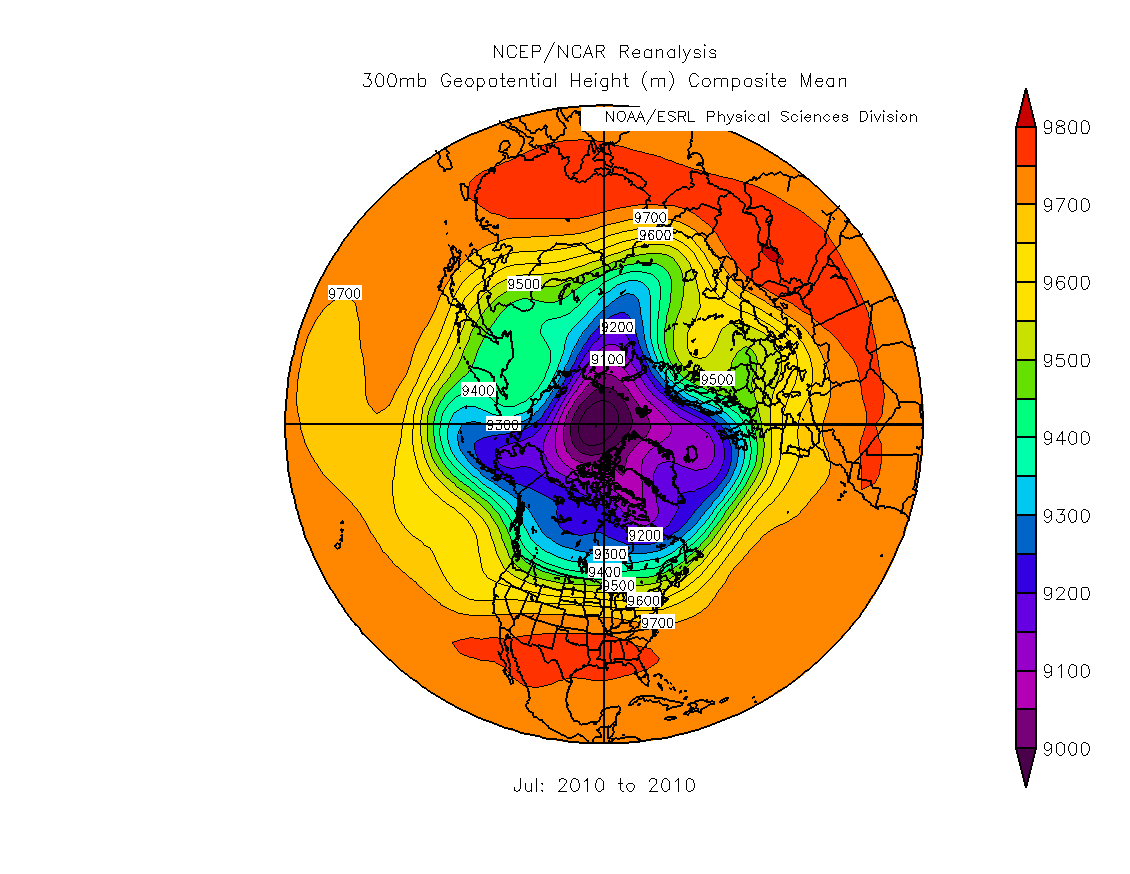
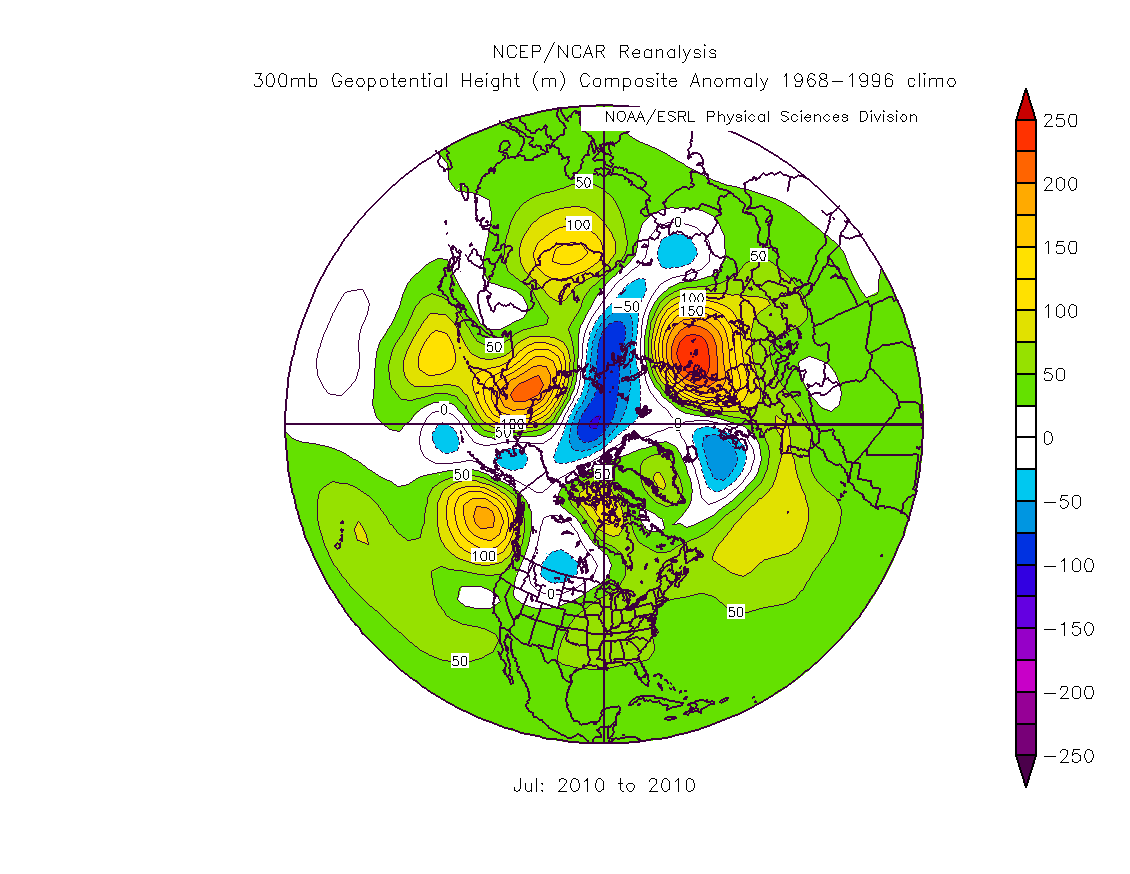
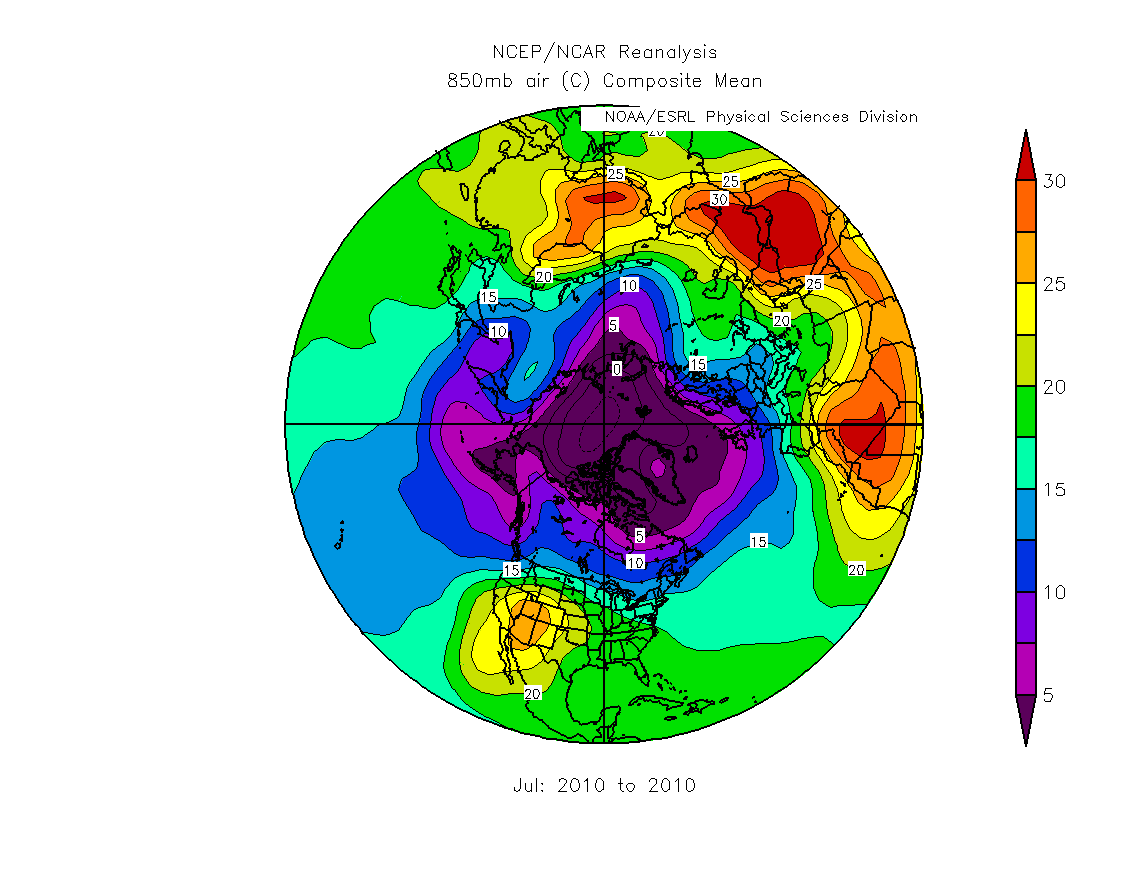
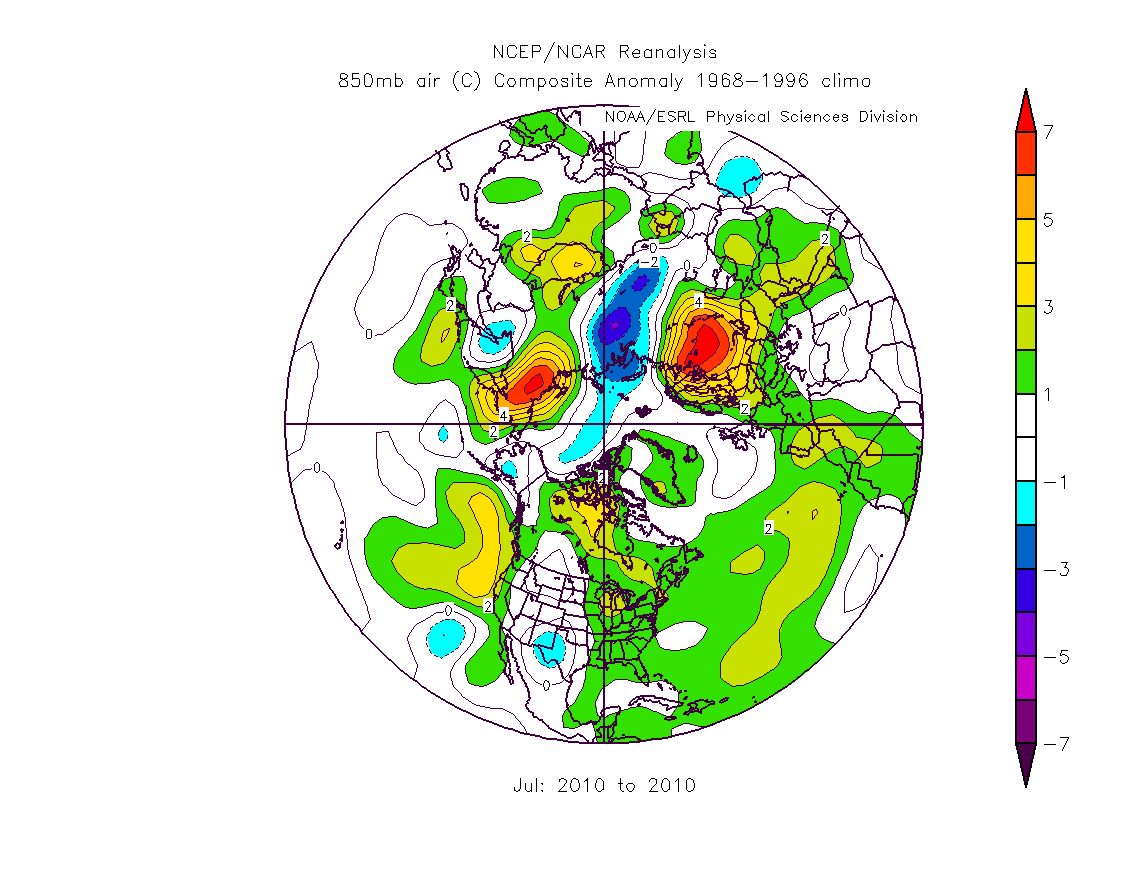
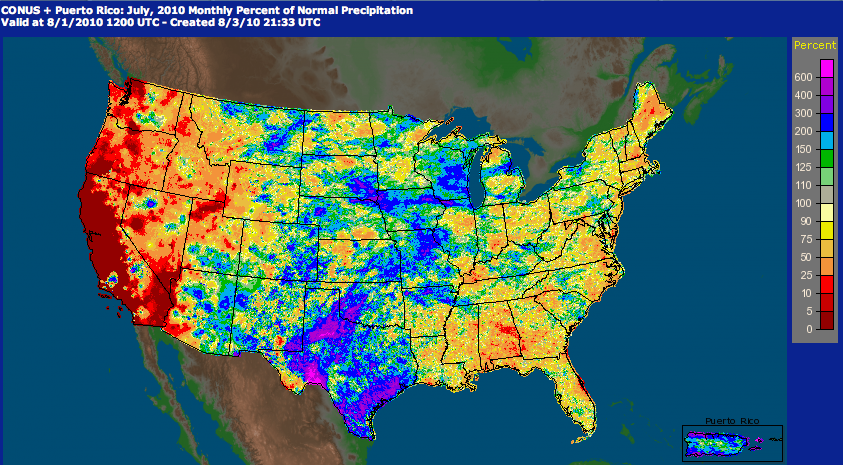
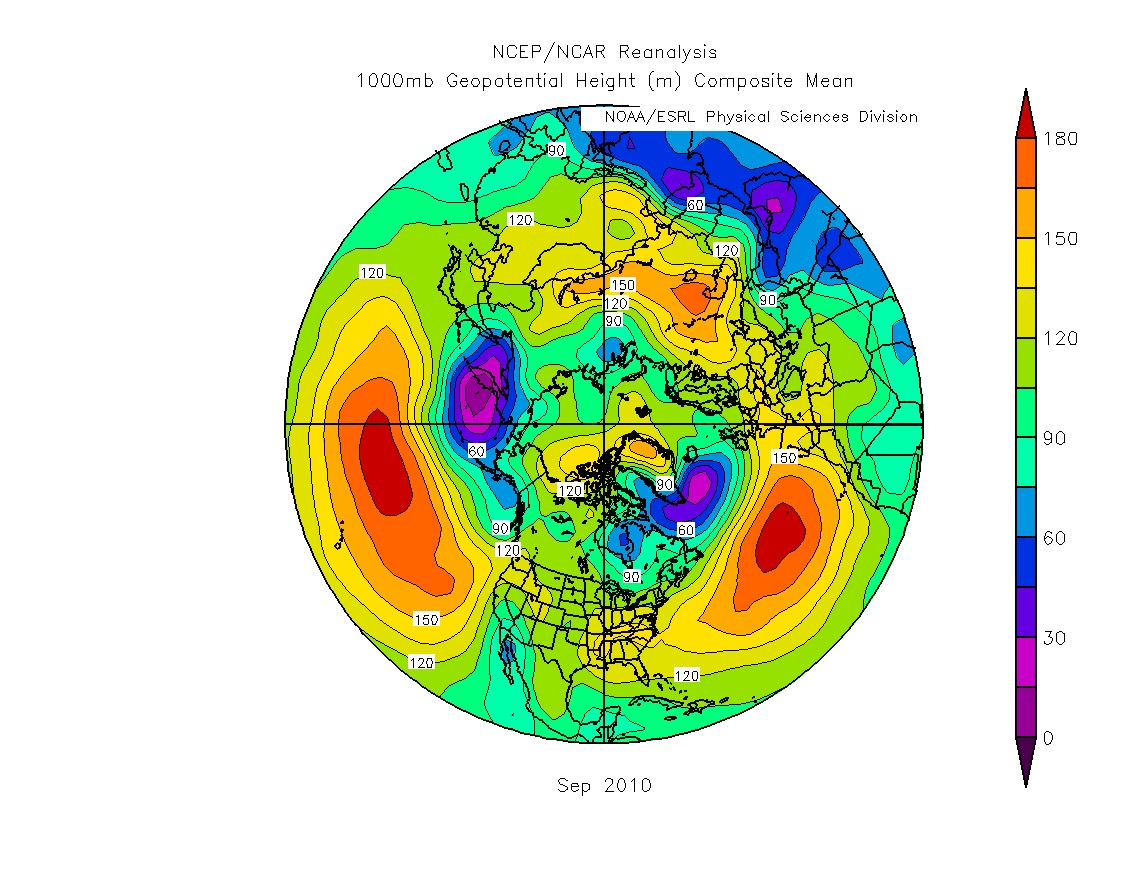
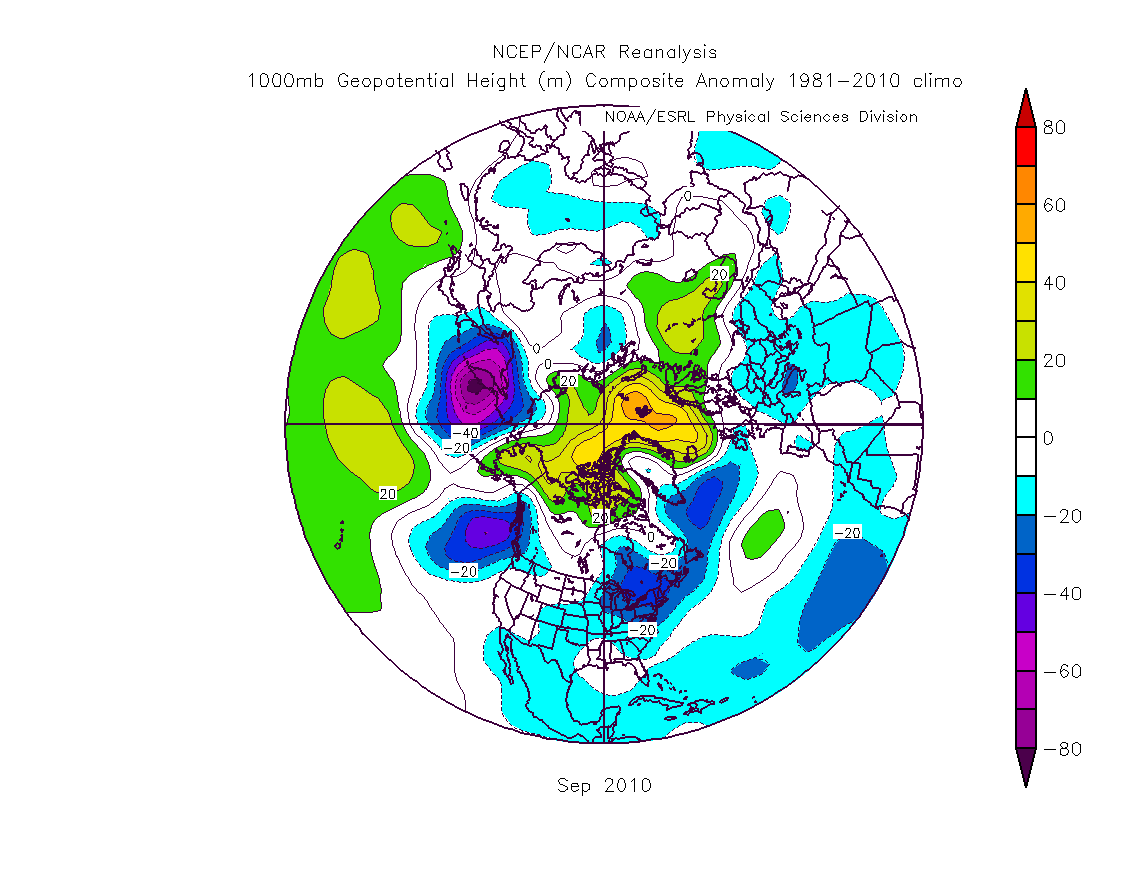
NH July 2010 Circulation and Pakistan Floods
| NH: July 2010 | |
| • 300 hPa Heights | • 300 hPa Height Anomalies |
| • 850 hPa Temperatures | • 850 hPa Temperature Anomalies |
| U.S. July 2010 Precipitation | |
| • U.S. Conus Monthly Percent of Normal Precip | |
| Pakistan: 24-31 July 2010 | |
| • 200 hPa Vector Wind | • 200 hPa Vector Wind Anomaly |
| • 850 hPa Vector Wind | • 850 hPa Vector Wind Anomaly |
| • 200 hPa Heights | • 200 hPa Height Anomalies |
| • 850 hPa Heights | • 850 hPa Height Anomales |
| • 300 hPa Temperatures | • 300 hPa Temperature Anomalies |
| • 500 hPa Temperatures | • 700 hPa Temperatures |
| • OLR | • OLR Anomalies |
| • PWAT | • PWAT Anomalies |
| Pakistan: 14-21 July 2011 | |
| • 850 hPa Heights | • 850 hPa Height Anomalies |
| • 300 hPa Temperatures | • 300 hPa Temperature Anomalies |
Summer (JJA) 2011
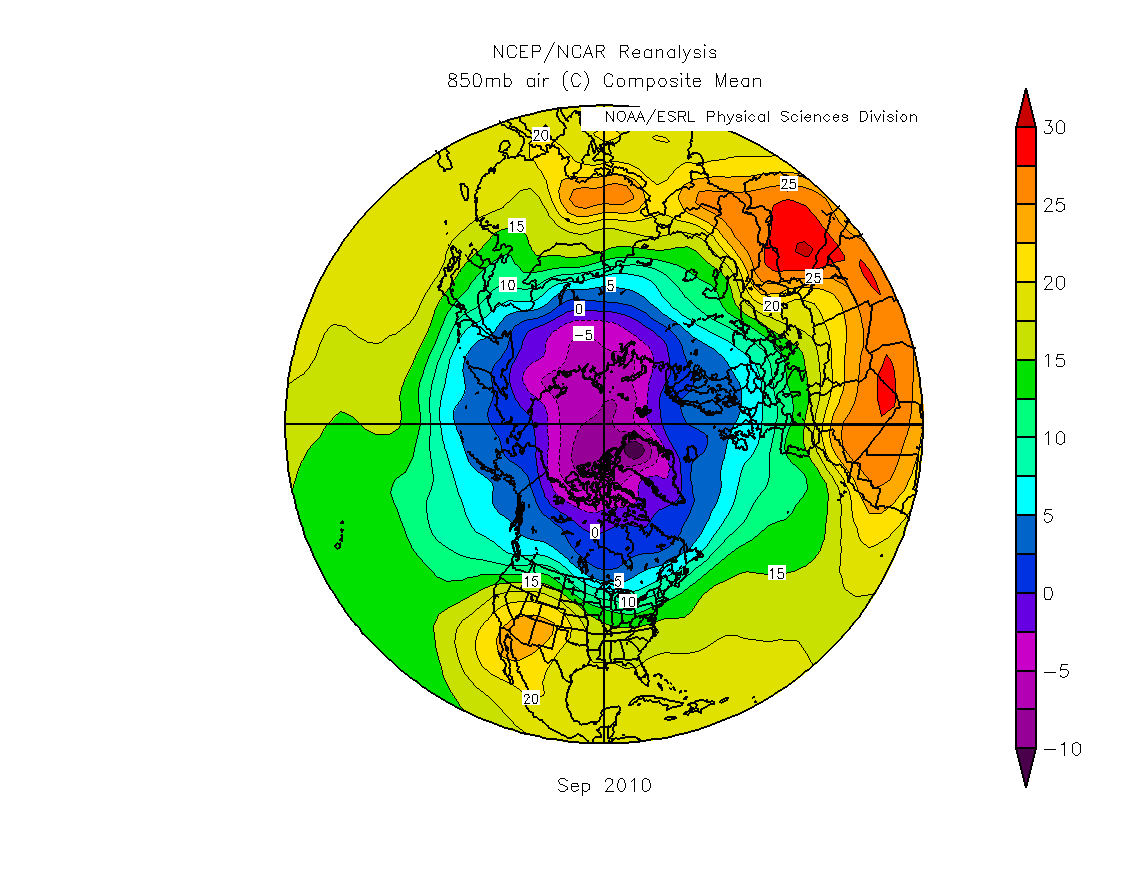
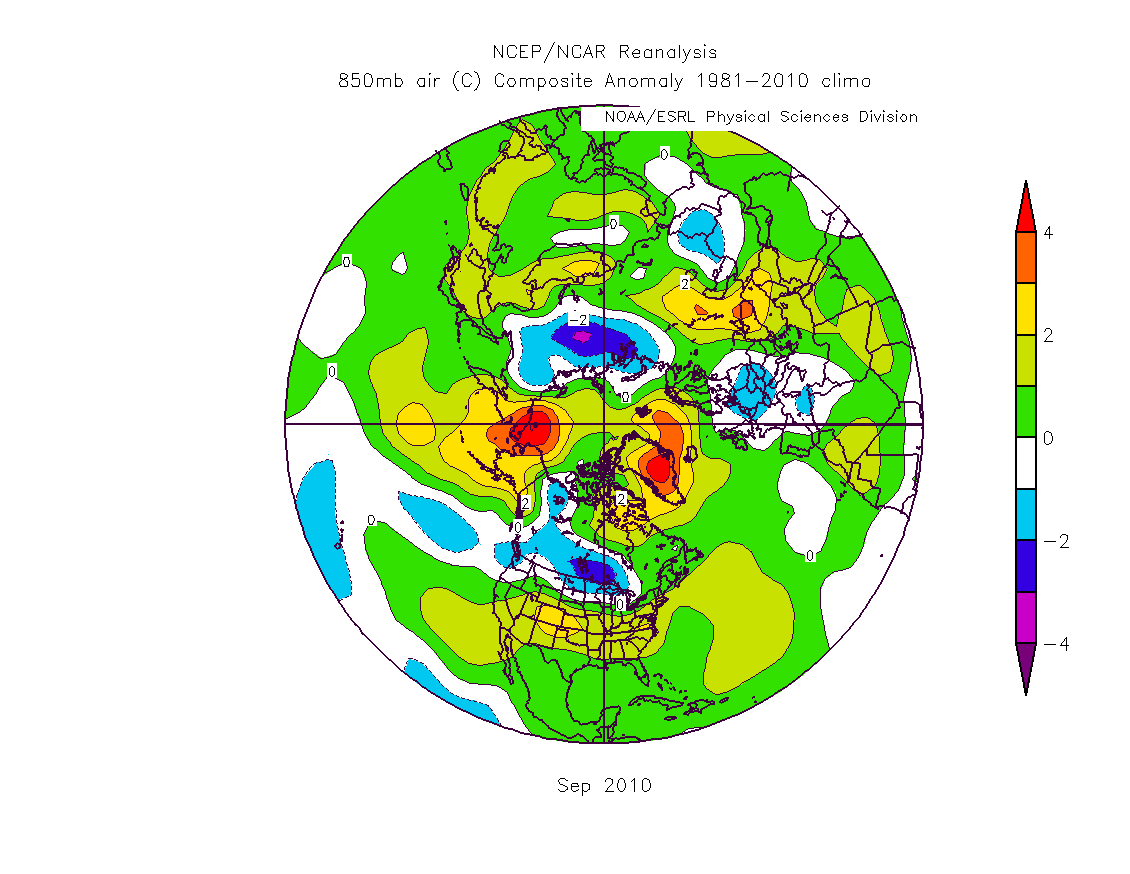
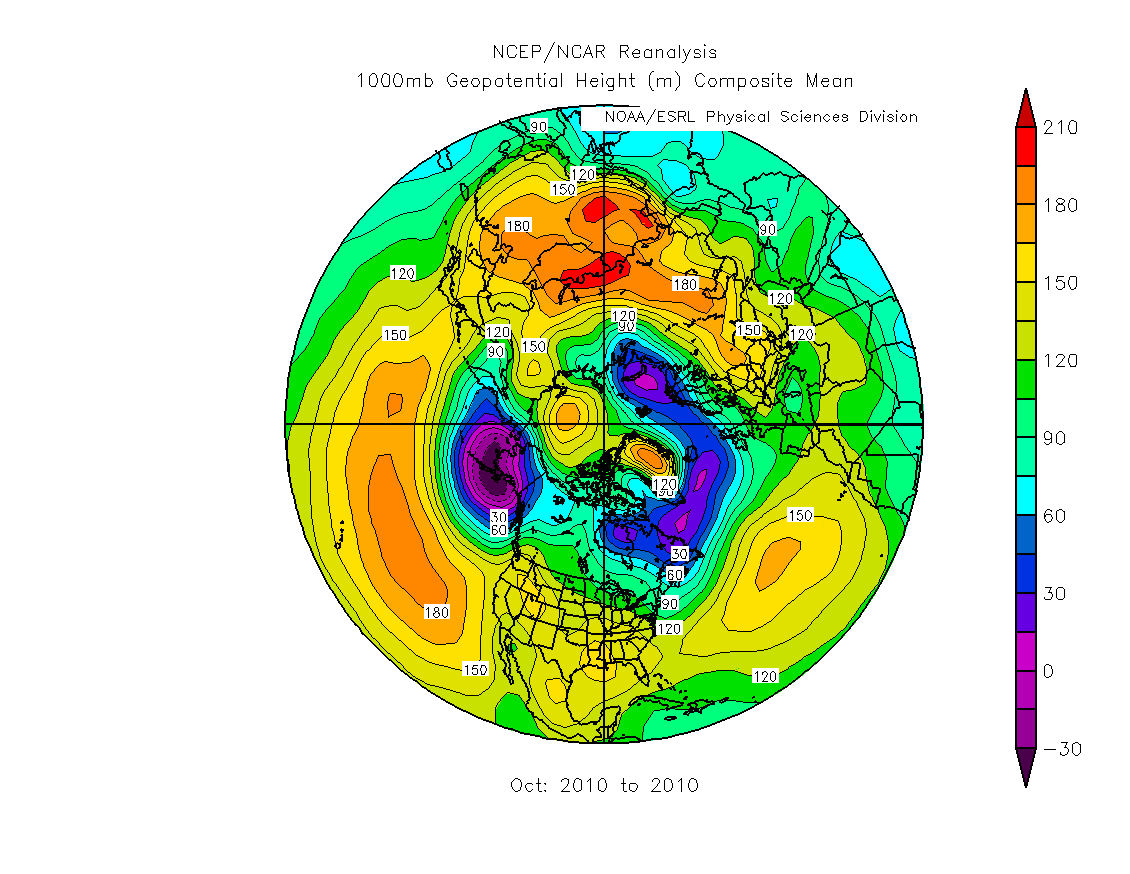
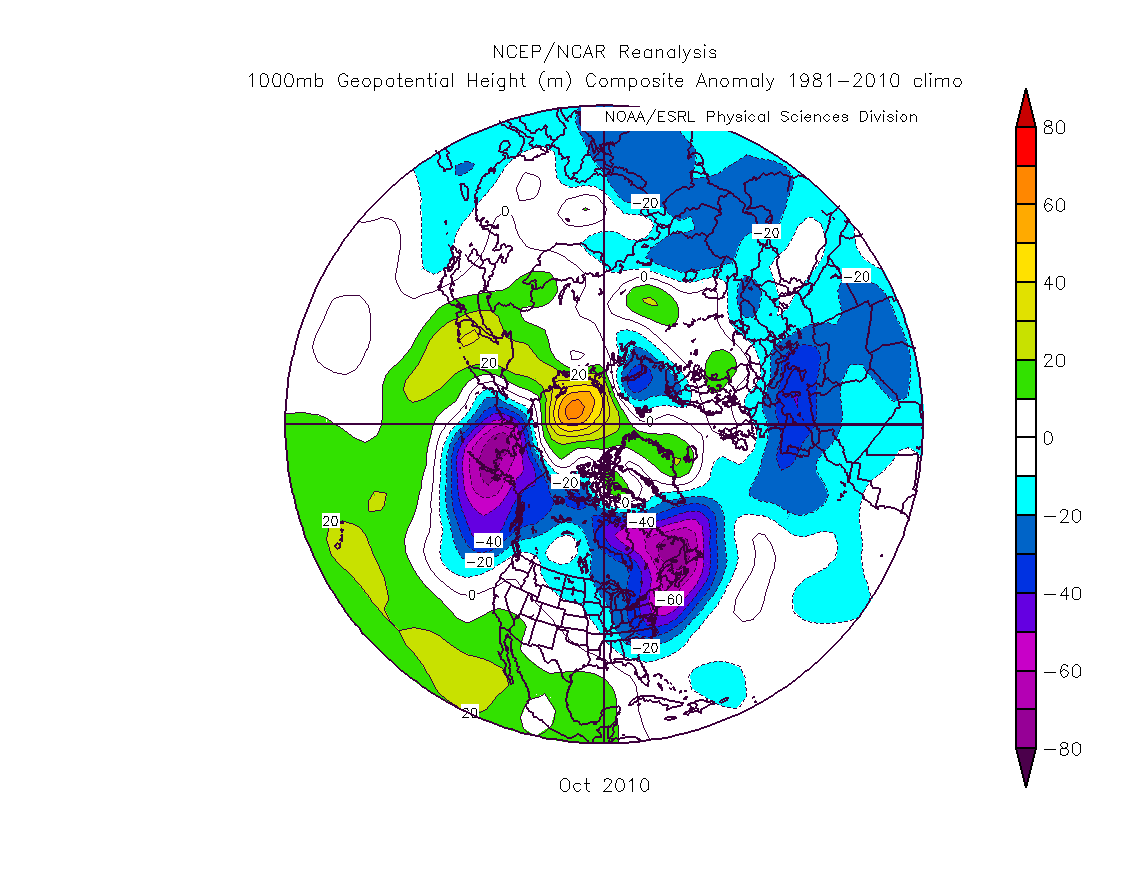
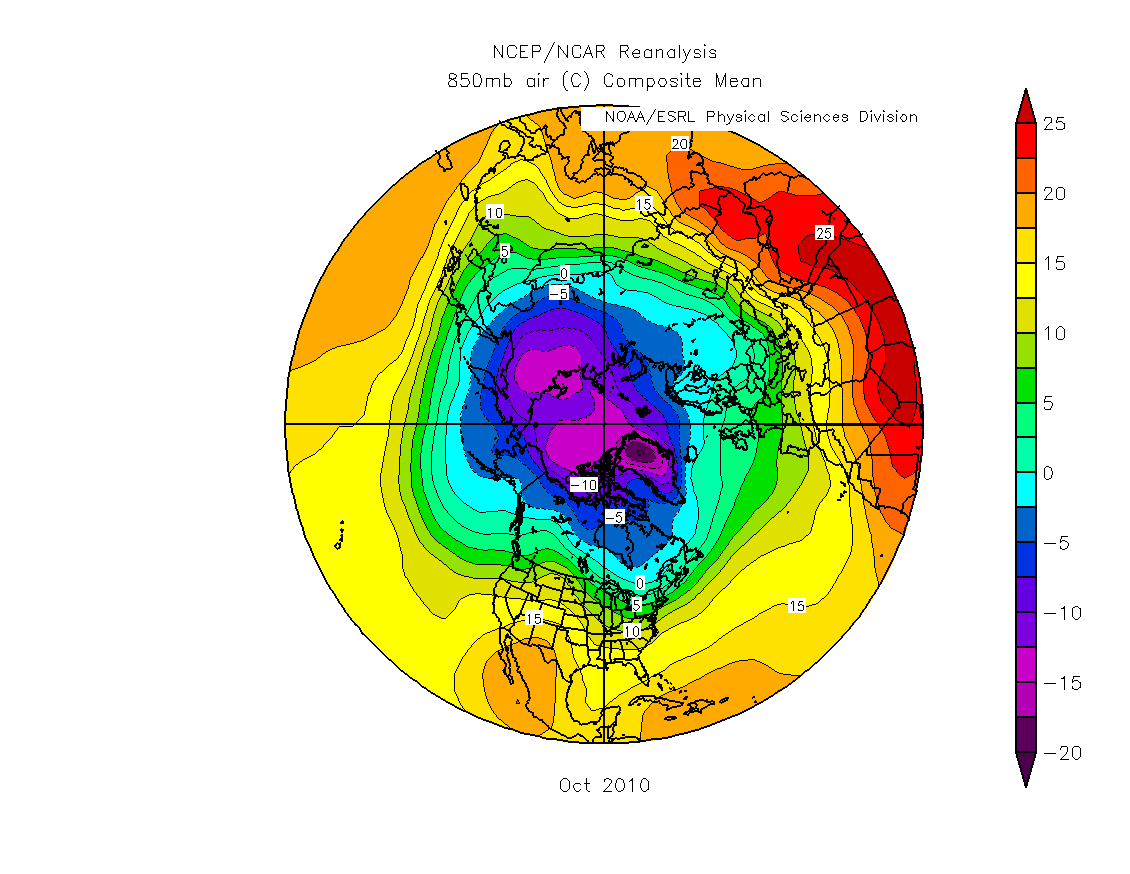
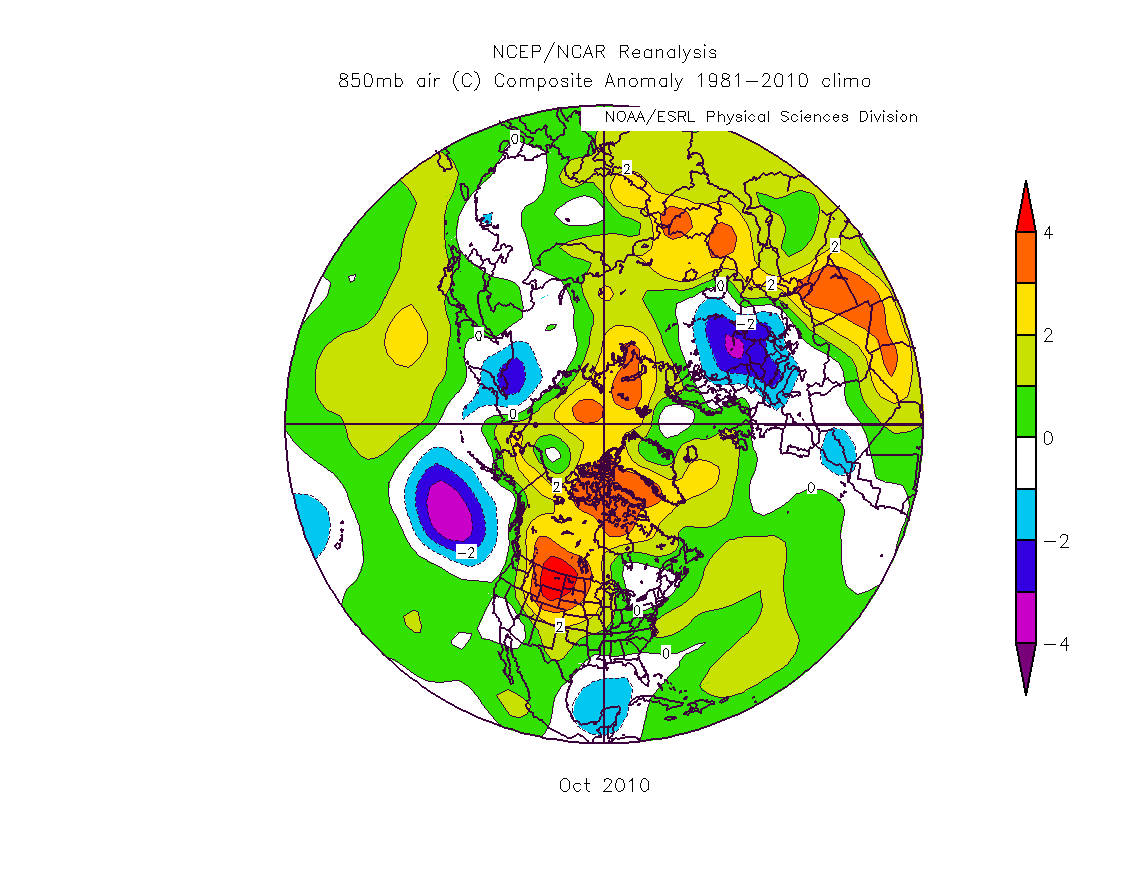
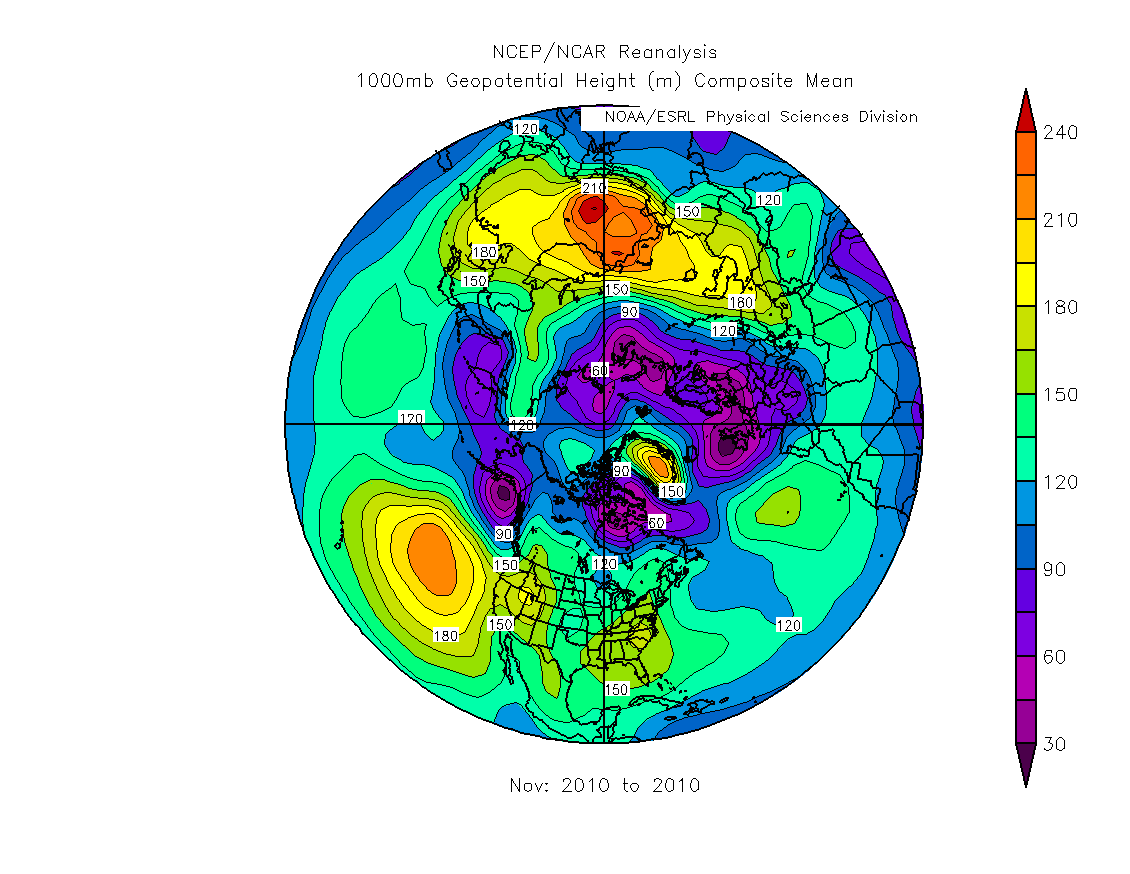
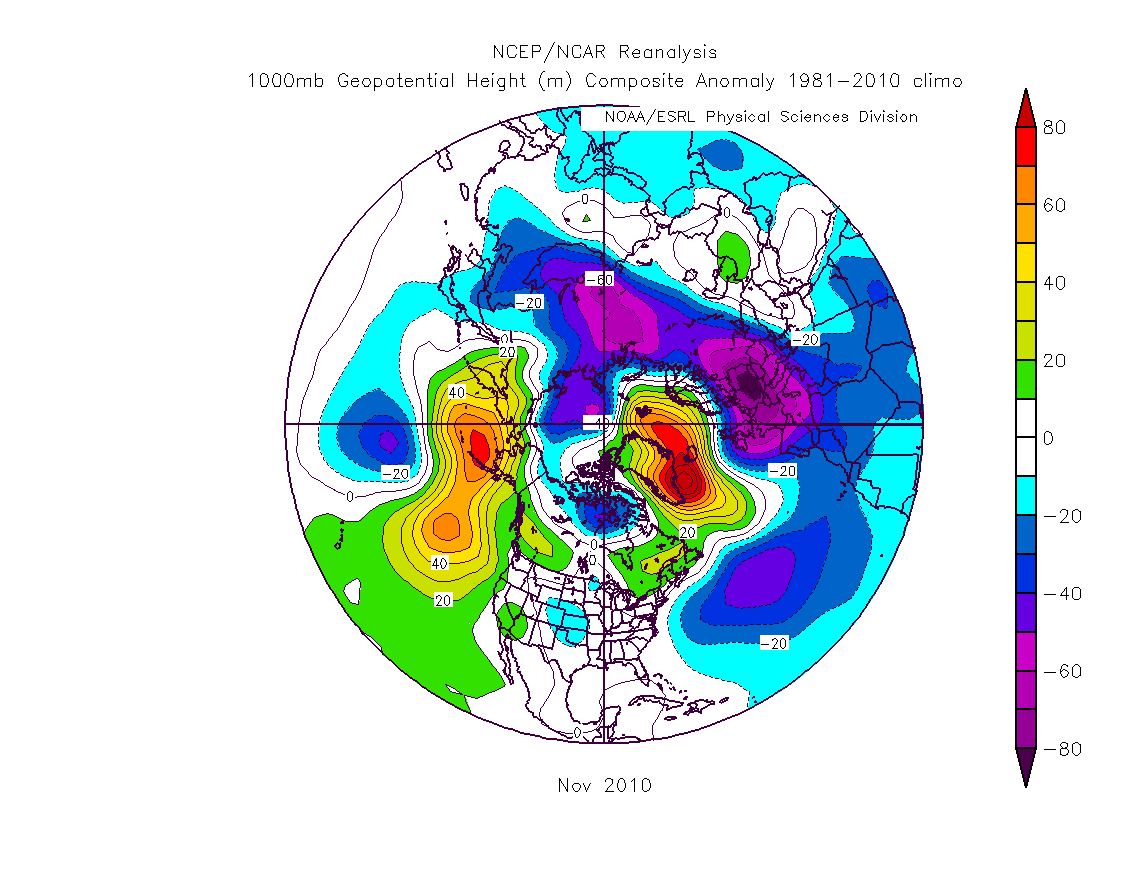
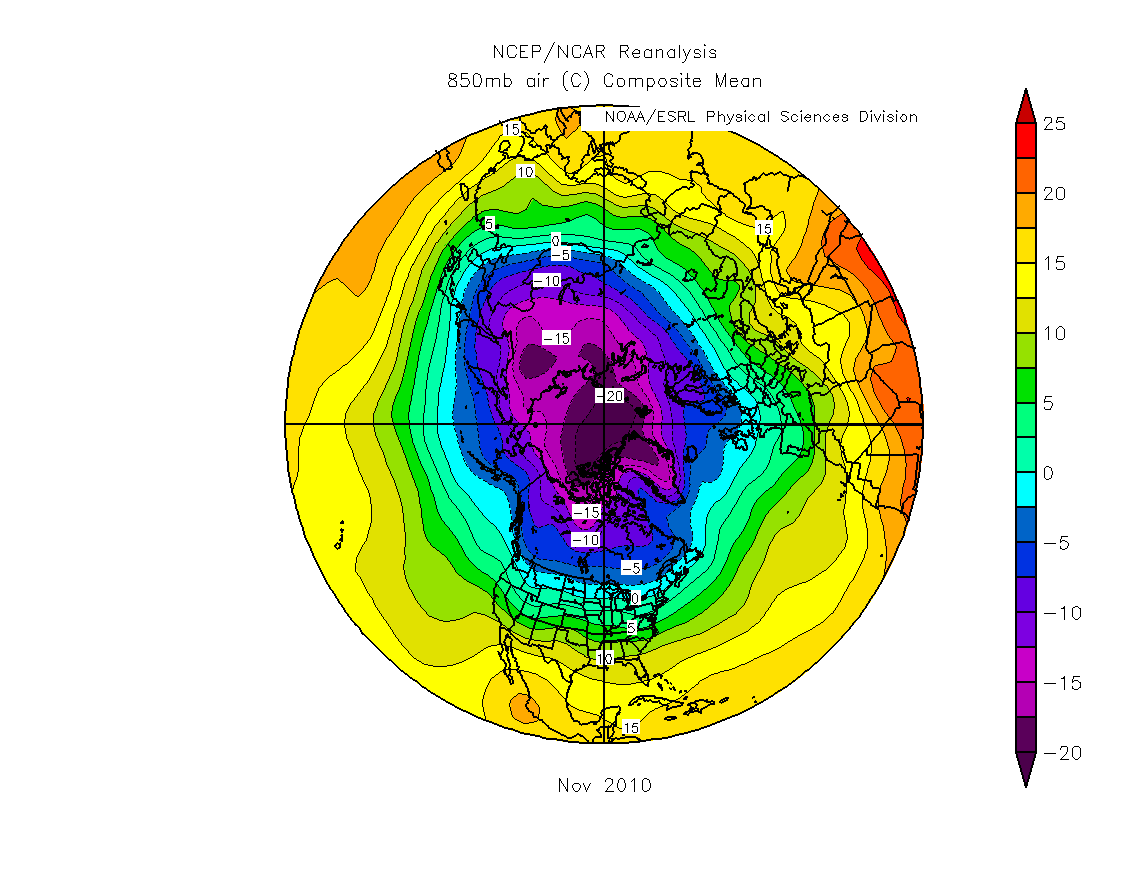
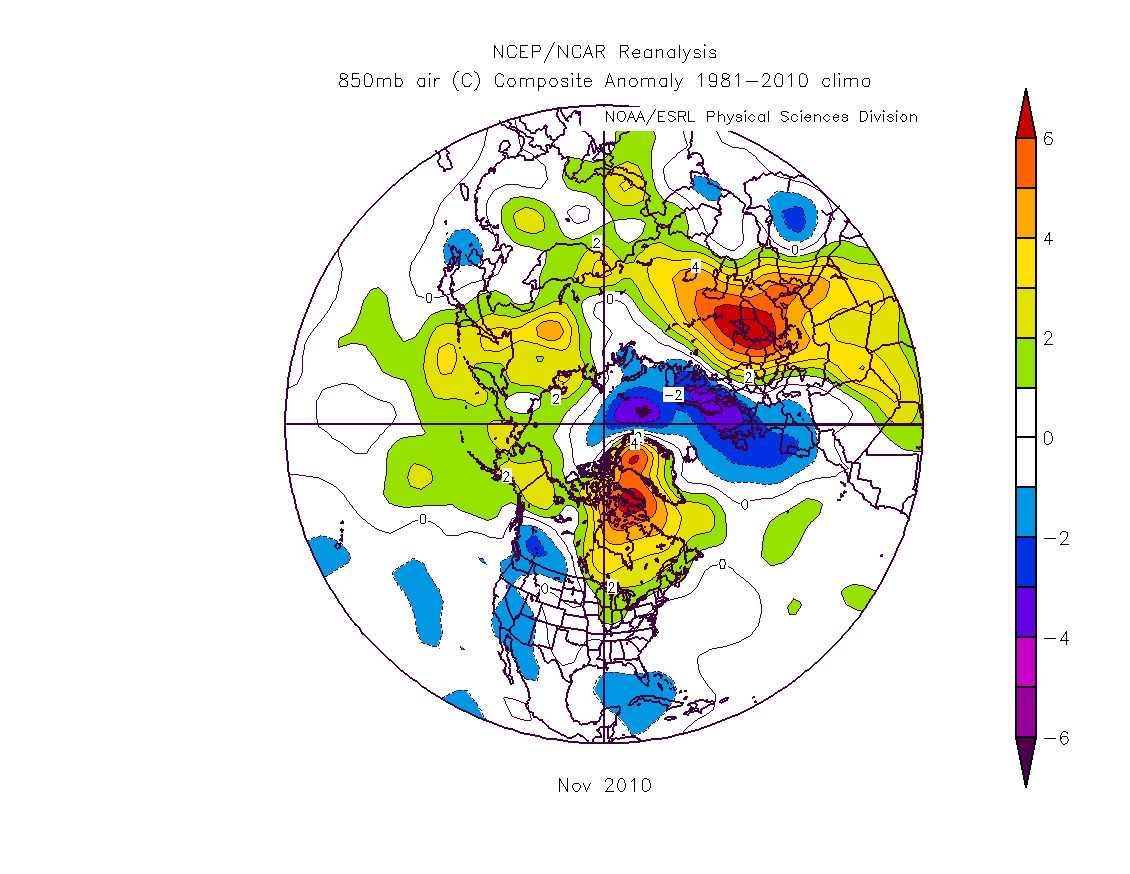
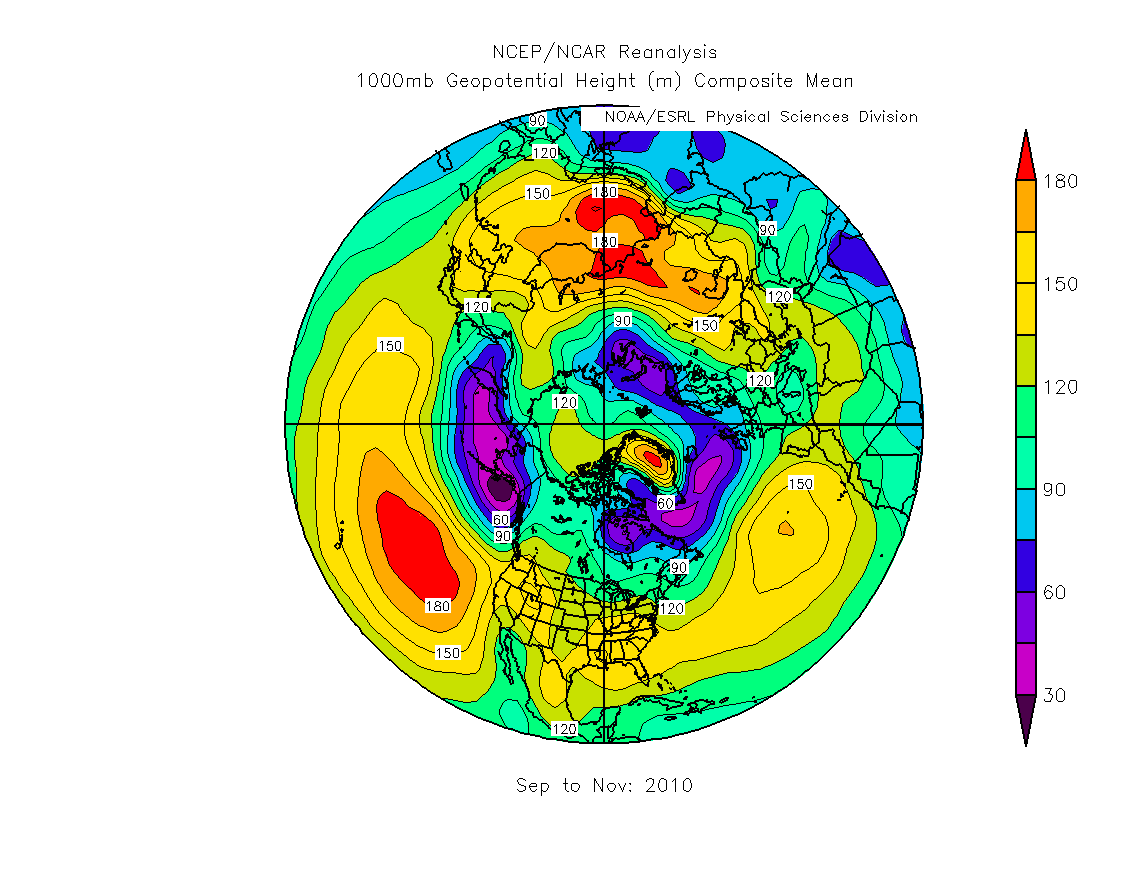
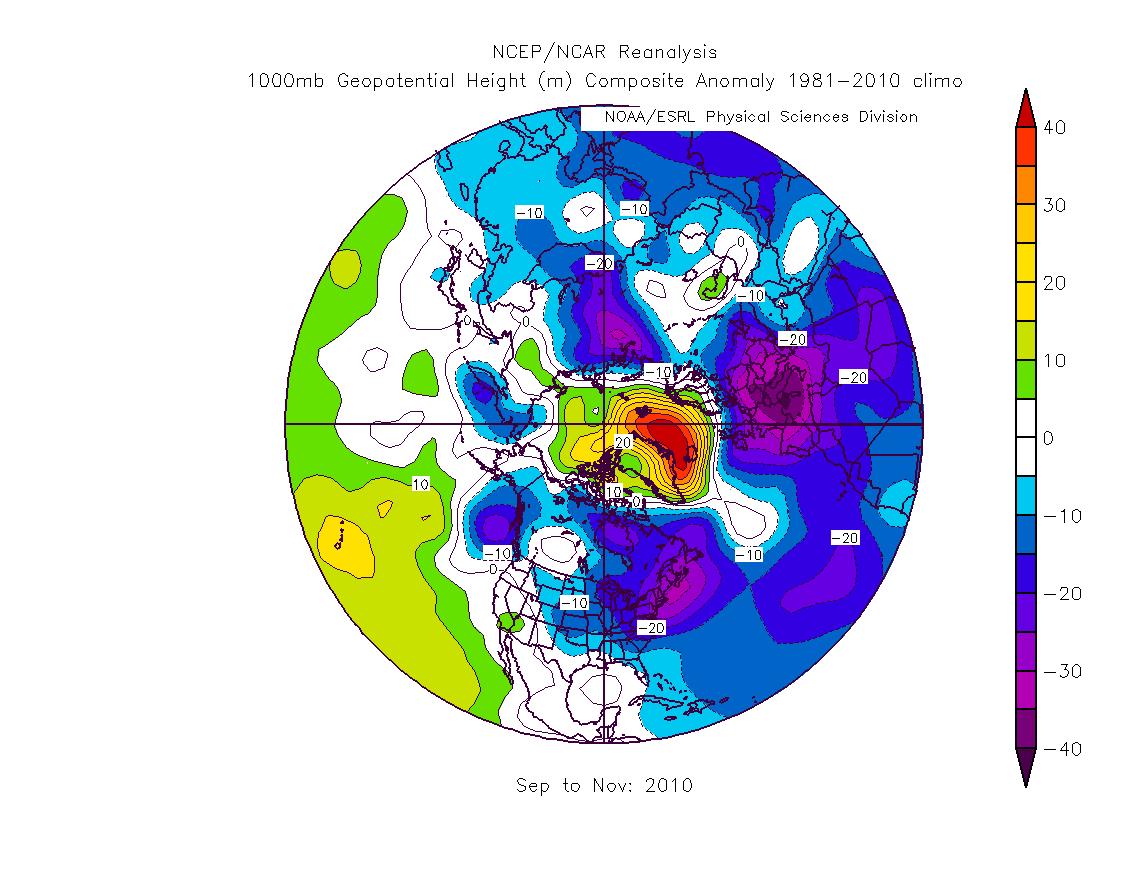
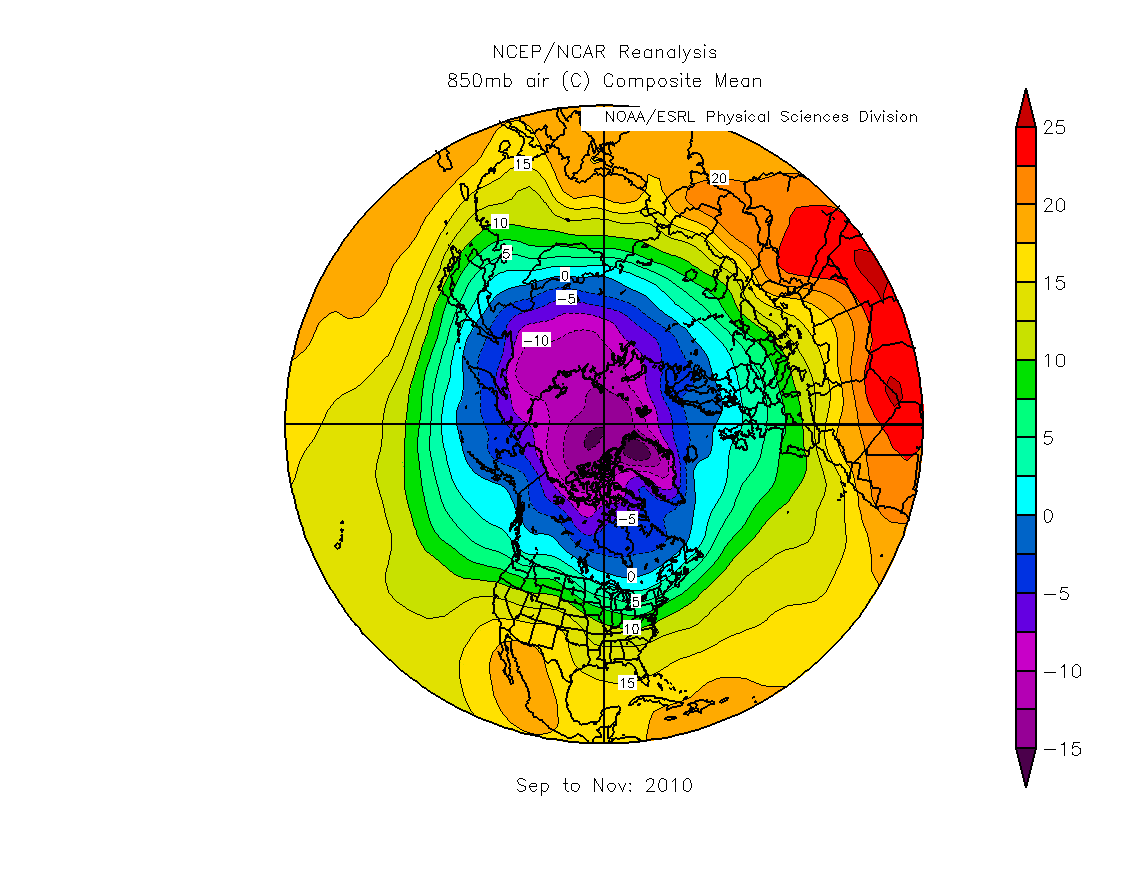
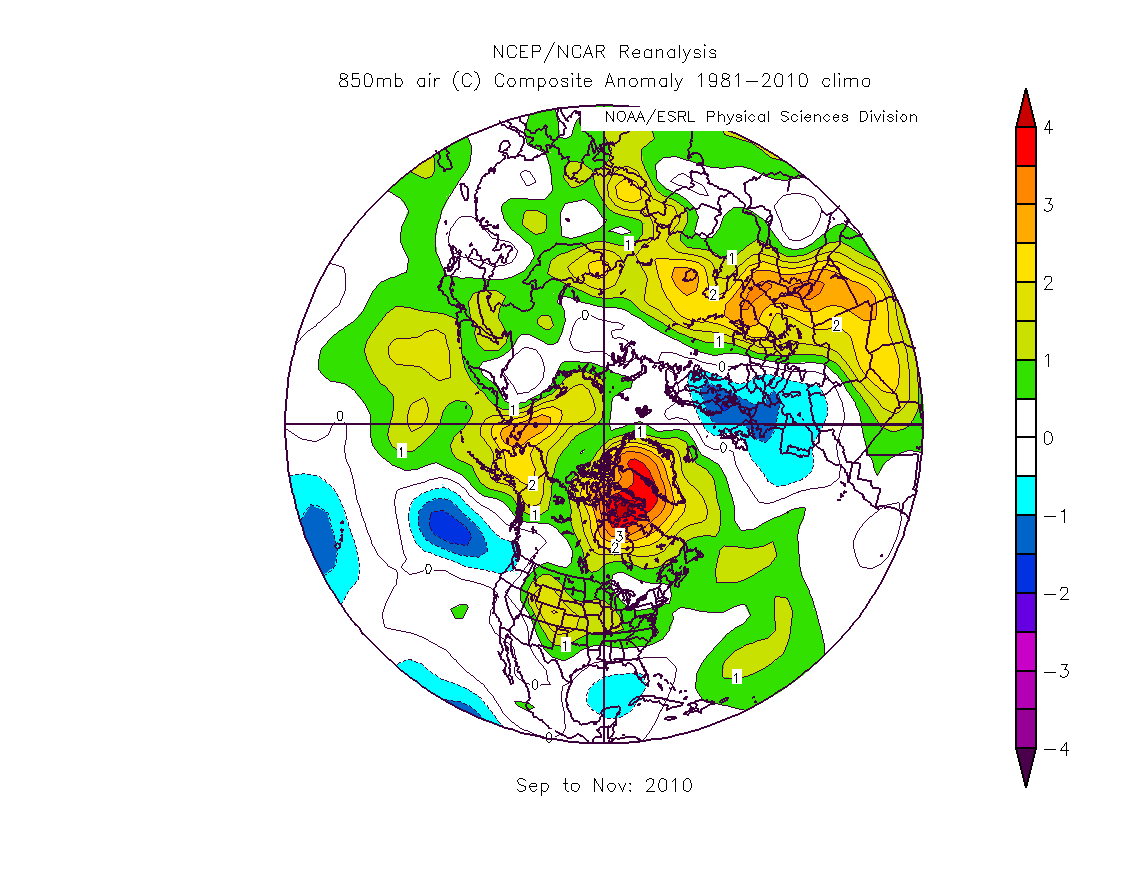
Autumn (SON) 2010
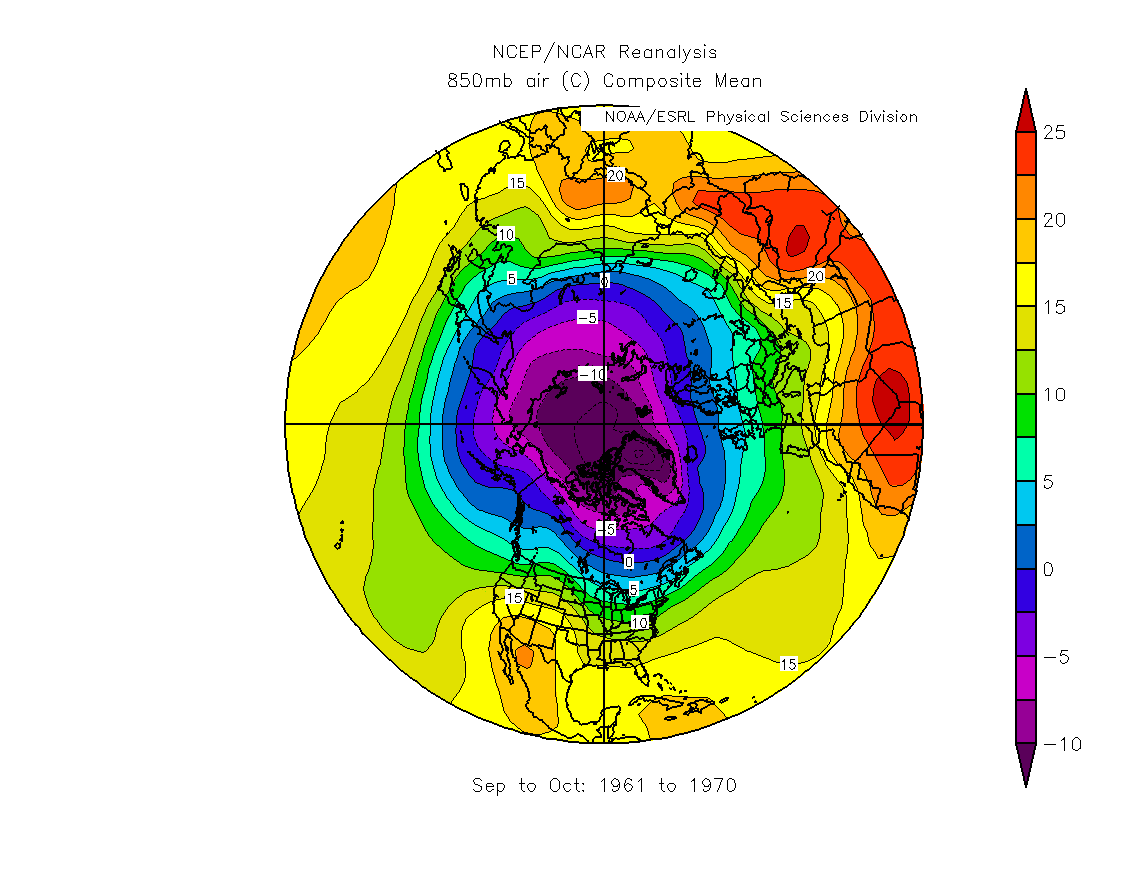
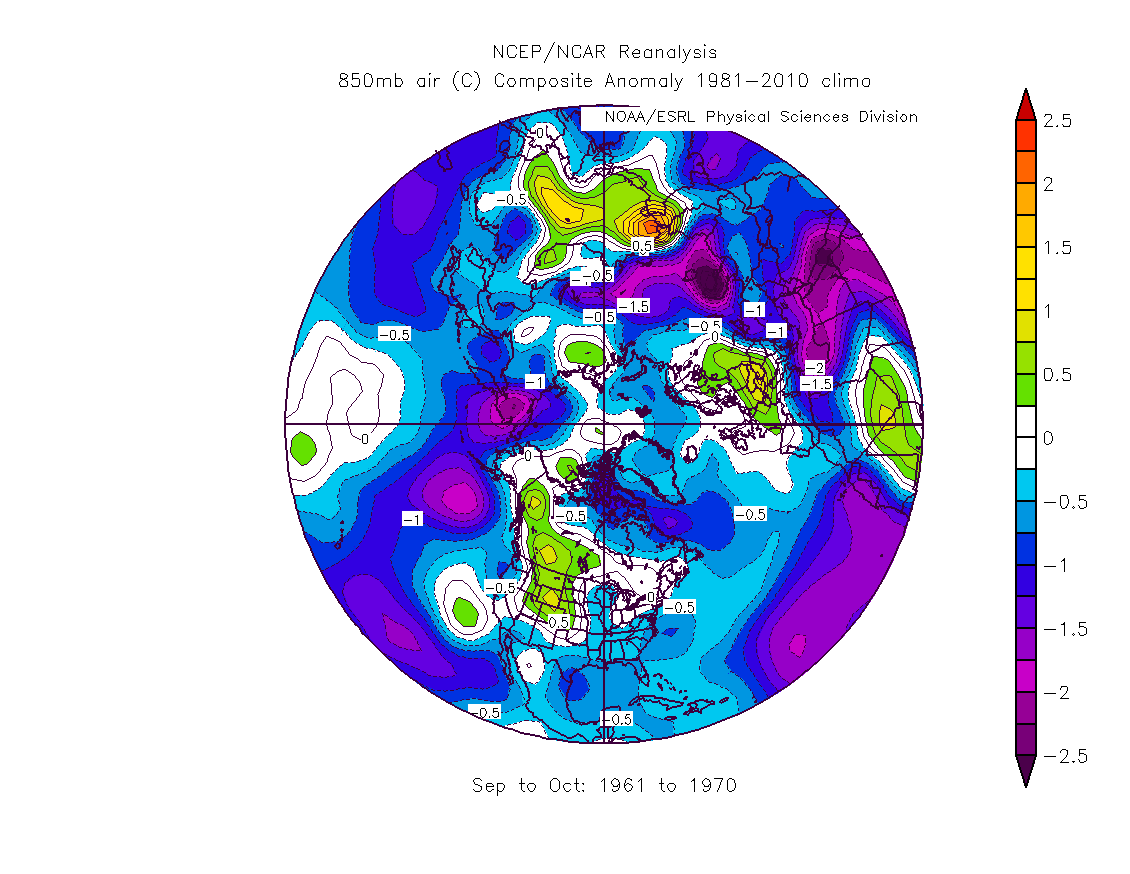
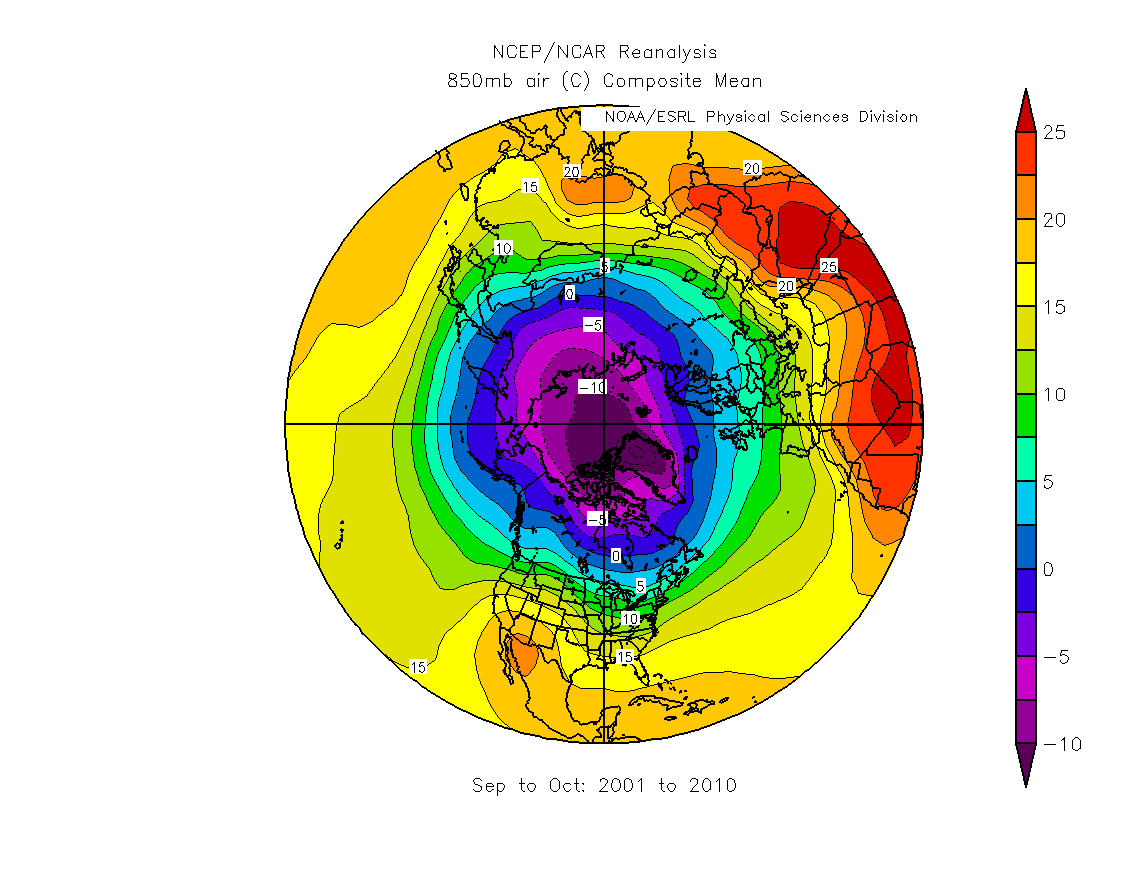
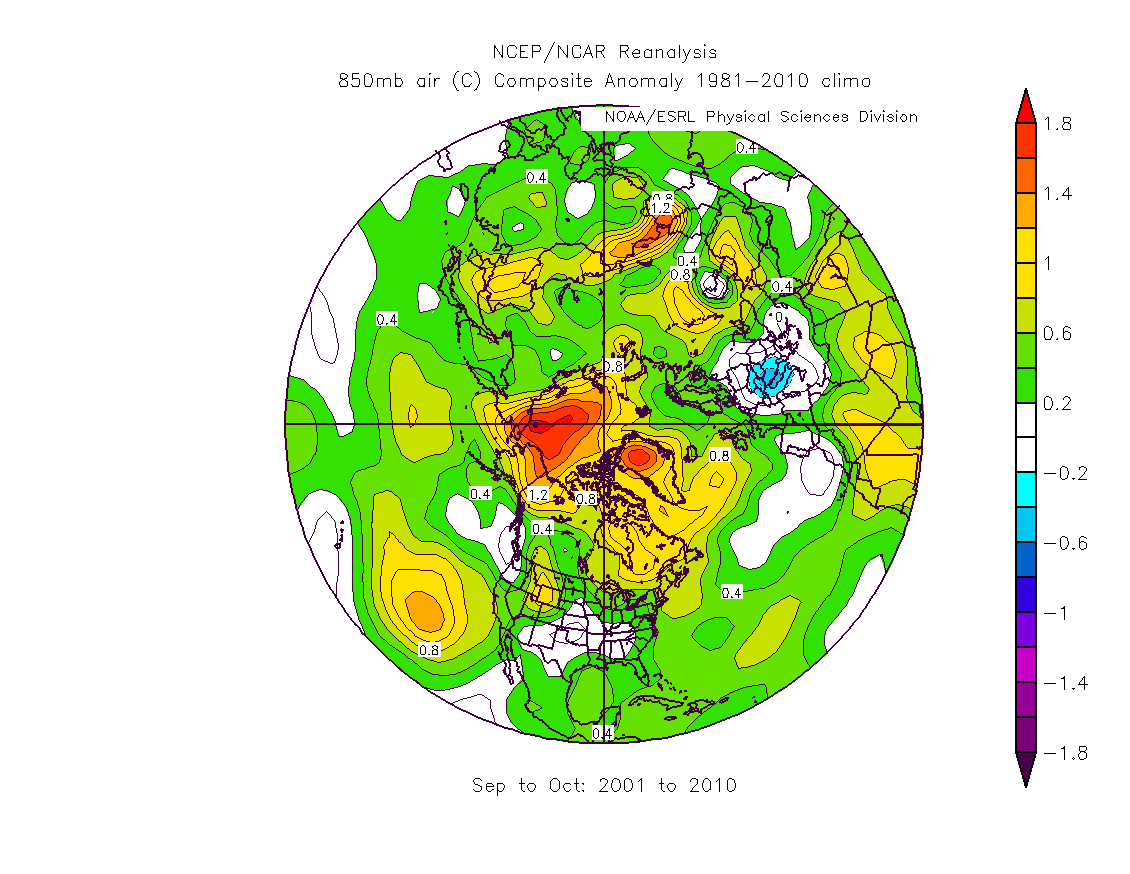
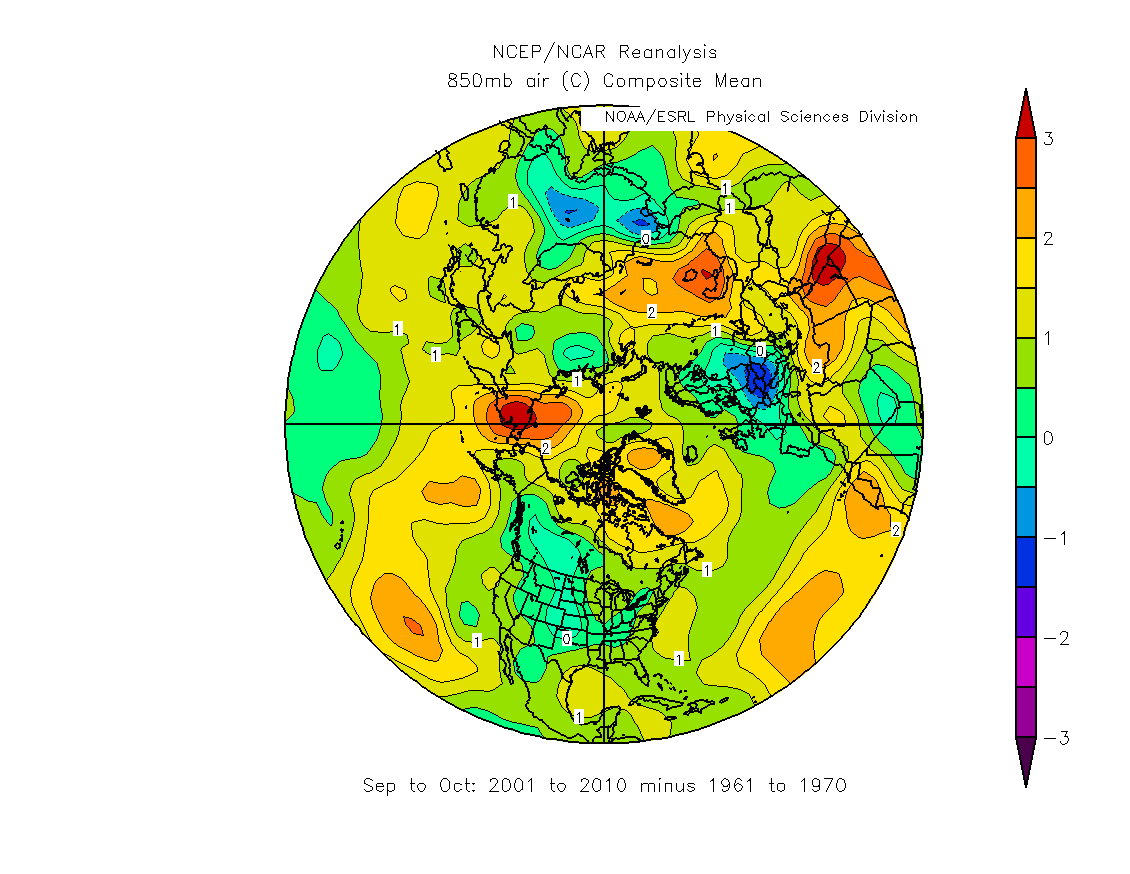
Autumnal Warming & Sea Ice Impacts in the NH
| 1961-1970 | |
| • 850 hPa Temperature | • 850 hPa Temperature Anomalies |
| 2001-2010 | |
| • 850 hPa Temperature | • 850 hPa Temperature Anomalies |
| (2001-2010) minus (1961-1970) | |
| • 850 hPa Temperature |
Albany's Longest Heat Waves
| • Summary: Lance Bosart |
| 27 Aug - 5 Sep (1953) |
| • Mean 500-hPa Geopotential Height |
| • Anomalous 500-hPa Geopotential Height |
| • Mean 850-hPa Temperature |
| • Anomalous 850-hPa Temperature |
| • Mean Sea Level Pressure |
| • Anomalous Sea Level Pressure |
| 27 Aug - 5 Sep (1973) |
| • Mean 500-hPa Geopotential Height |
| • Anomalous 500-hPa Geopotential Height |
| • Mean 850-hPa Temperature |
| • Anomalous 850-hPa Temperature |
| • Mean Sea Level Pressure |
| • Anomalous Sea Level Pressure |
| 3 Sep - 12 Sep (1983) |
| • Mean 500-hPa Geopotential Height |
| • Anomalous 500-hPa Geopotential Height |
| • Mean 850-hPa Temperature |
| • Anomalous 850-hPa Temperature |
| • Mean Sea Level Pressure |
| • Anomalous Sea Level Pressure |
Recent Extreme Weather and Climate Events
| March 2012 CONUS heat wave | |
| • March 2012 ESRL Figures | • Retrospective Maplist Post |
| • Friday Mapdiscussion Summary 31 Mar 2012 | • Firday Map discussion Summary 13 Apr 2012 |
| • Dole et. al. (2013): PDF on March 2012 CONUS Heatwave |
| September 2013 Colorado Floods | |
| • Map Discussion Masterlink | • Mean and Anomaly ESRL Plot Matrix |
| 20-21 June 2013 Calgary, Canada Floods | |
| • Flood Photos: Calgary Herald | • News Article: Calgary Herald |
| • DT on Theta with Low-Level Rvort: Heather Archambault | • Thickness / MSLP / PW / 250 hPa Wind: Heather Archambault |
| • 250 hPa Isotacs, PV, RH, 600-400 hPa layer average ascent, 300-200 hPa layer average irrotational wind: Heather Archambault | • Water Vapor Satellite Animation: NOAA/NWS/SPC |
| • Infrared Satellite Animation: NOAA/NWS/SPC | • NESDIS Operational Blended TPW over CONUS: OSPO/NOAA | • Observations at University of Calgary (SA10) | • Maplist Posts |
| October 2012 Hurricane Sandy | |
| • Hurricane Sandy Seminar Imagery and Links: ATM 639 Students and Faculty | • Hurricane Sandy Maplist Masterlink |
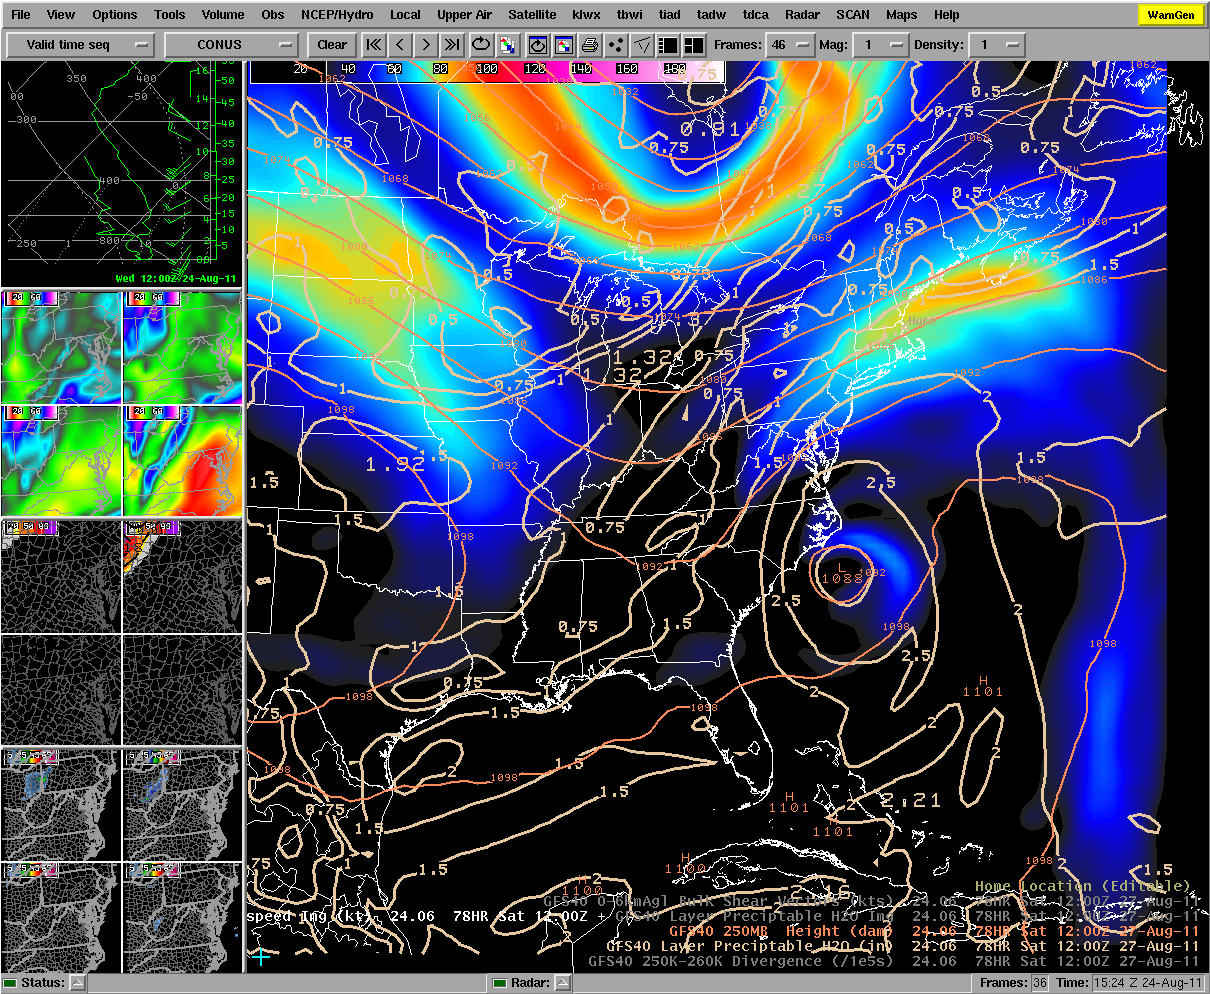
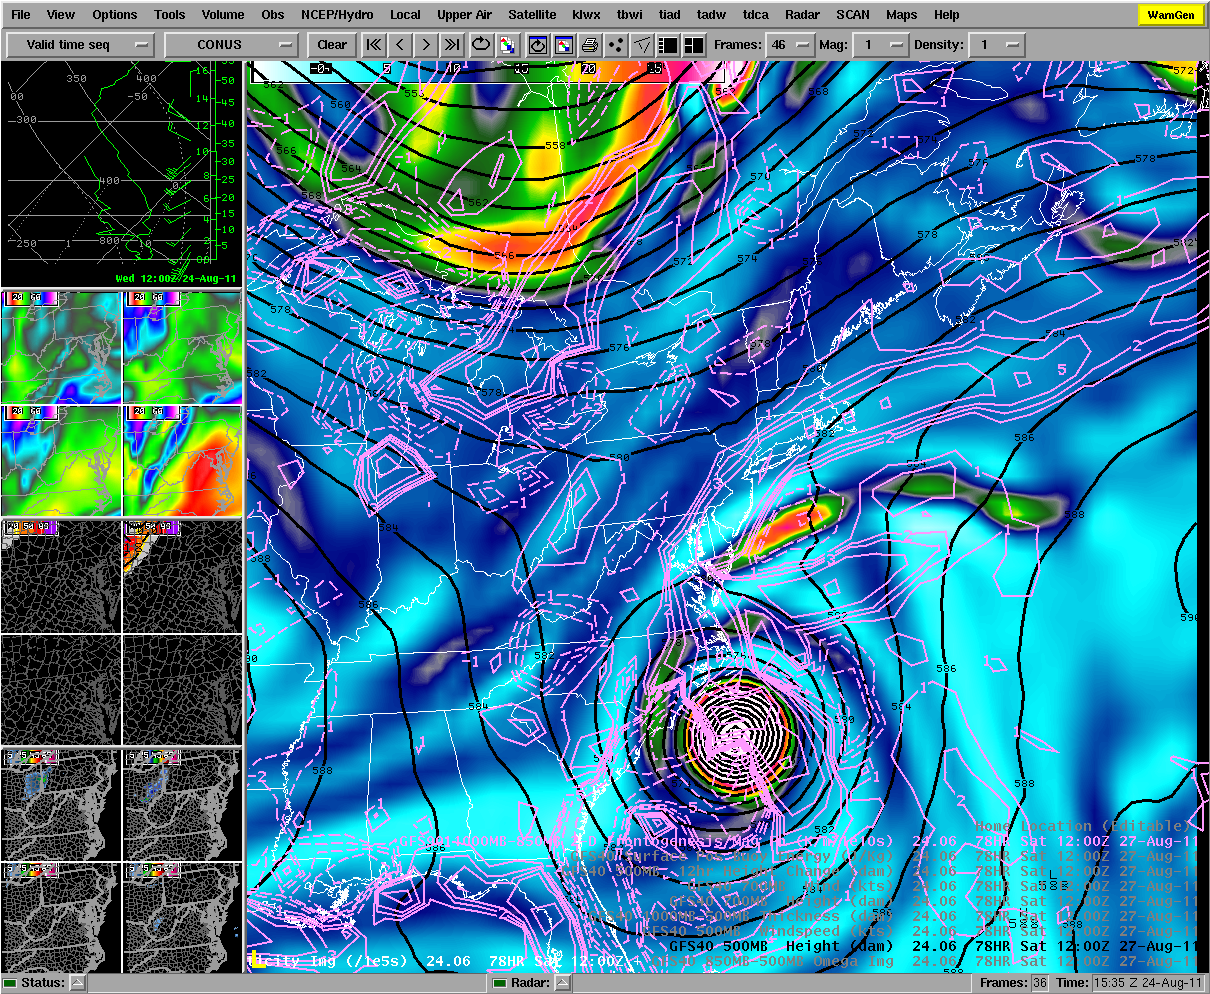
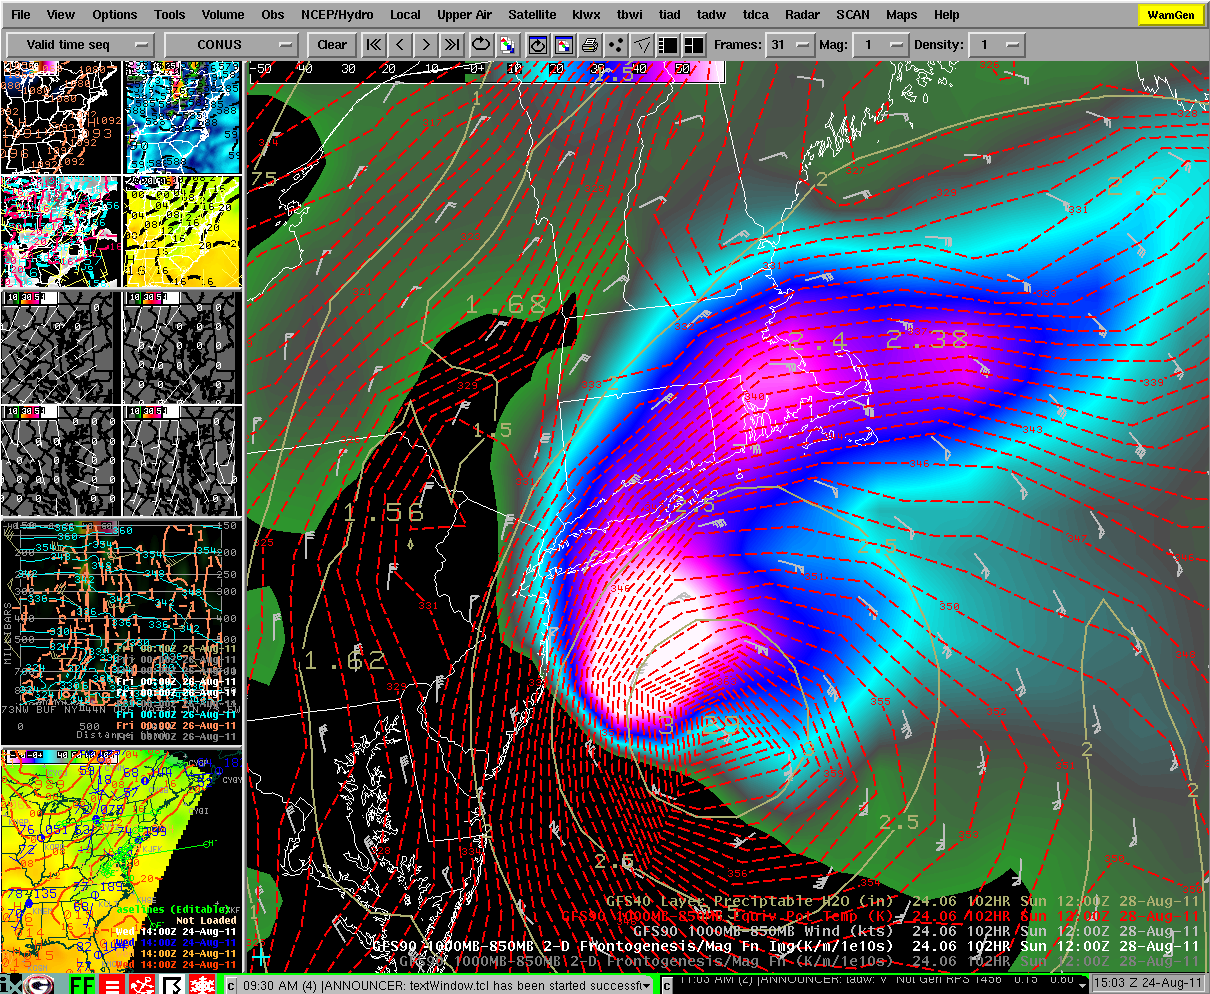
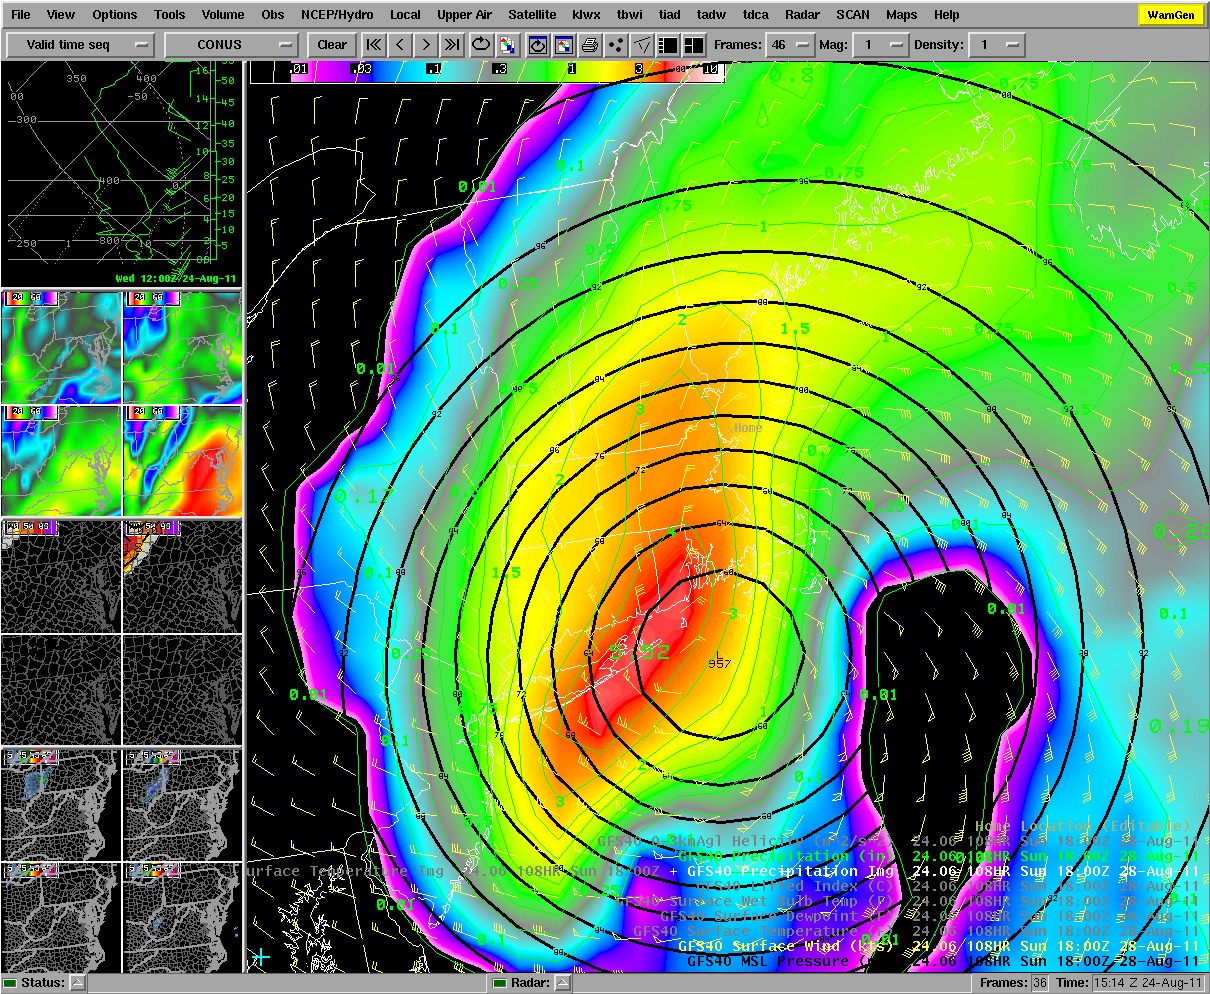
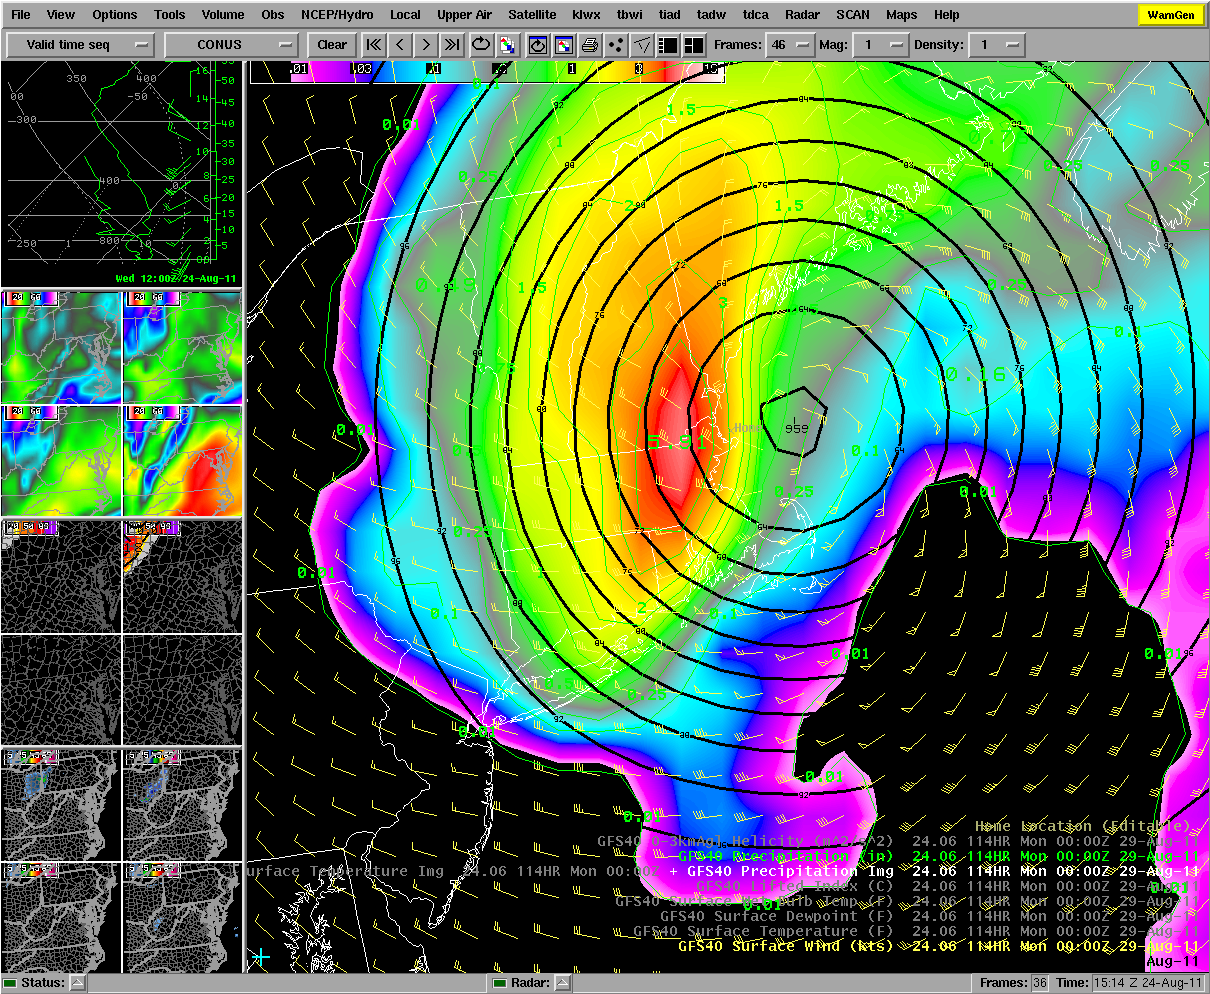
| August 2011 Hurricane Irene | |
| • Infrared Satellite Animation of Irene Making Landfall: CIMSS | • Precipitation Verification Plots (Models and WPC): EMC/NCEP/NOAA |
| • Collection of Hurricane Irene Map Posts | • Hurricane Irene Summary: Richard Grumm |
| • 250 hPa Wind / Height/ PW: Jared Klein | • 500 hPa Vorticity / Height/ Low-Level Fontogenesis: Jared Klein |
| • 1000-850 hPa ThetaE / Frontogenesis / PWAT: Jared Klein | • Precip + MSLP (1): Jared Klein |
| • Precip + MSLP (2): Jared Klein |
| November 2013 Mediterranean flooding in Sardinia | |
| • Map discussion Summary: CIMSS | • Map discussion Masterlink |
| • World record point precipitation measurements(HDSC - NWS - NOAA) |
| The Great Rains of May 2015 over the Southern Plains |
| • Map discussion Summary: Lance Bosart |
| • Mean 300-hPa Geopotential Height (4 May - 18 May 2015) |
| • Anomalous 300-hPa Geopotential Height (4 May - 18 May 2015) |
| • Mean 850-hPa Geopotential Height (4 May - 18 May 2015) |
| • Anomalous 850-hPa Geopotential Height (4 May - 18 May 2015) |
| • Mean 850-hPa Temperature (4 May - 18 May 2015) |
| • Anomalous 850-hPa Temperature (4 May - 18 May 2015) |
| • Anomalous Precipitable Water (4 May - 18 May 2015) |
Last updated: 8 December 2015