Class Summaries, Announcements, and Links:
Find Day
8/27 9/1 9/3 9/08 9/10 9/15 9/17 9/24 9/29 10/1 10/6 10/8 10/13 10/15 10/20 10/22 10/27 10/29 11/03 11/05 11/09 11/10 11/12 11/17 11/19 11/24 12/01 12/03 12/0827 Aug 2015
Reading Assignment
Barry and Hall-McKim: Essentials of the Earth's Climate System
--Ch. 1 (pp. 1-13)
Links
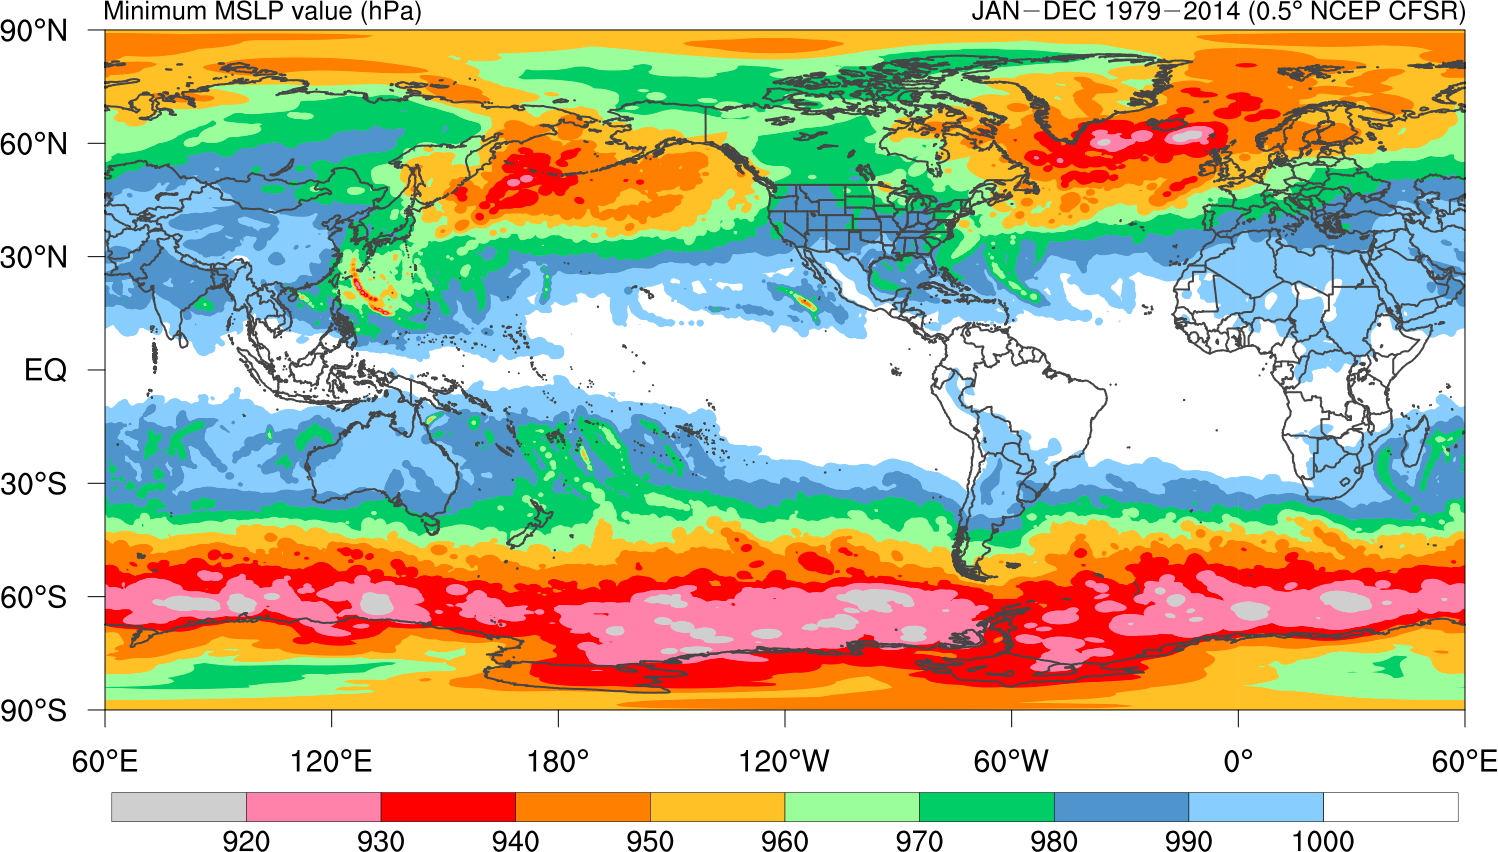
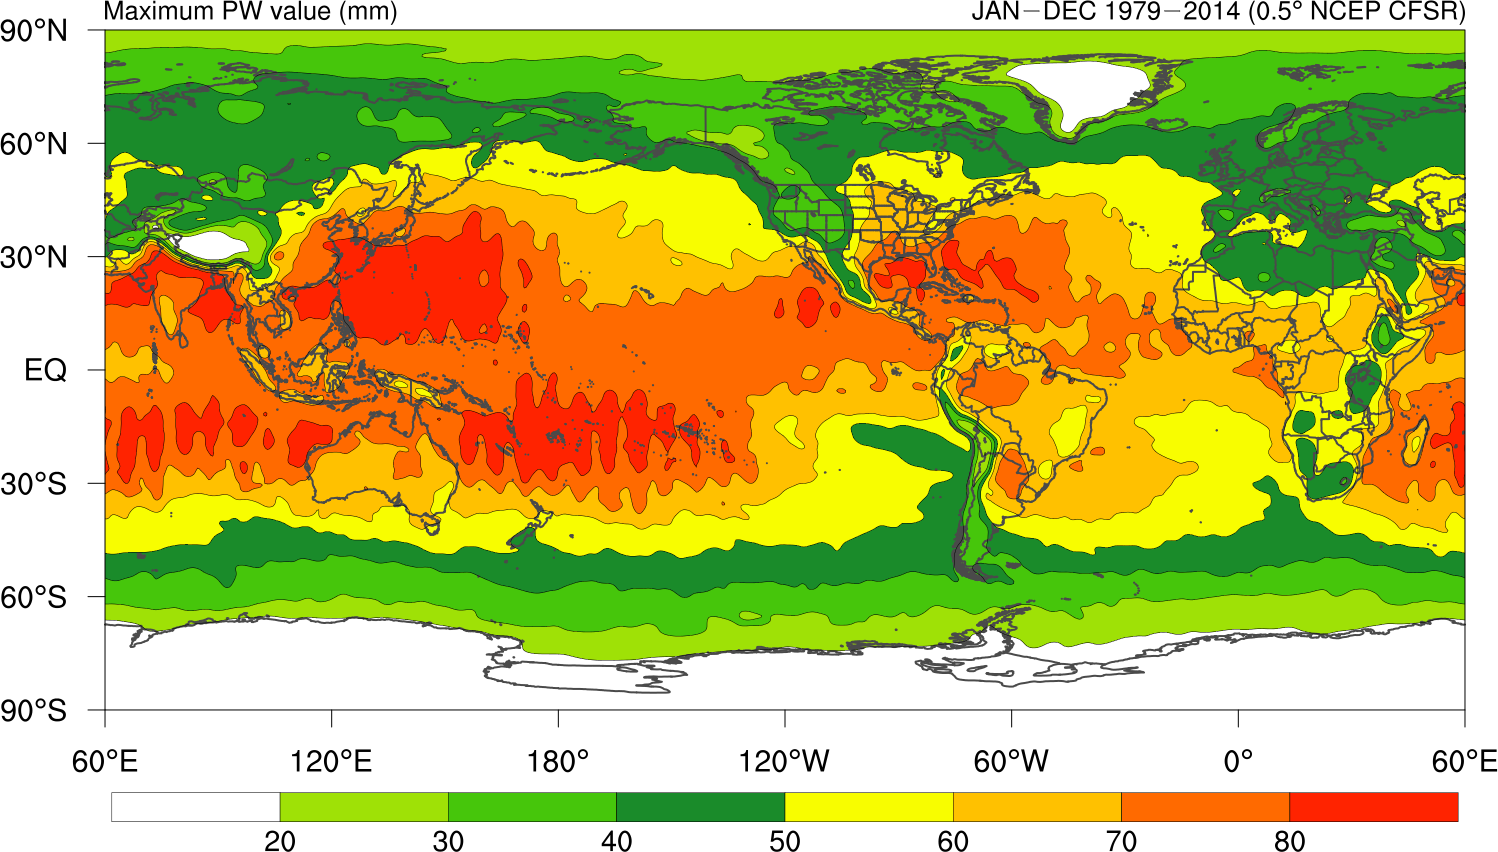
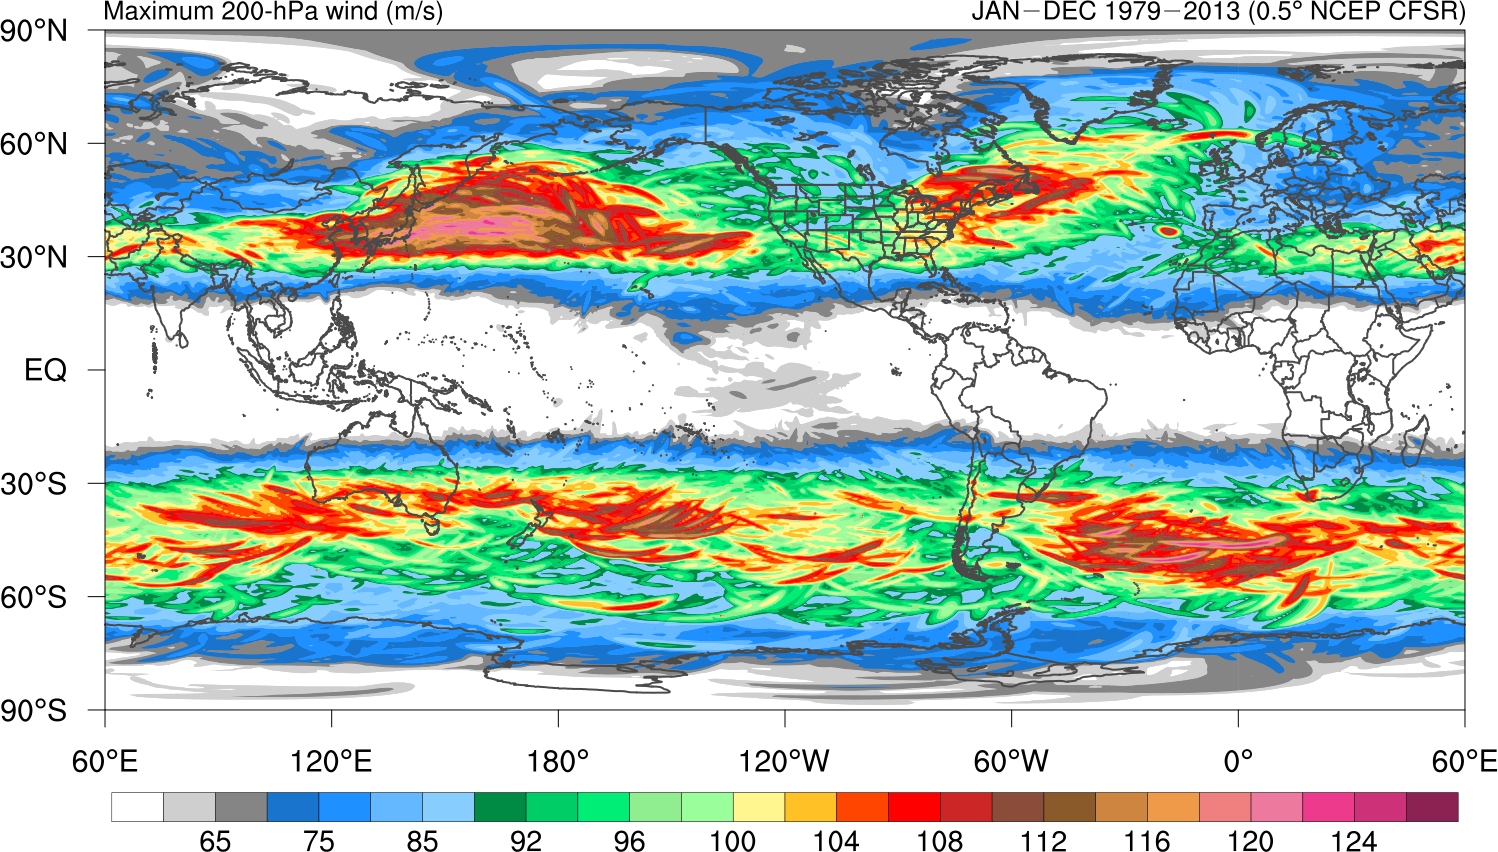
Web: Climate Central NASA 135 years (1880-2014) of Global Warming in 30 seconds: Climate Central Surge in Danger Days Here Comes El Nino: NCAR-UCAR Atmospheric News Arctic Amplification and Winter Cold: NCAR-UCAR Atmospheric News: Top Ten Weather-Climate Stories of 2014: NCAR-UCAR Atmospheric News New York Times: 2014 Warmest Year: Part1 New York Times: 2014 Warmest Year: Part 2 Climate Communication Science and Outreach Climate Prediction Center Forecast Verification Spurious Correlations: Tyler Vigen WeatherBell Analytics --Climate Atlas --ECMWF 32-Day 51-Member Ensemble Forecast --ECMWF Global Temperature Anomaly --NCEP Climate System Forecast System V2 (CFS) Climate Reanalyzer: Excellent Source Weather and Climate Data Iowa State University Automated Datas Plotter Earth Real-Time Low-Level Global Winds Visualization Global Temperature ExtremesAlicia Bentley's Global Maps of Minimum SLP and Maximum Precipitable Water: MSLP Minimum (1979-2014): Global View (Year Round) --MSLP Minimum (1979-2014): Regional View (Year Round) --MSLP Minimum (1979-2014): Regional View (Oct - Mar) PW Maximum (1979-2014): Global View (Year Round) --PW Maximum (1979-2014): Regional View (Year Round) --PW Maximum (1979-2014): Regional View (Oct - Mar) 200-hPa Wind Maximum (1979-2013): Global View (Year Round) NOAA-NCDC Climate Data and Climate Information Links: Home --Teleconnections --Climate Monitoring --State of the Climate --Temperature, Precipitation, and Drought --Climate at a Glance --Bulletin AMS (BAMS) State of the Climate --Extremes --Sociental Impacts --Snow and Ice --Global Historical Climate Network (GHCN) --Climate Monitoring References A Year in the Life of GOES-13 (2014)
Papers and Articles: Global Precipitation Climatology: Ashouri et al. (2015) Web-based Efficient Access to Climate Products: DeGaetano et al. (2015) Adjustments in there Forcing-Feedback Framework for Understanding Climate Change: Sherwood et al. (2015) Is it global warming or just the weather?: Economist May 2015 The Atacama Surface Solar Maximum: Rondanelli et al. (2015) NOAA Local Climate Analysis Tool (LCAT): Data, Methods, and Usability: Timofeyeva-Livezey et al. (2015) The Changing Character of Precipitation: Trenberth et al. (2003) Spurious Correlations: Tyler Vigen - Science May 2015 State of the Climate: 2014 (BAMS July 2015) IPPC Assessment Reports: Fifth Assessment Report (2013): Main Page --The Physical Basis --Impacts, Adaptation, and Vulnerability --Mitigation of Climate Change --Synthesis Report Fourth Assessment Report (2007): Main Page
Presentations: Brian Rose and Daniel Enderton: Looking Back on the Future of Climate Change
1 Sep 2015
Reading Assignment
Barry and Hall-McKim: Essentials of the Earth's Climate System
--
Links
Web: National Snow and Ice Data Center Satellite Observations of Arctic Change Presidential Briefings on Climate Change Mutually Insured Destruction: New York Times 27 Aug 2013 Arctic Warming May Not be Altering Jet Stream: Climate Central 21 Aug 2013 Cryosphere Today University of Washington Polar Ice Center Plausible Future Temperature Pdfs in a Warmer Climate Albany's Longest Heat Waves Kyle Griffin's Global Forecasting Maps
Papers and Articles: Neff et al. (2014): Continental heat anomalies and the extreme melting of the Greenland ice surface in 2012 and 1889 Mutiibwa et al. (2015): Recent spatiotemporal patterns in temperature extremes across conterminous United States Kennedy et al. (2015):Global and Regional Climate in 2014 Bintaja et al. (2013): Important role for ocean warming and increased ice-shelf melt in Antarctic sea-ice expansion
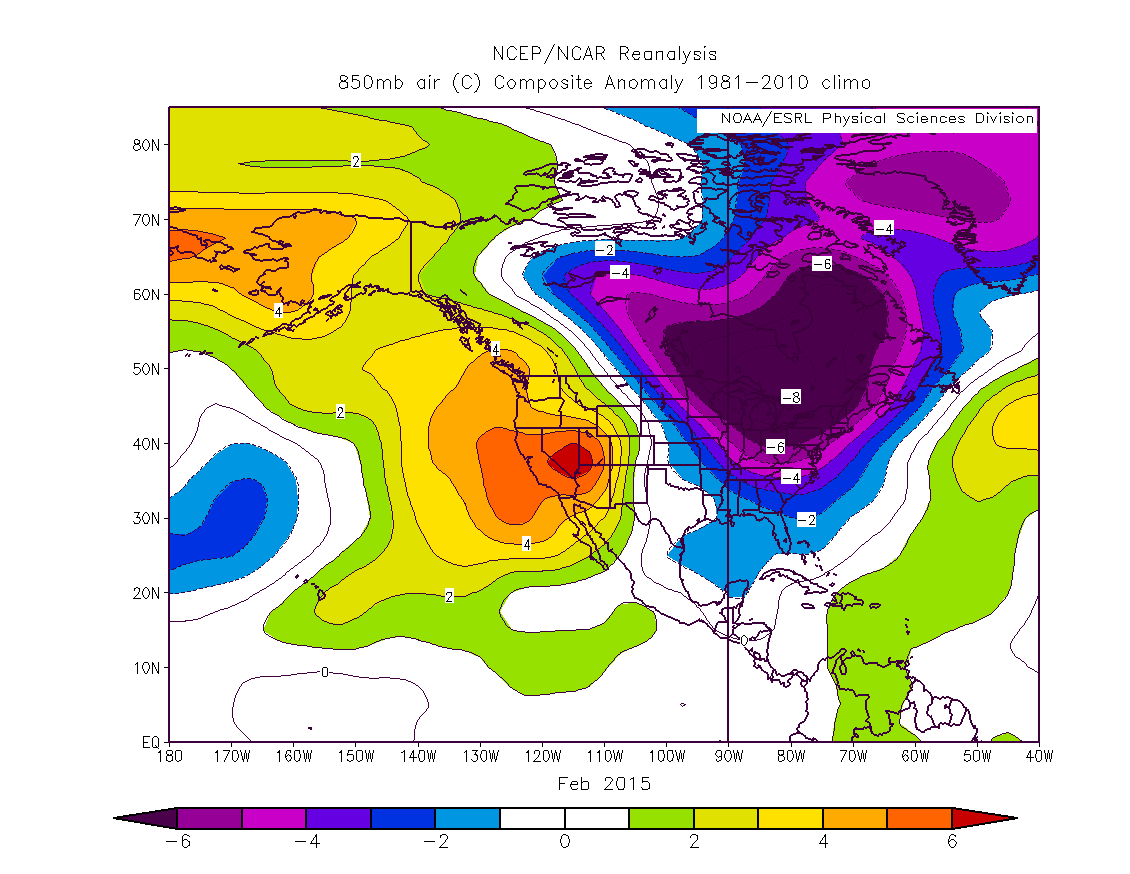
Presentations: Wild Northeast Winter: Mean and Anomalous NH Flow Patterns for 24 January - 16 February 2015
3 Sep 2015
Reading Assignment
Barry and Hall-McKim: Essentials of the Earth's Climate System
--
Links
Web:Article on Earth's Oceans: GOCE
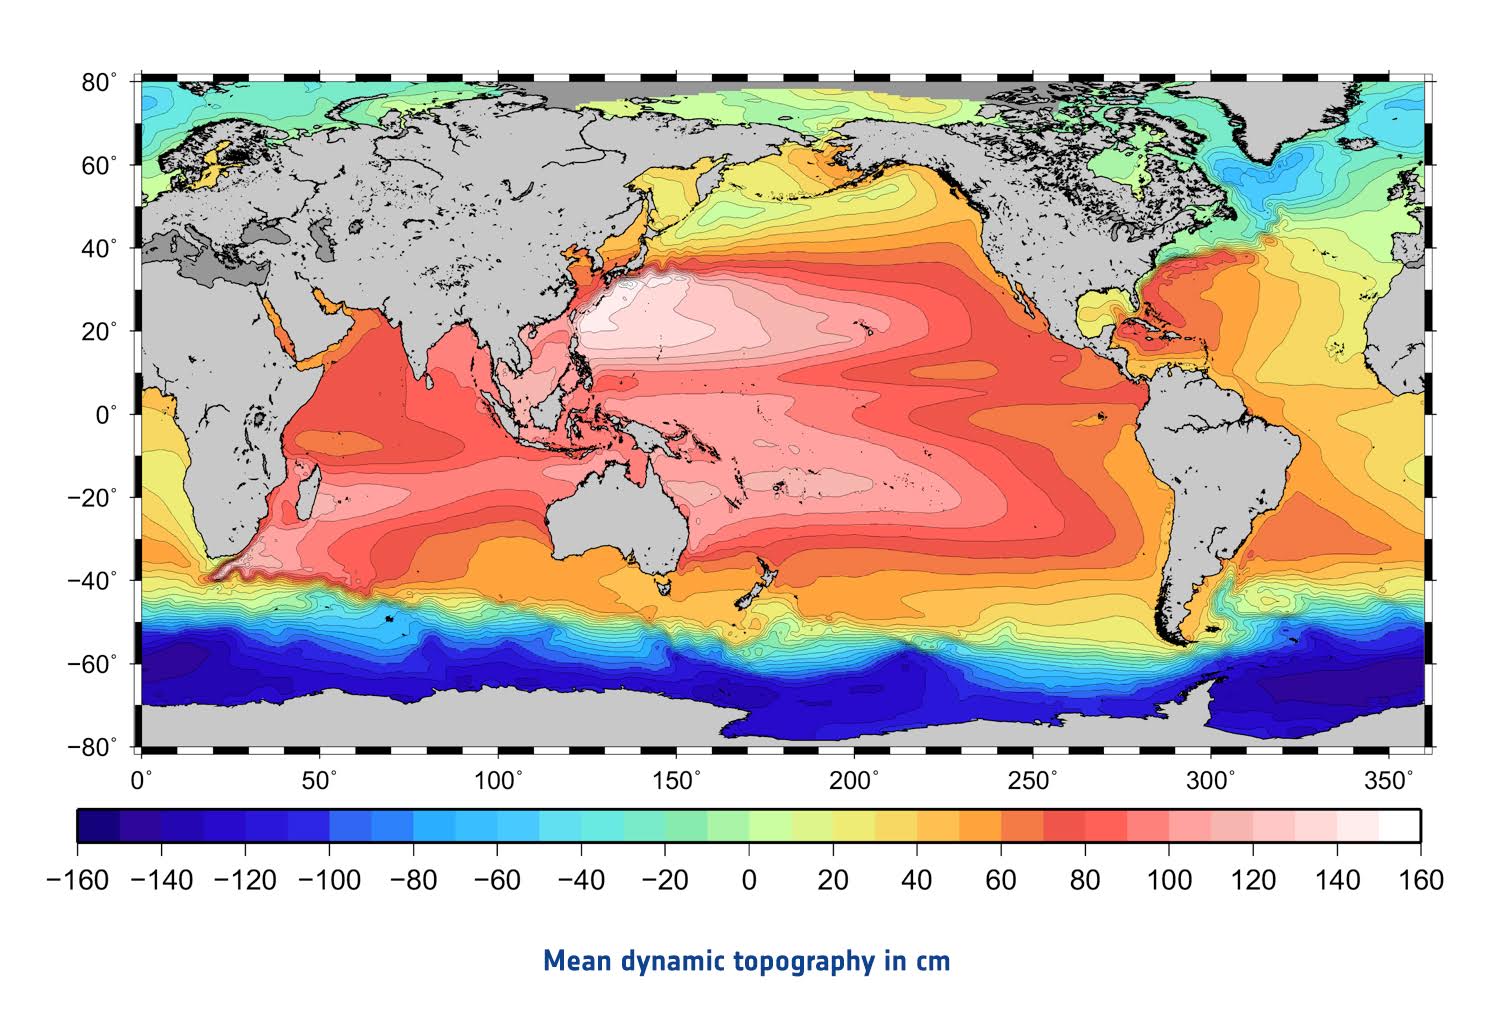
--Ocean Dynamic Height (cm)
The mean dynamic topography (MDT, in cm) of the world's oceans in the highest resolution ever achieved from space-based data. MDT is calculated by taking the mean sea-surface height measured by satellites like Envisat, and subtracting the gravity model from GOCE. Red areas show where water levels are above the surface of the gravity model, while blue depicts areas where the water is below. From this, scientists calculated the speed of ocean currents. CPC mean and anomalous equatorial ocean temperatures
8 Sep 2015
Reading Assignment
Barry and Hall-McKim: Essentials of the Earth's Climate System
--
Links
Web:Real-Time Global Winds: earth.nullschool.net (Cameron Beccario)
Real-Time Surface Observations (U.S.): Meso West
Real-Time Surface Winds (U.S.): hint.fm/wind
10 Sep 2015
Reading Assignment
Barry and Hall-McKim: Essentials of the Earth's Climate System
--
Links
Web:Pacific Decadal Ossilation: Google image search
--Article on the PDO: Washington Post
--Information on the PDO: Wikipedia
--NOAA NCDC
--University of Washington: Wikipedia
--COMET
Papers and Articles: Kushnir et al. (2002): Atmospheric GCM Response to Extratropical SST Anomalies - Journal of Climate Lau (1996): Interactions between Global SST Anomalies and the Midlatitude Atmospheric Circulation - BAMS
15 Sep 2015
Presentation:
Using the NOAA ESRL PSD maproom + other climate maps
Web:
NOAA/ESRL/PSD: Map room
--Plotting&Analysis
--Monthly/Seasonal Climate Composites
---->Example: 850-hPa Temperature Anomalies for Feb 2015
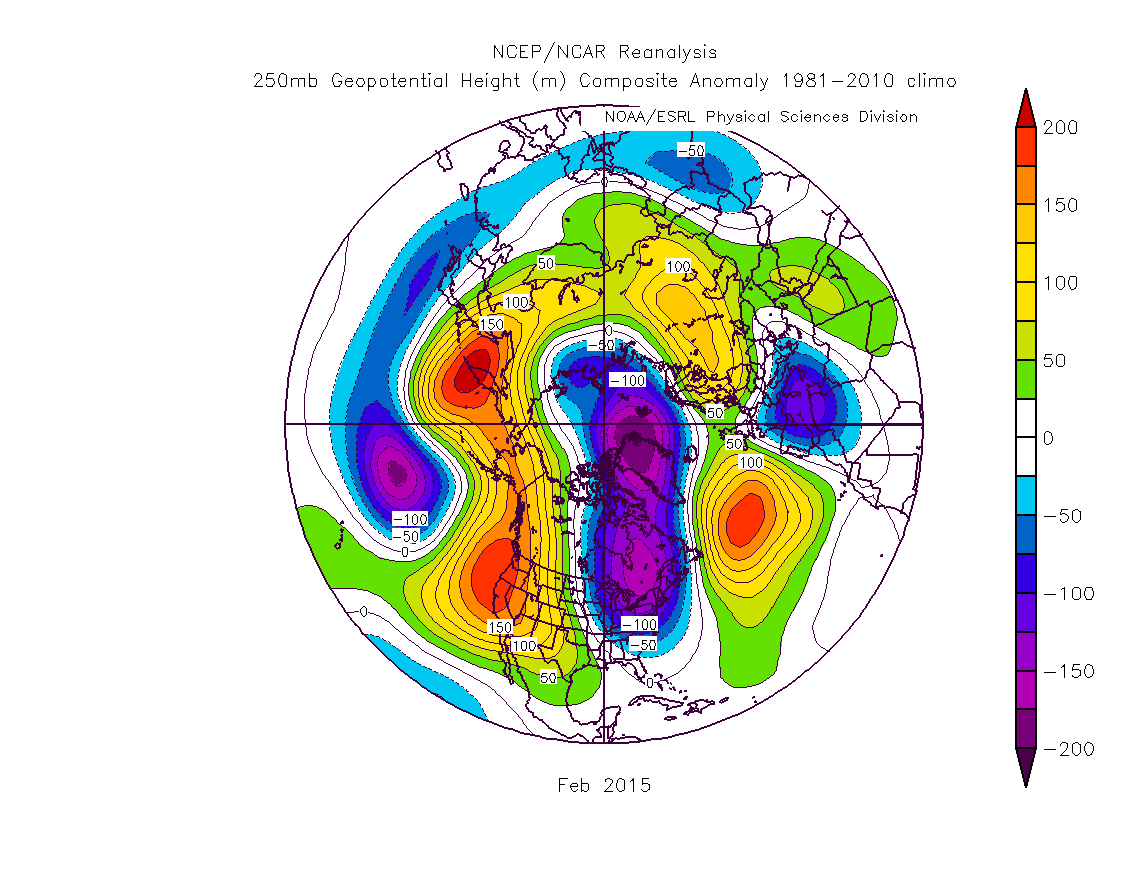
---->Example: 250-hPa Geopotential Height Anomalies
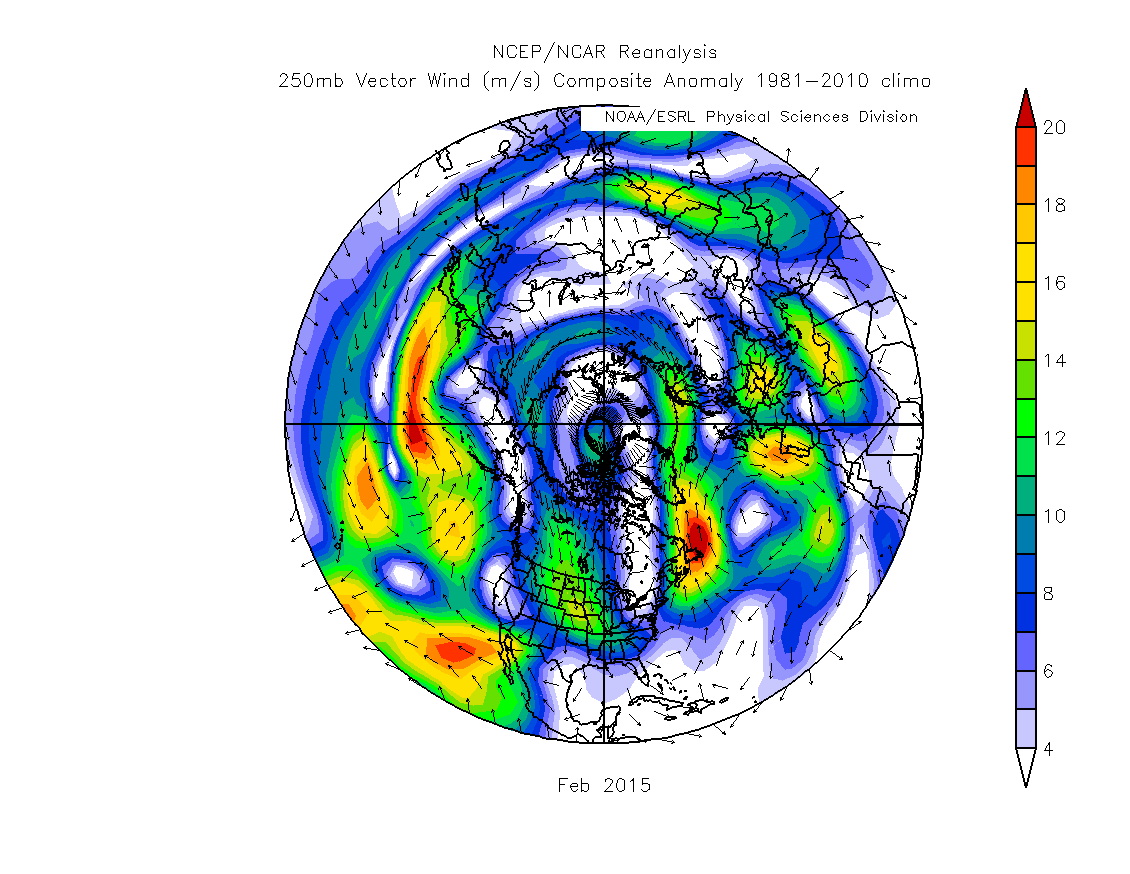
---->Example: 250-hPa Wind Vectors Anomalies
--Daily Maps and Composites
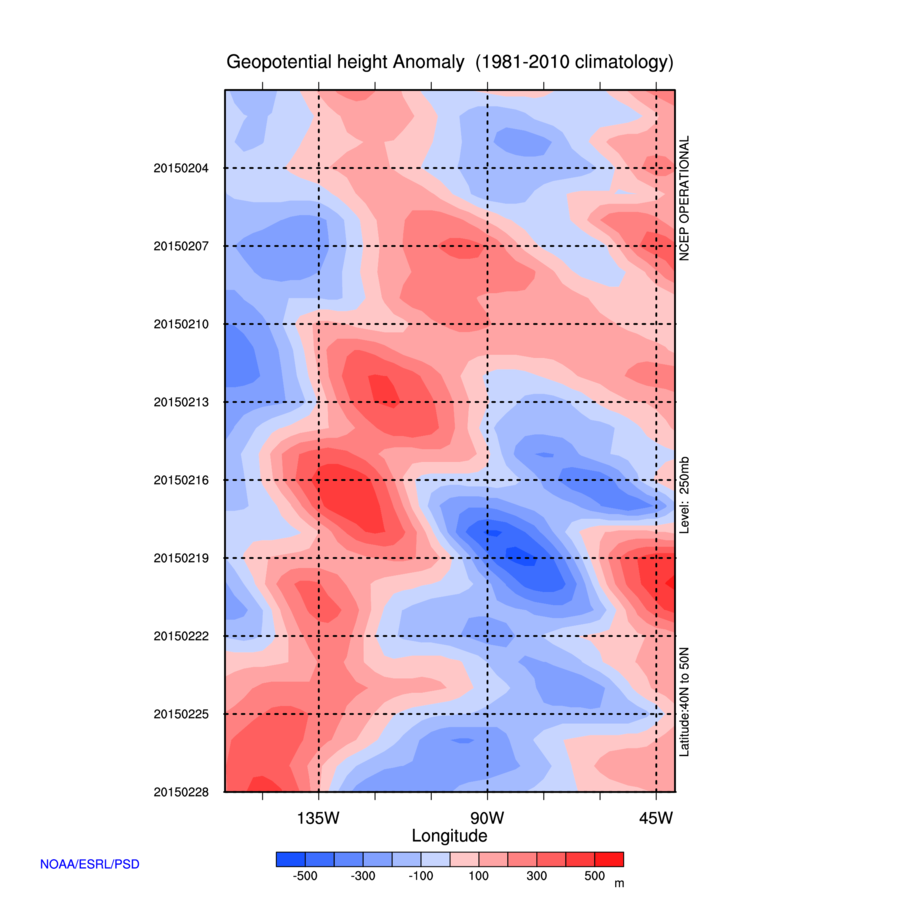
--Time-section Plots: (Hovmollers) ---->Example: 250-hPa Geopotential Height Anomalies
--Correlations NCDC's Climate Monitoring Page --State of the Climate
--Temperature, Precipitation, and Drought
--Climate at a Glance
--Extremes
--Societal Impacts
--Snow and Ice
--Teleconnections
--Global Historical Climatological Network (GHCN) Monthly
--Monitoring-References
17 Sep 2015
Reading Assignment
Barry and Hall-McKim: Essentials of the Earth's Climate System
--Ch. 6 (Circulation Modes; pp 103-115)
Links
Web:ENSO:
ENSO comparison between 1997 and 2015
Teleconnections:
AO and NAO
NAO: Columbia
NAO: CPC
NAO Images
AO: NCDC
AO: Wunderground
AO: CPC
AO Images
PNA: North Carolina State University
PNA: NCDC
PNA: CPC
PNA Images
PDO: North Carolina State University
PDO: COMET
PDO: NCDC
PDO Images
AAO: CPC
AAO: OSS
AAO Images
SOI: North Carolina State University
SOI: NASA
SOI: OSS
SOI: NCAR/UCAR
SOI Images
EPO: CPC
EPO Images
WPO: ESRL/NOAA/PSD
WPO Images
Real-Time NAO/PNA/WPO/EPO Forecasts: NOAA/ESRL/PSD
General Teleconnection Source: Watt's up with that
24 Sep 2015
Reading Assignment
Barry and Hall-McKim: Essentials of the Earth's Climate System
--
Links
Web:Climate Reanalyzer
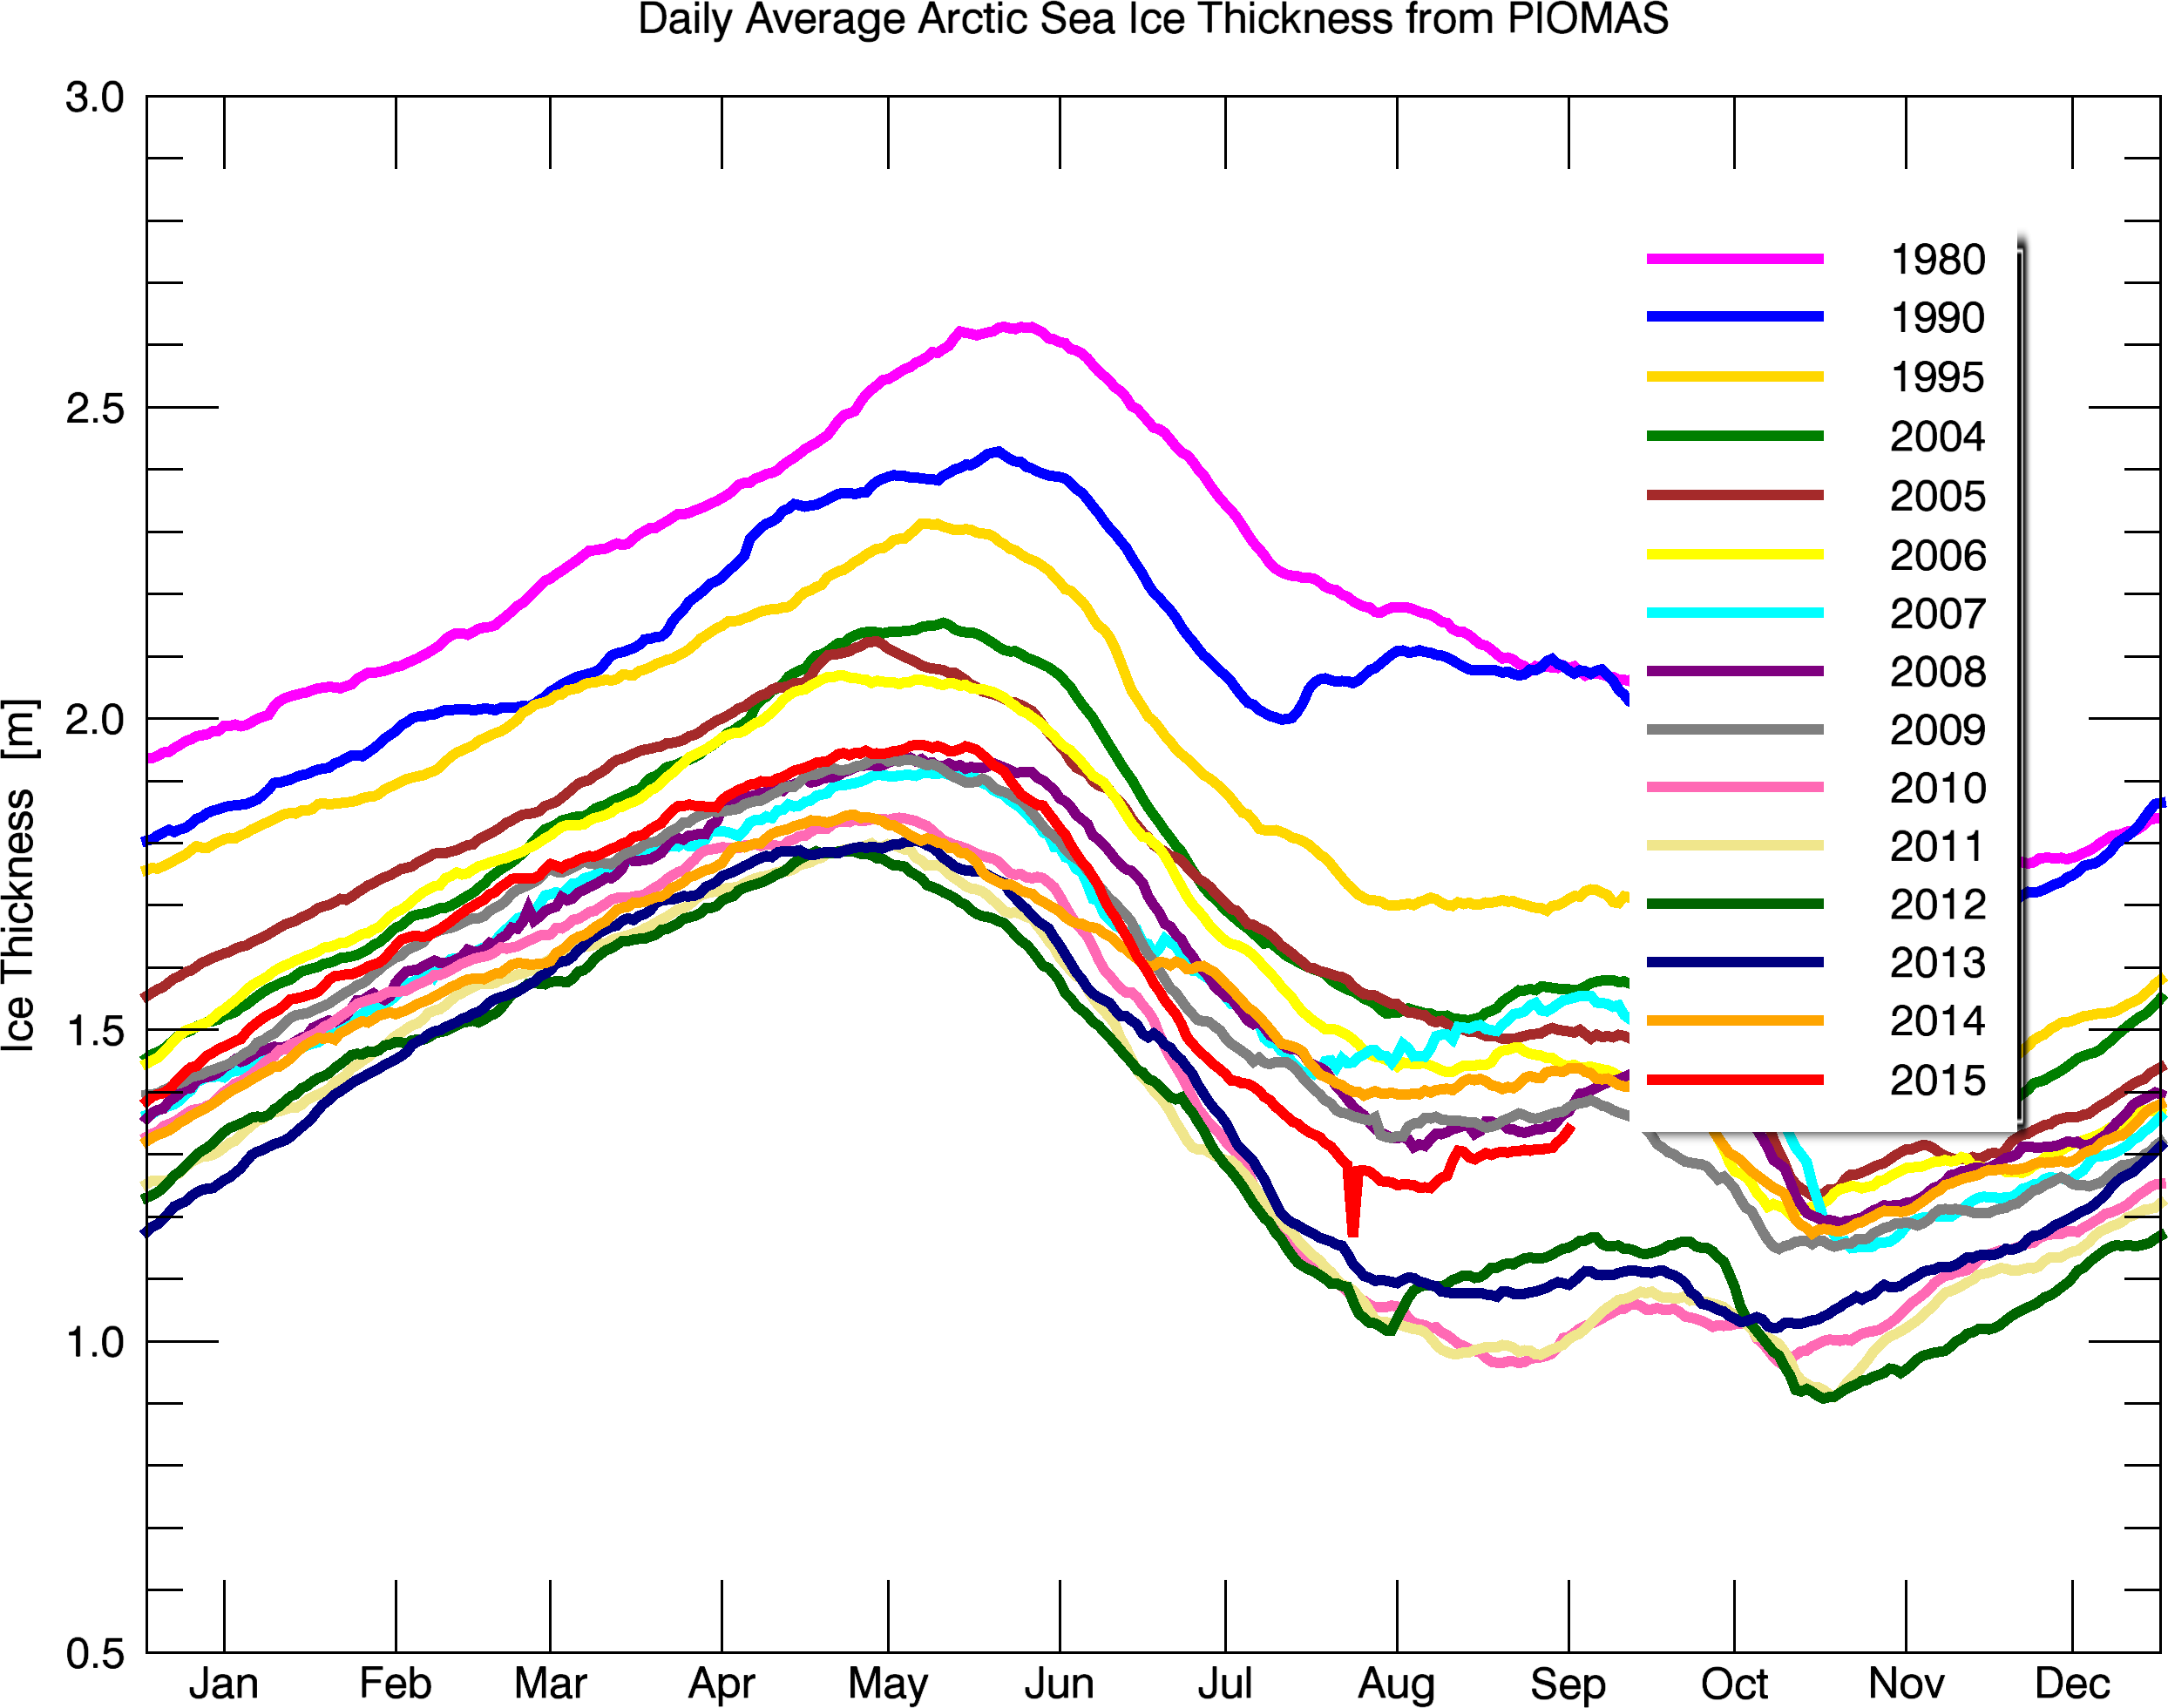
Arctic Sea Ice Volume
--Ice thickness time sereis per year
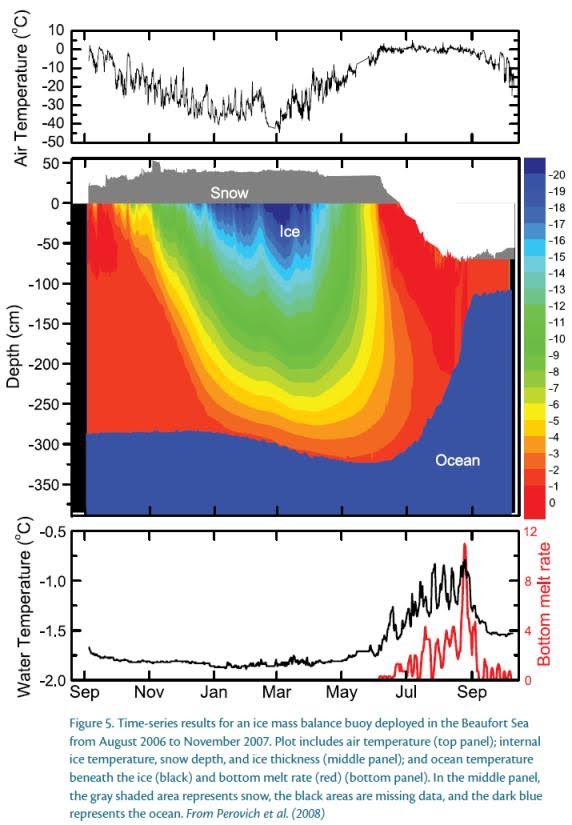
--Fig.5 from Perovich et al. (2008)- Time sereis of air temperature (top), snow depth and ice depth (middle), and ocean temp below ice and melt rate (bottom) [From Jiping]
World Clock
Kepler's Laws of Motion
--Youtube Video
The Analemma
Indicies: NAO, PNA, PDO, SOI, AAO
NAO
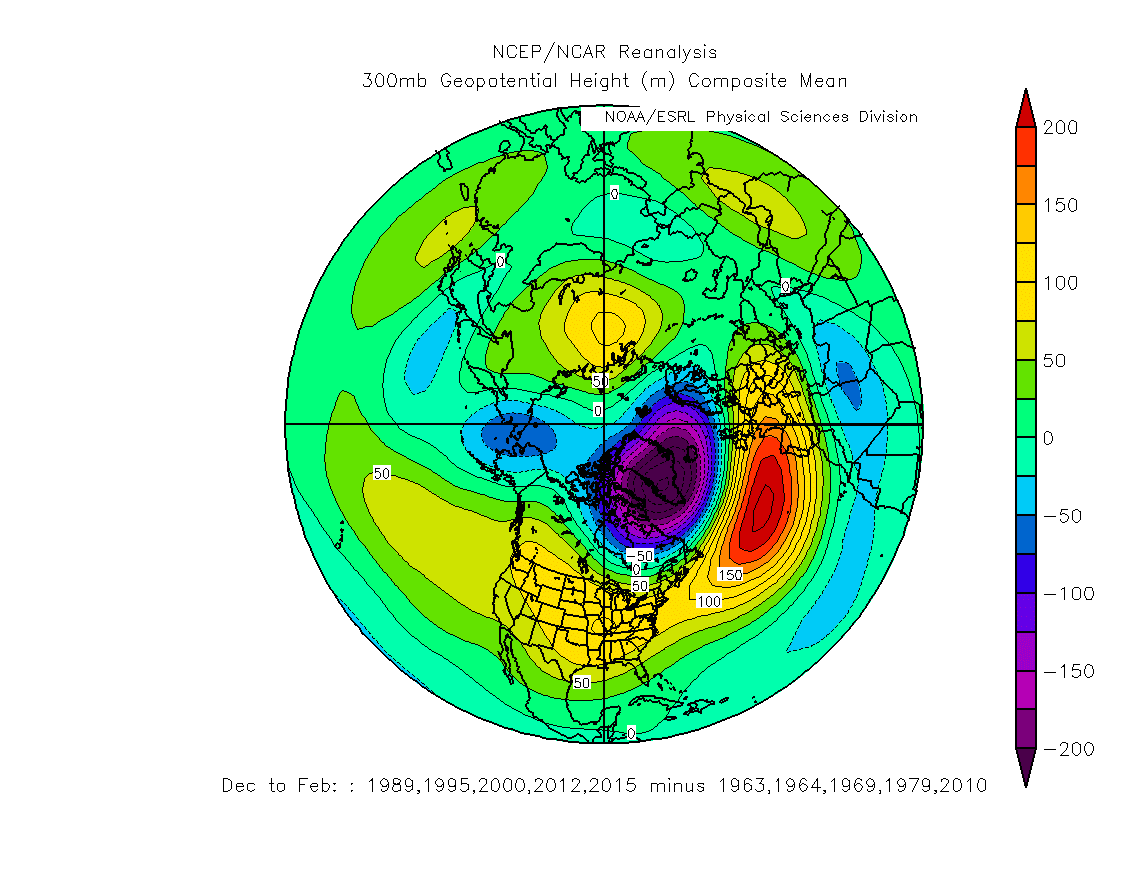
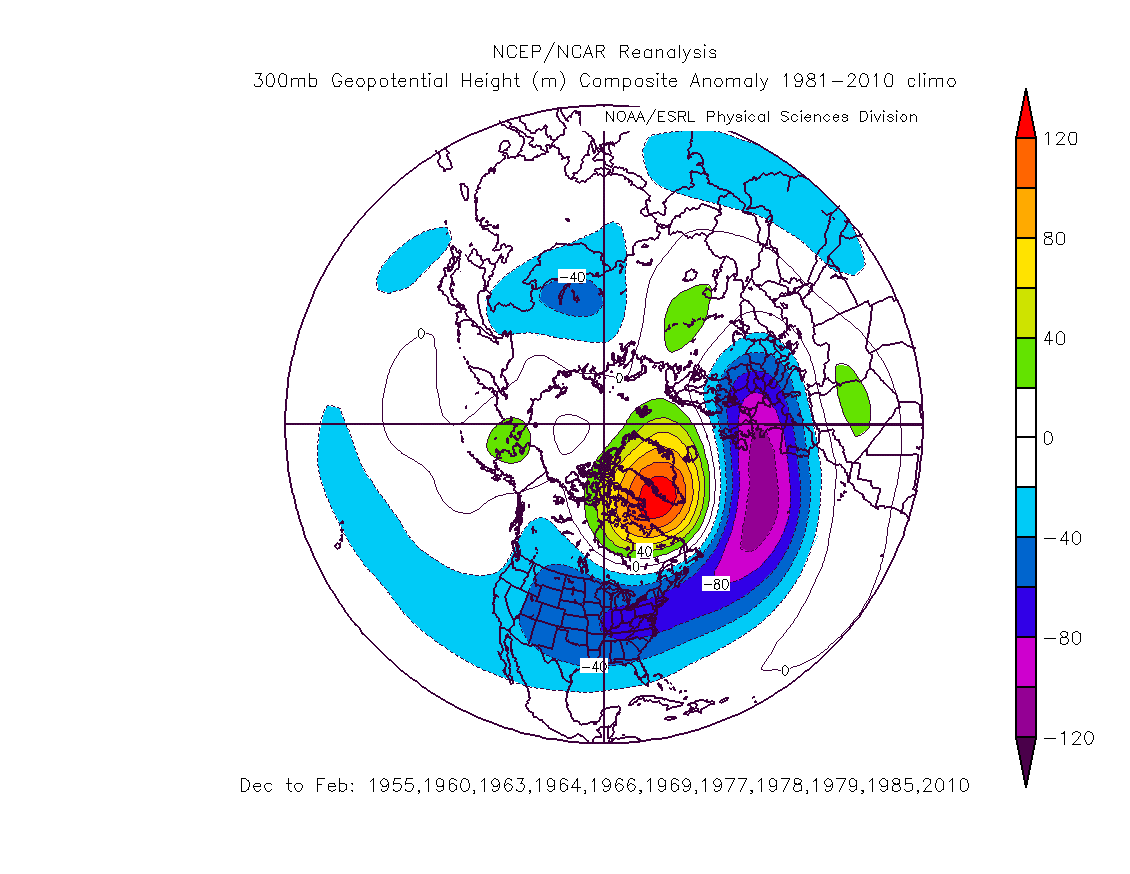
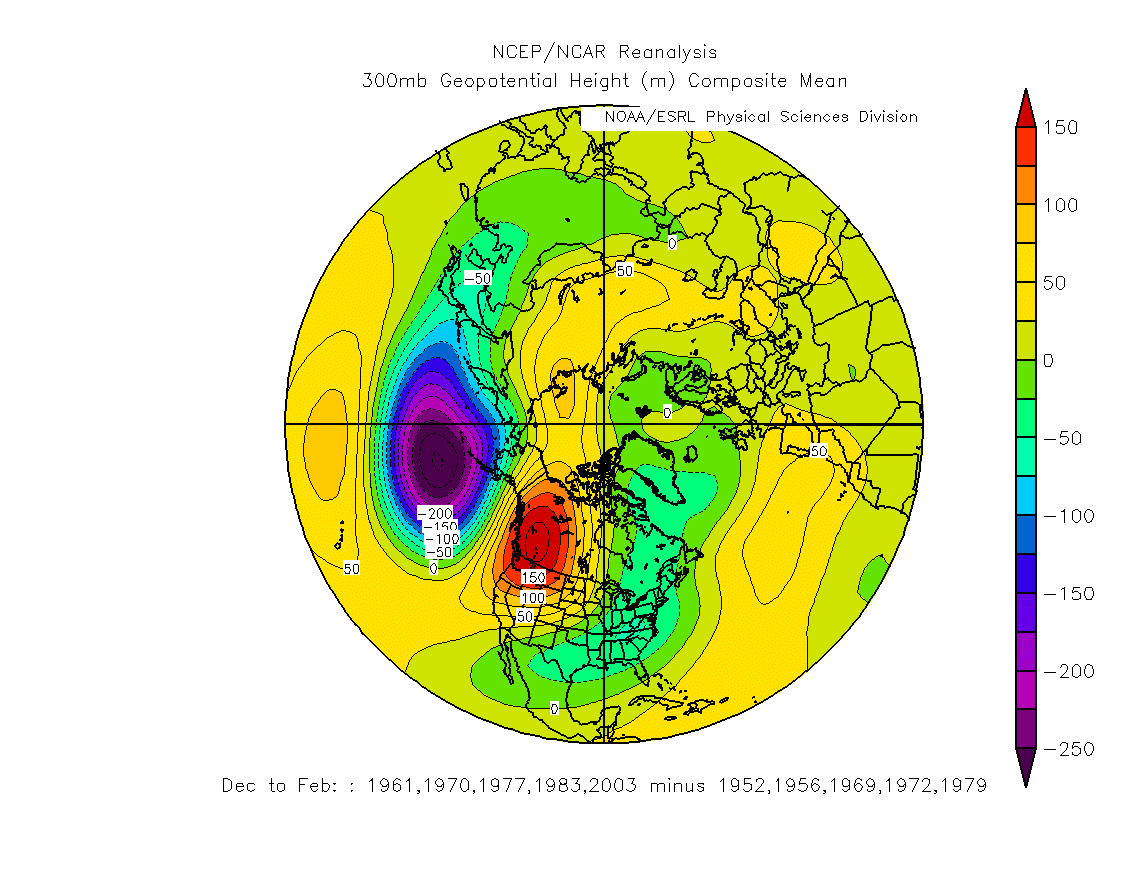
Difference 300-hPa Heights of of 5 highest and 5 lowest NAO years: DJF
Correlation of 300-hPa Geopotential Height w/ NAO: DJF
Correlation of 300-hPa Geopotential Height w/ NAO: JJA
300-hPa Geopotential Height w/ NAO > 1 sigma: DJF
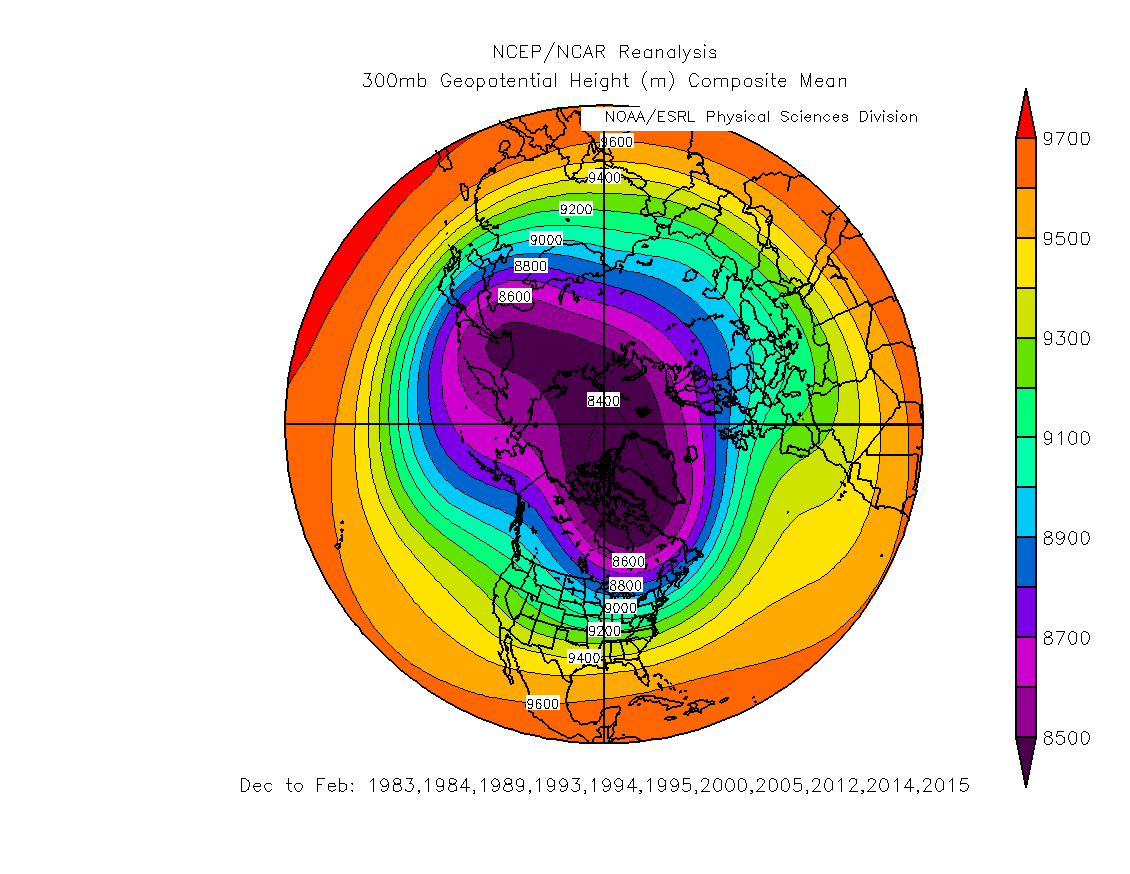
300-hPa Geopotential Height w/ NAO < -1 sigma: DJF
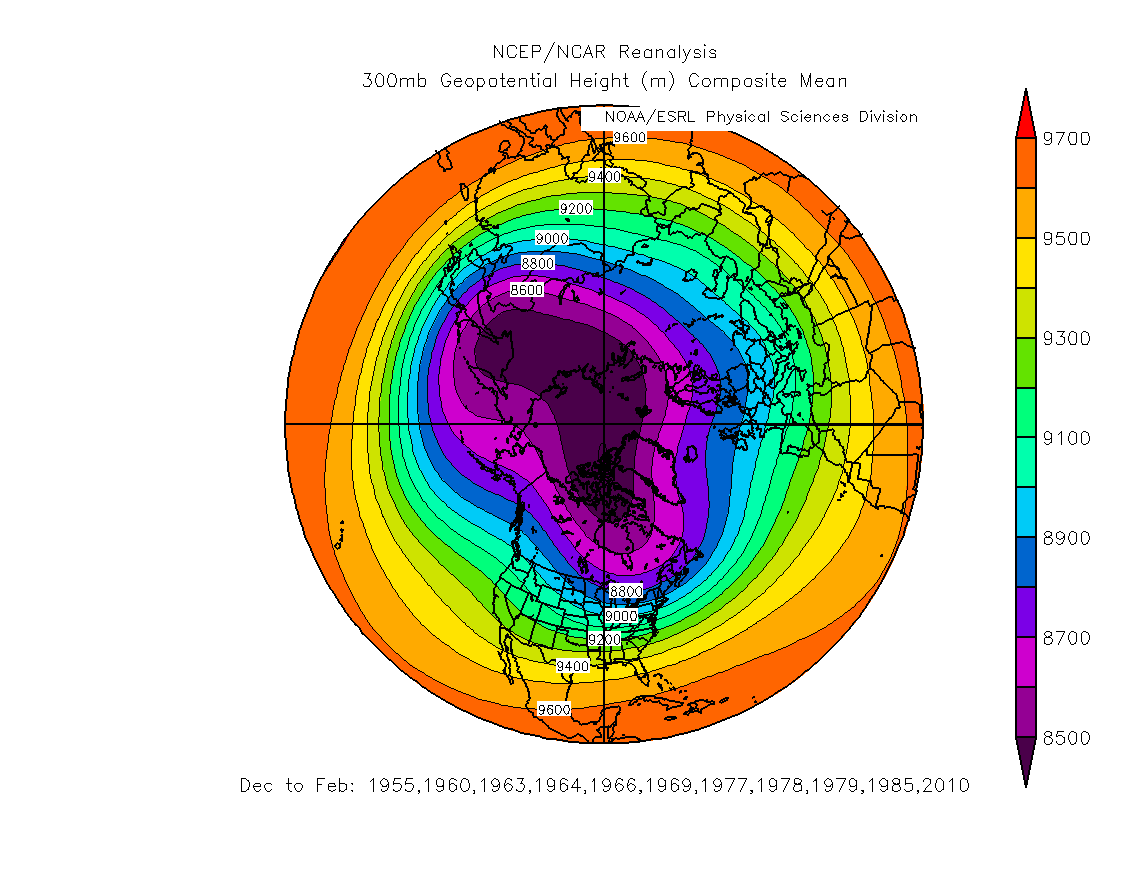
300-hPa Geopotential Height Anomalies w/ NAO > 1 sigma: DJF
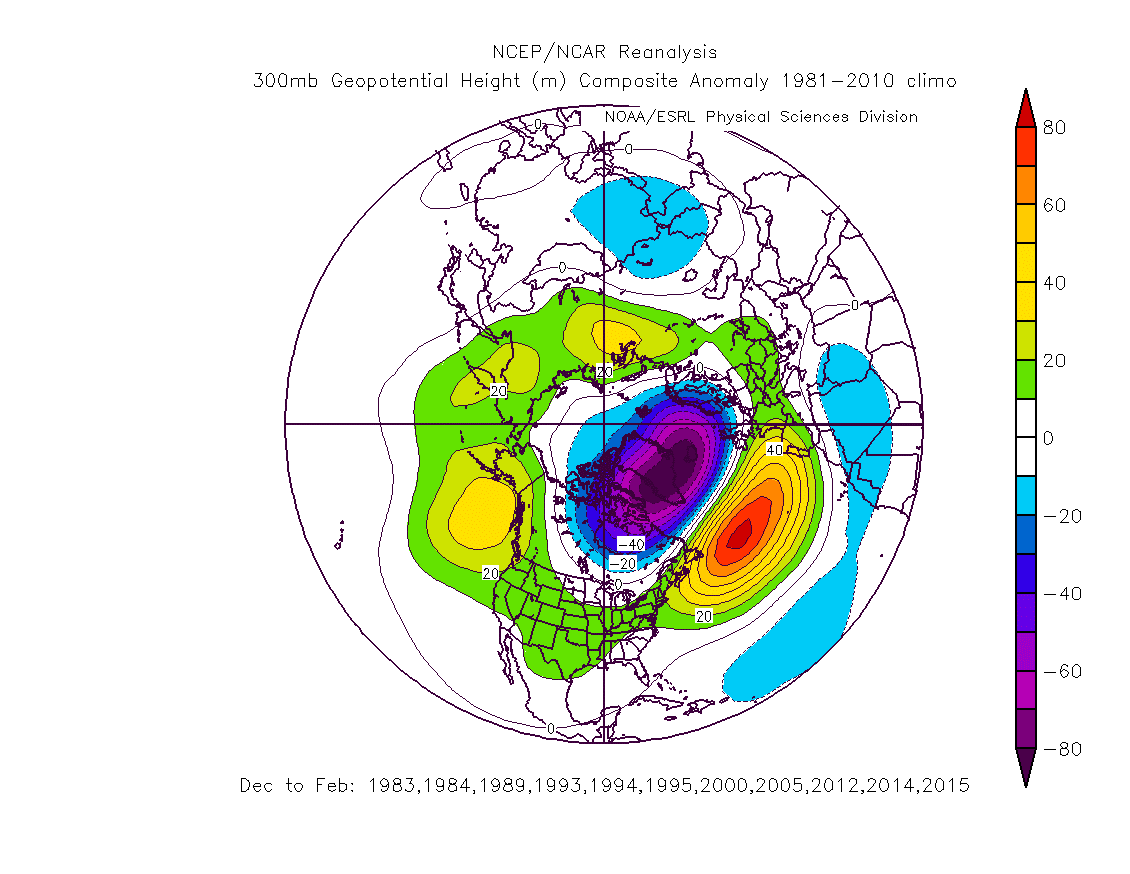
300-hPa Geopotential Height Anomalies w/ NAO < -1 sigma: DJF
Correlation of 850-hPa Temperature w/ NAO: DJF
Correlation of 850-hPa Temperature w/ NAO: JJA
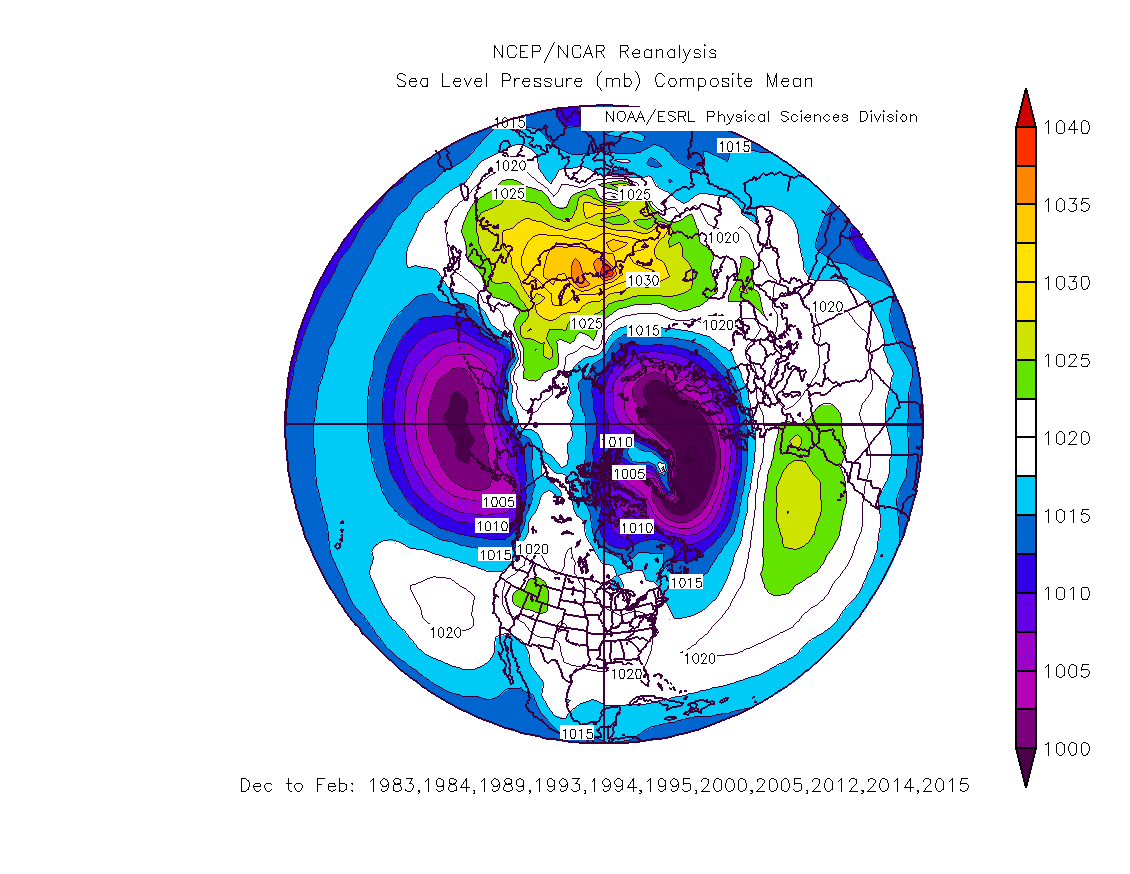
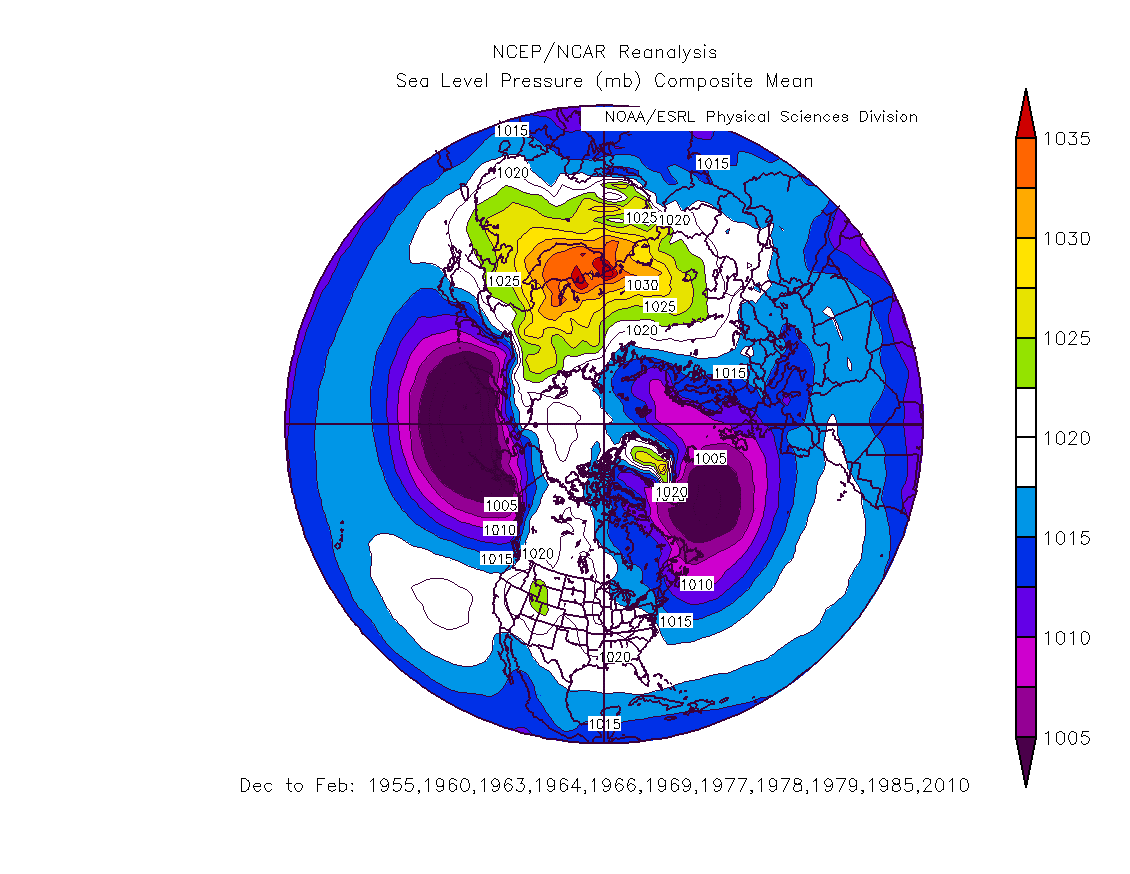
Sea Level Pressure w/ NAO > 1 sigma: DJF
Sea Level Pressure w/ NAO < -1 sigma: DJF
Sea Level Pressure Anomaly w/ NAO > 1 sigma: DJF
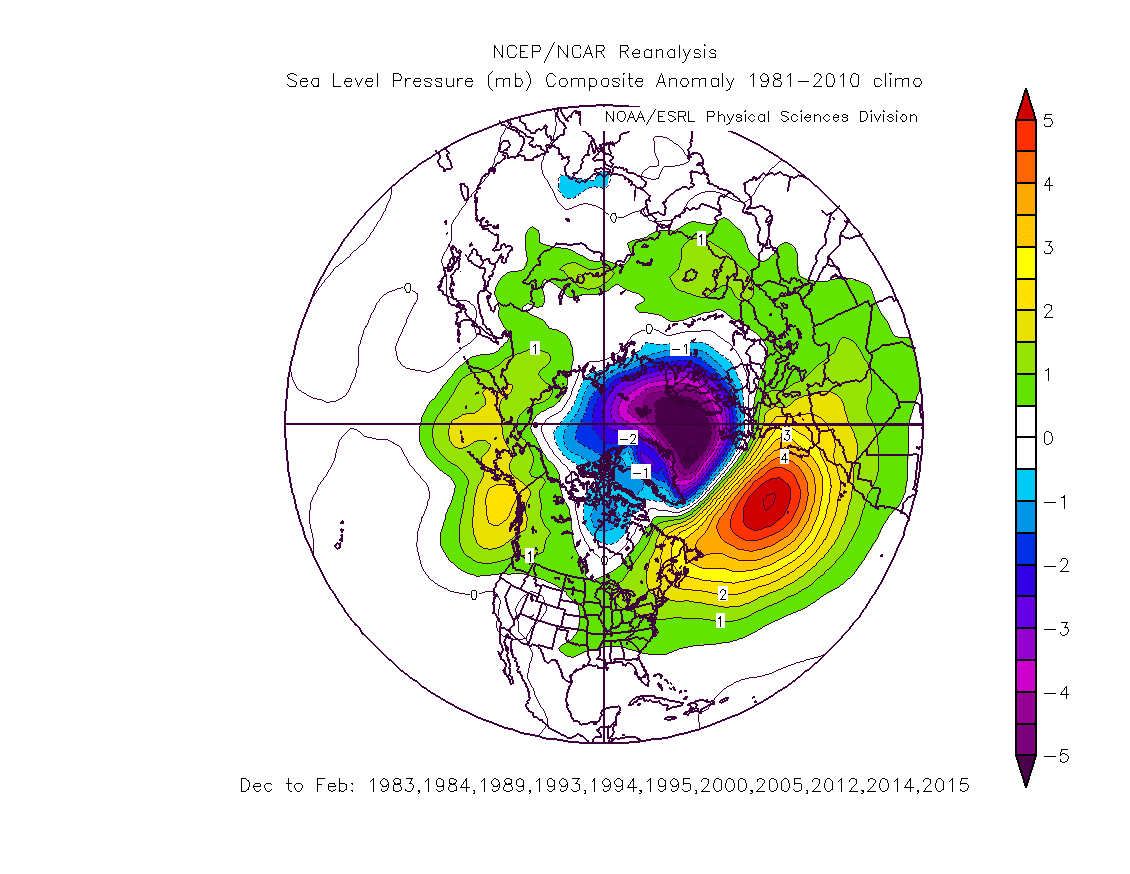
Sea Level Pressure Anomaly w/ NAO < -1 sigma: DJF
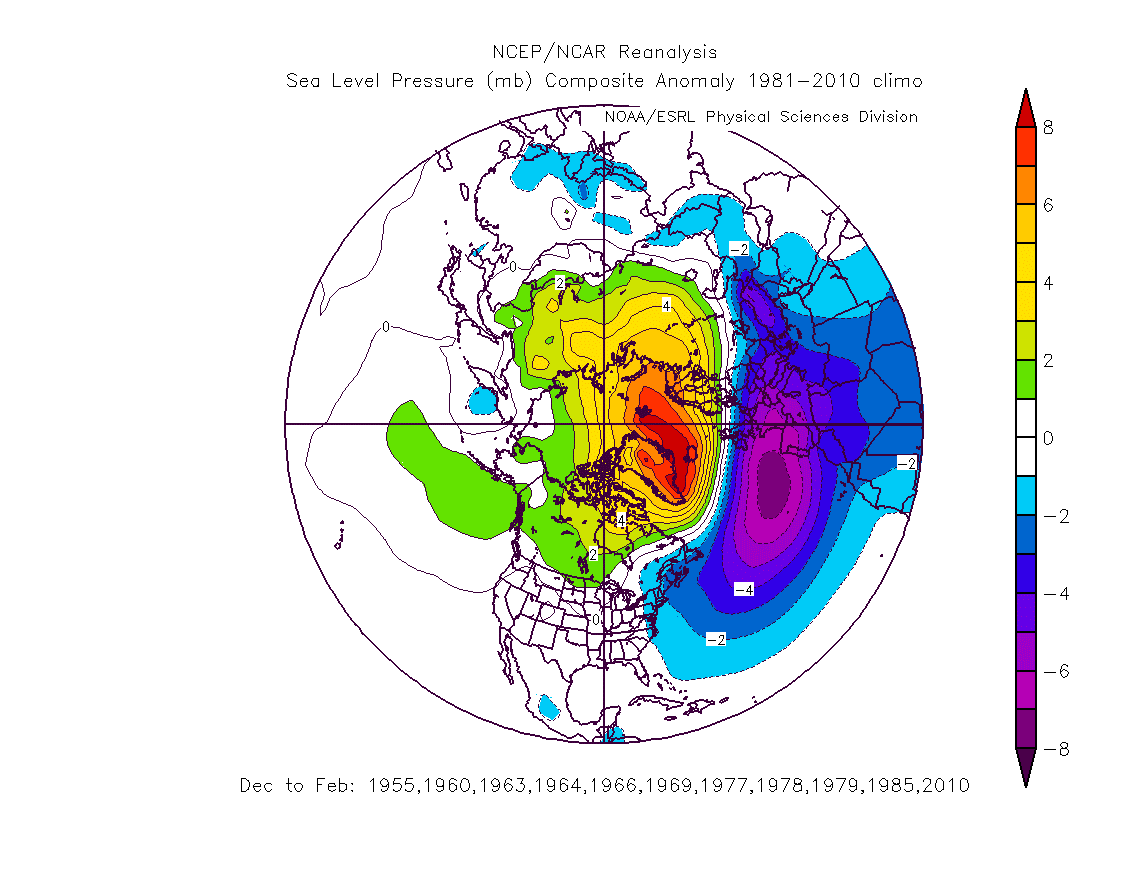
AO
300-hPa Geopotential Height w/ AO : DJF
300-hPa Geopotential Height w/ AO : JJA
PNA
Difference 300-hPa Heights of of 5 highest and 5 lowest PNA years: DJF
Correlation of 300-hPa Geopotential Height w/ PNA: DJF
Correlation of 300-hPa Geopotential Height w/ PNA: JJA
Correlation of 850-hPa Temperature w/ PNA: DJF
Correlation of Sea Level Pressure w/ PNA: DJF
PDO
Correlation of 300-hPa Geopotential Height w/ PDO: DJF
Correlation of 300-hPa Geopotential Height w/ PDO: JJA
SOI
Correlation of 300-hPa Geopotential Height w/ SOI: DJF
Correlation of 300-hPa Geopotential Height w/ SOI: JJA
Correlation of Sea Level Pressure w/ SOI: DJF
Correlation of 850-hPa Temperature w/ SOI: DJF
AAO
Correlation of 300-hPa Geopotential Height w/ AAO: DJF
Correlation of 300-hPa Geopotential Height w/ AAO: JJA
29 Sep 2015
Reading Assignment
Barry and Hall-McKim: Essentials of the Earth's Climate System
--Ch. 2 pp. 14-29. (Radiation Basics)
Links
Web:See Links From 24 Sep
1 Oct 2015
Reading Assignment
Barry and Hall-McKim: Essentials of the Earth's Climate System
--Ch. 2 pp. 14-29. (Radiation Basics)
Quiz #1 Given
Links
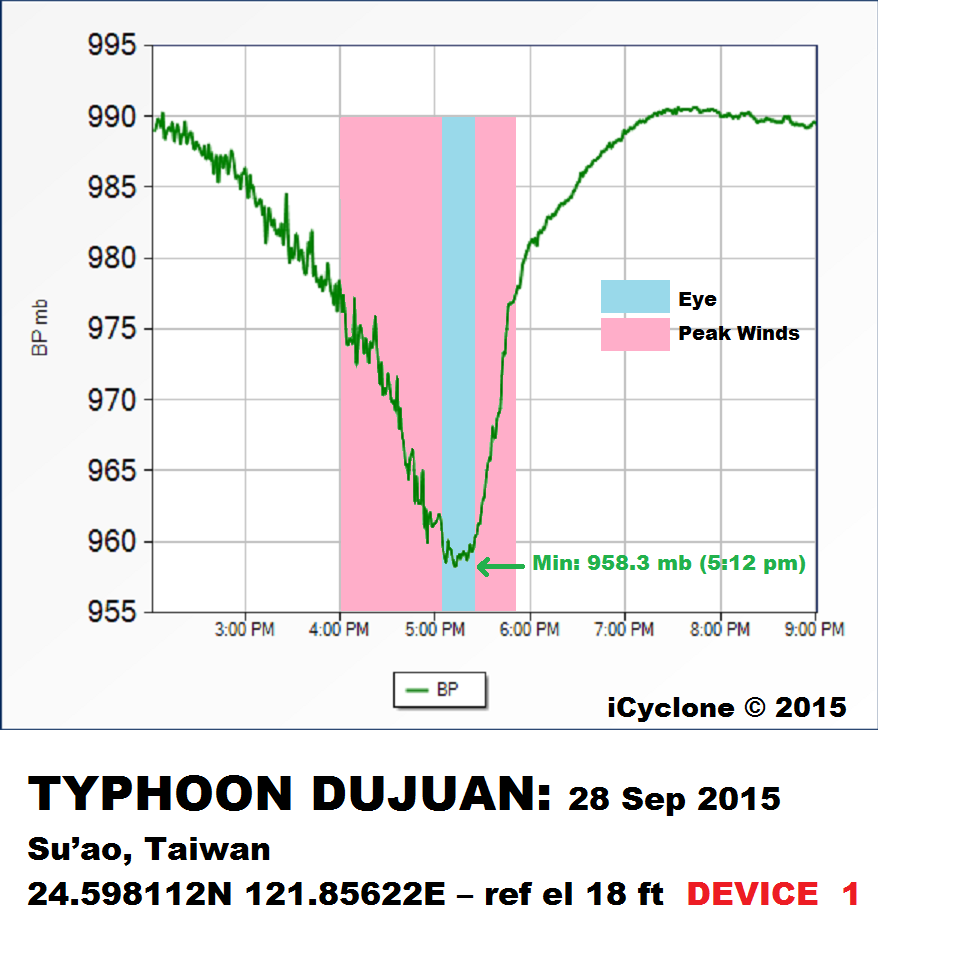
Web:Radar Reflectivity animation of Typhoon Dujan impacting Taiwan
Sea Level Pressure trace from TC Dujuan
Comparison of ENSO 1997 versus 2015
6 Oct 2015
Reading Assignment
Barry and Hall-McKim: Essentials of the Earth's Climate System
--Ch. 2 pp. 14-29. (Radiation Basics)
Links
Web:The Atacama Surface Solar Maximum: Rondanelli et al. (2015)
8 Oct 2015
Went over radiation basics through Stefan Boltzmann Law. Discussion of Rondanelli et al. (2015), The Atacama Surface Solar Maximum
Reading Assignment
Barry and Hall-McKim: Essentials of the Earth's Climate System
--Ch. 2 pp. 14-29. (Radiation Basics)
Links
Web:The Atacama Surface Solar Maximum: Rondanelli et al. (2015)
13 Oct 2015
Reading Assignment
Barry and Hall-McKim: Essentials of the Earth's Climate System
--Ch. 2 pp. 14-29. (Radiation Basics)
Links
Web:Kirchhoff's Law of Thermal Radiation:
--Wikipedia
--Youtube Video
--Encyclopedia Britannica
Wien's Displacement Law:
--Hyper Physics Description
--Google Search
--Encyclopedia Britannica
Thermal Radiation and the Stefan-Boltzmann Equation:
--Youtube Video
--Encyclopedia Britannica
--Wikipedia
Inverse Square Law:
--Wikipedia
--Hyper Physics Description
--Google Search
Planck's Law:
--Wikipedia
--Wolfram Research Description
20 Oct 2015
Reading Assignment
Barry and Hall-McKim: Essentials of the Earth's Climate System
--Ch. 2 pp. 14-29. (Radiation Basics)
Presentation
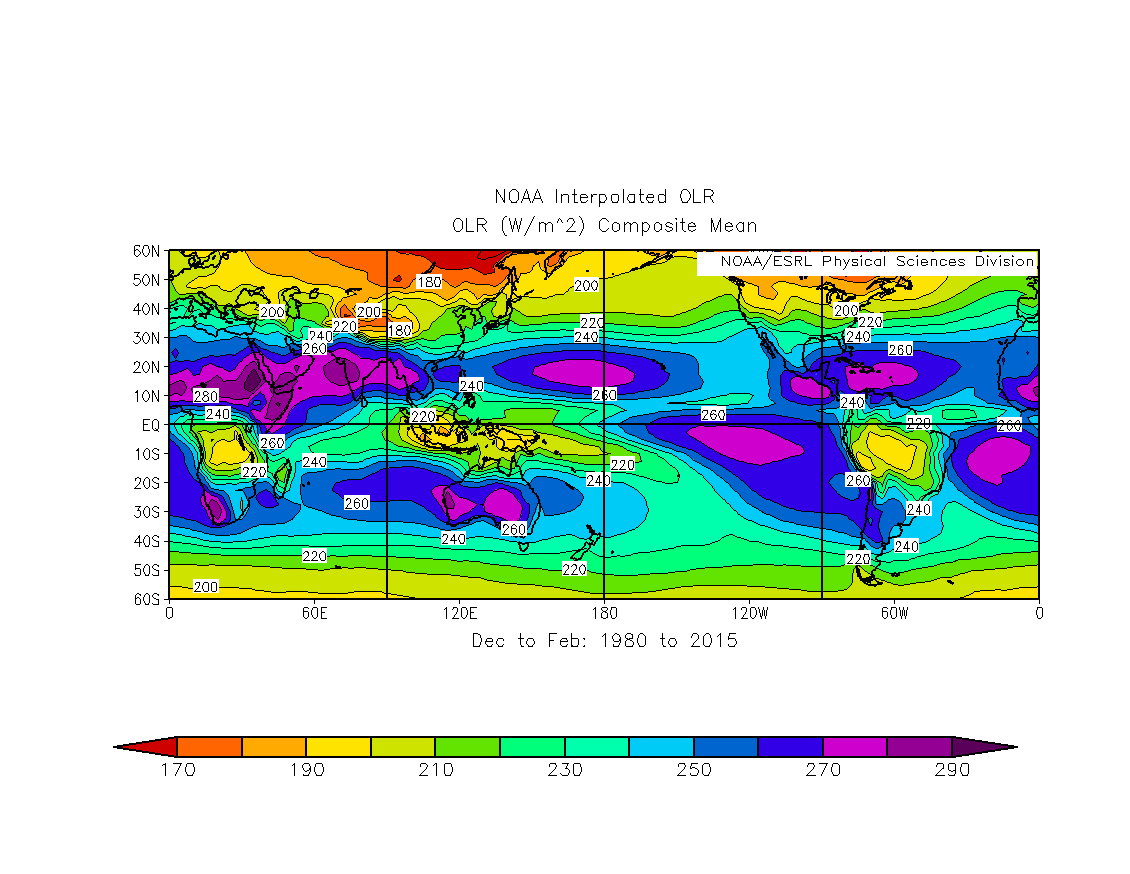
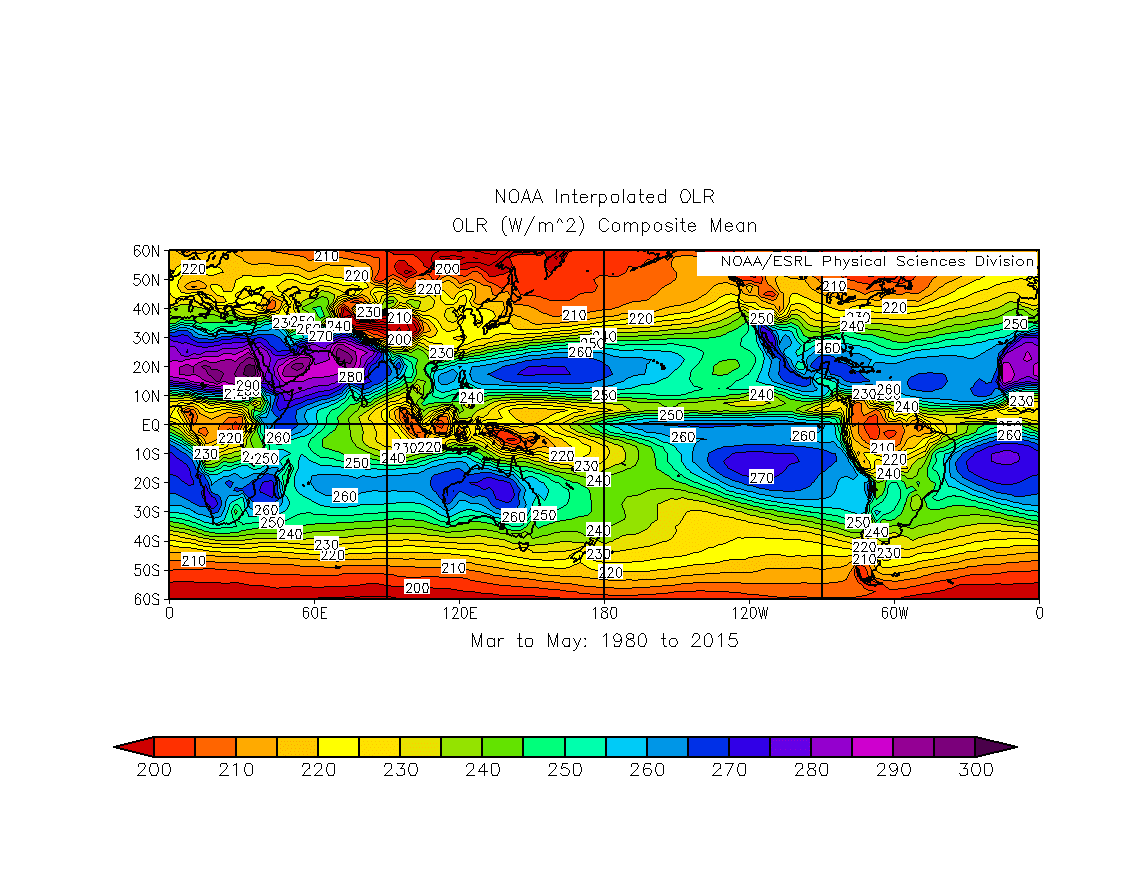
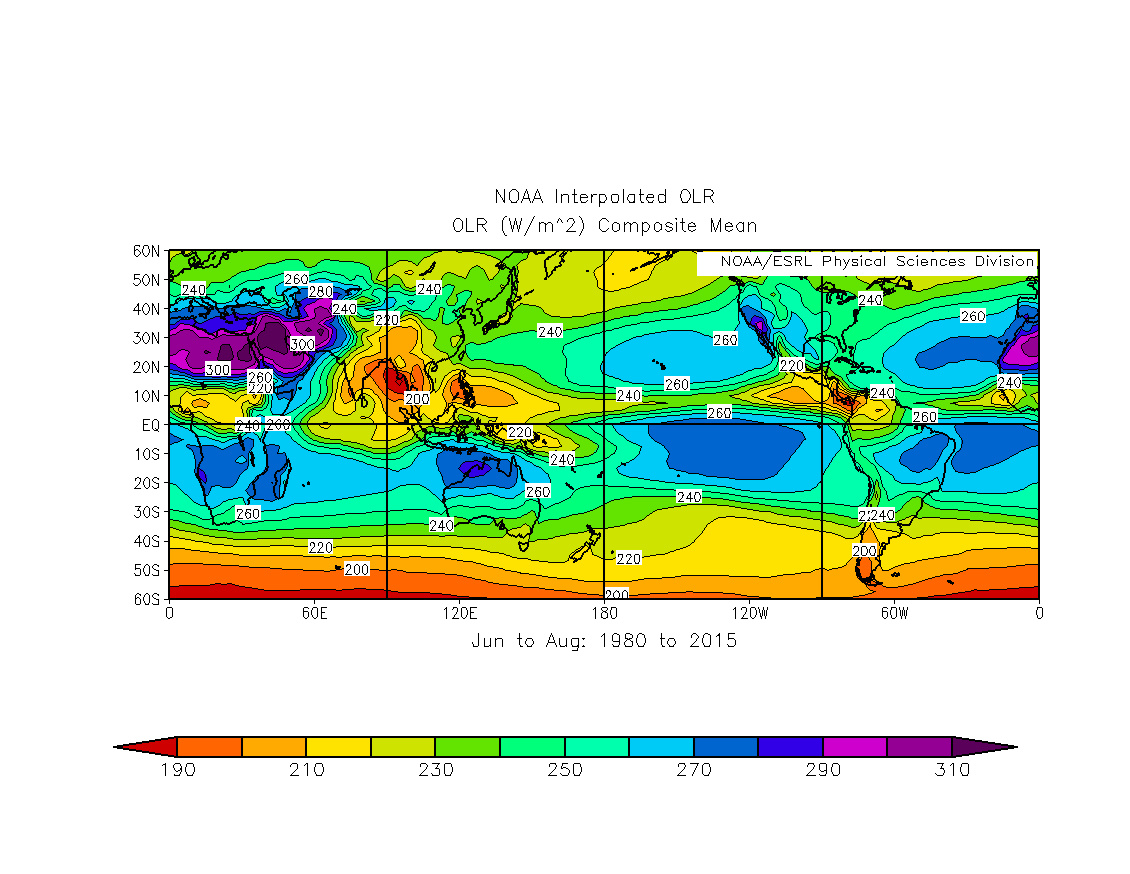
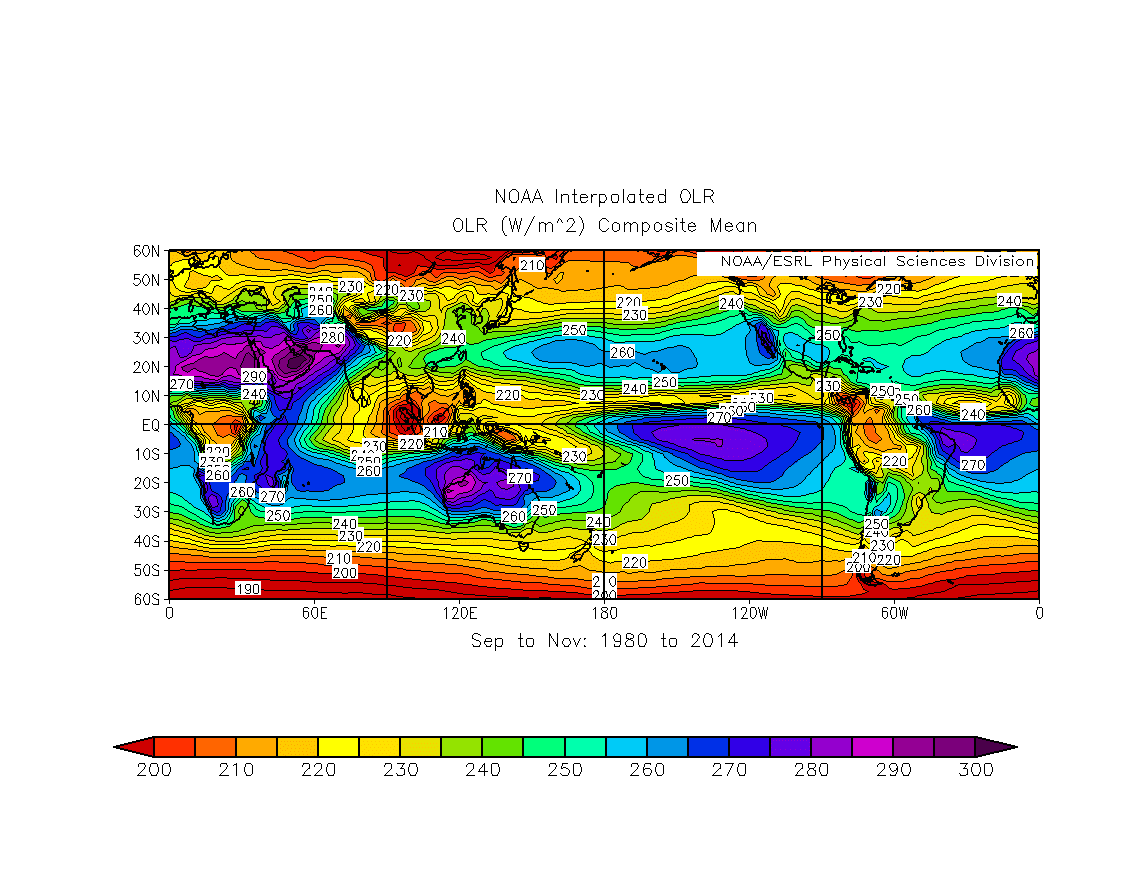
OLR Presentation
Links
Web:Example OLR Plot from Geostationary Satellite
Stefan-Boltzmann Law
Daily OLR: NOAA/ESRL
Monthly Mean OLR: NOAA/ESRL
Seasonal OLR Patterns
-OLR: DJF
-OLR: MAM
-OLR: JJA
-OLR: SON
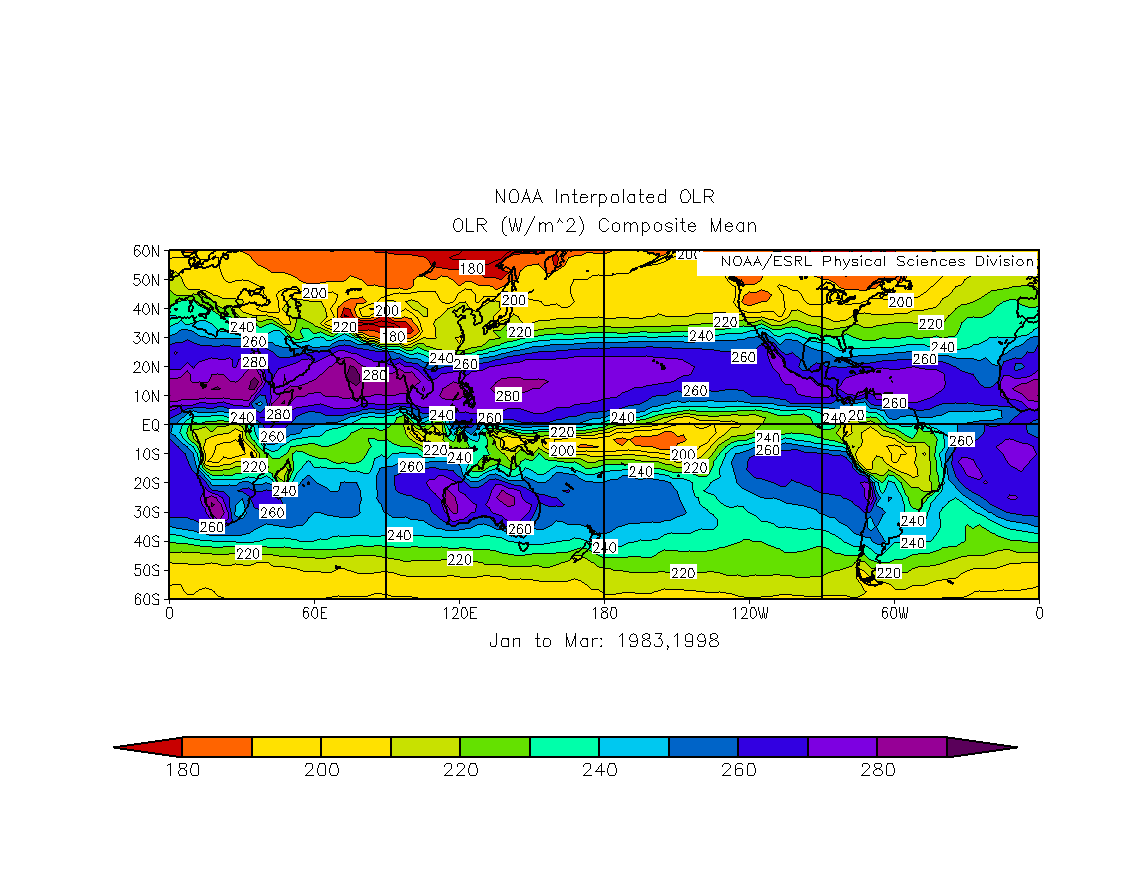
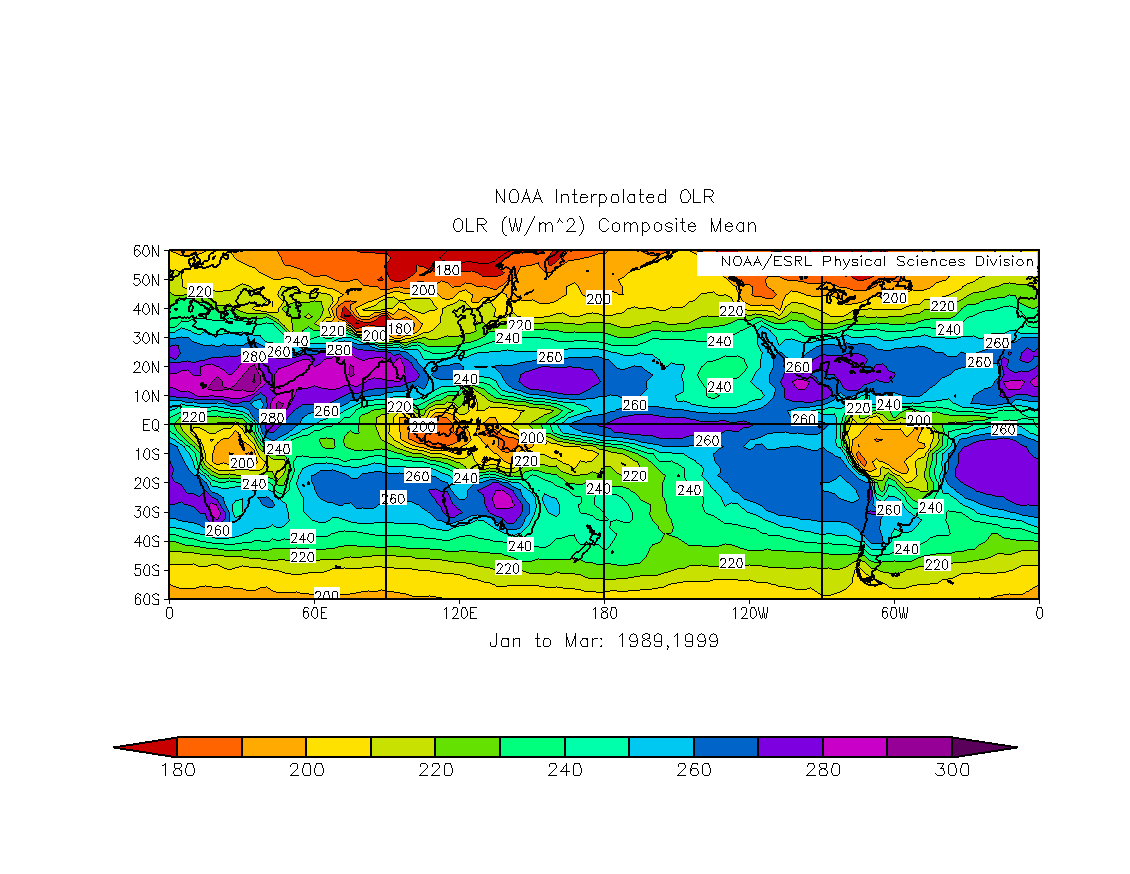
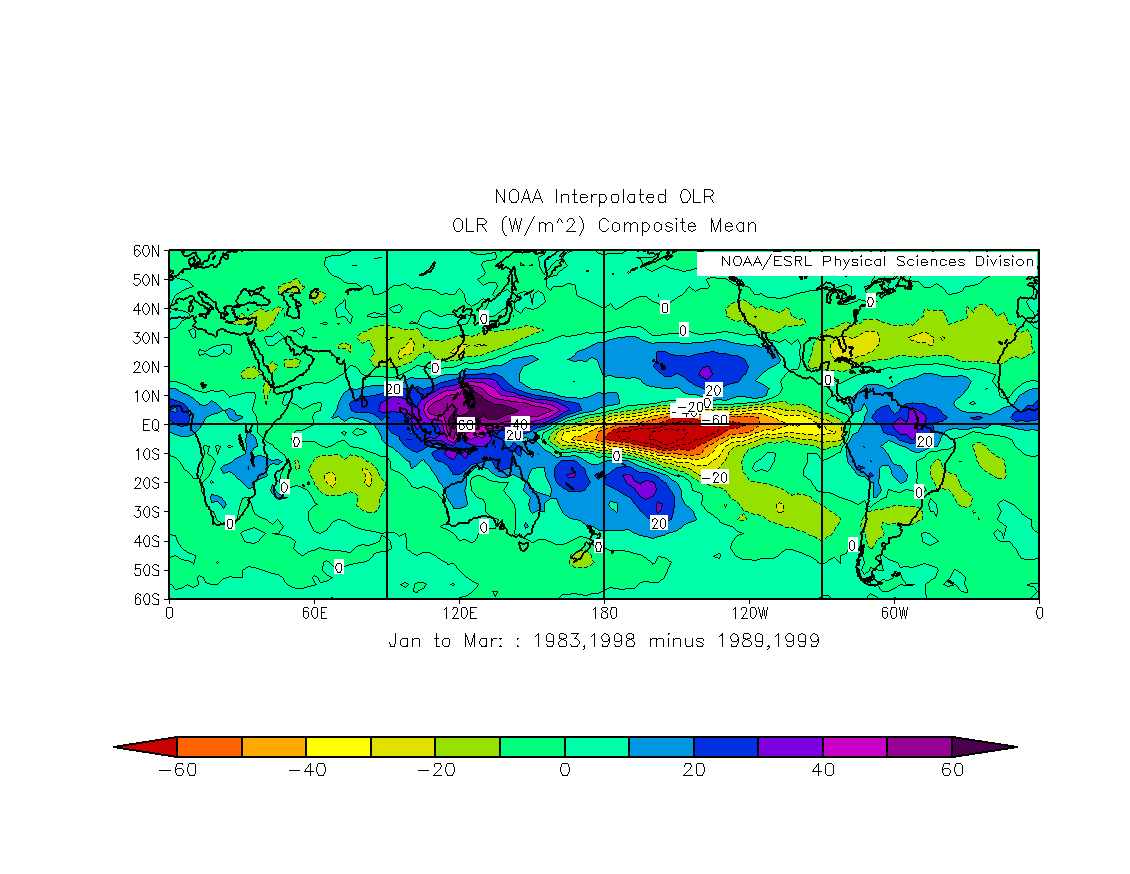
ENSO Impacts on OLR Patterns
-EL Nino OLR: 1983,1998 JFM
-La Nina OLR: 1989,1999 JFM
-Difference El Nino - La Nina: 1983,1998 minus 1989,1999 JFM
-Last Month Mean OLR Anomaly (El Nino-like)
22 Oct 2015
Reading Assignment
Barry and Hall-McKim: Essentials of the Earth's Climate System
--Ch. 2 pp. 14-29. (Radiation Basics)
Links
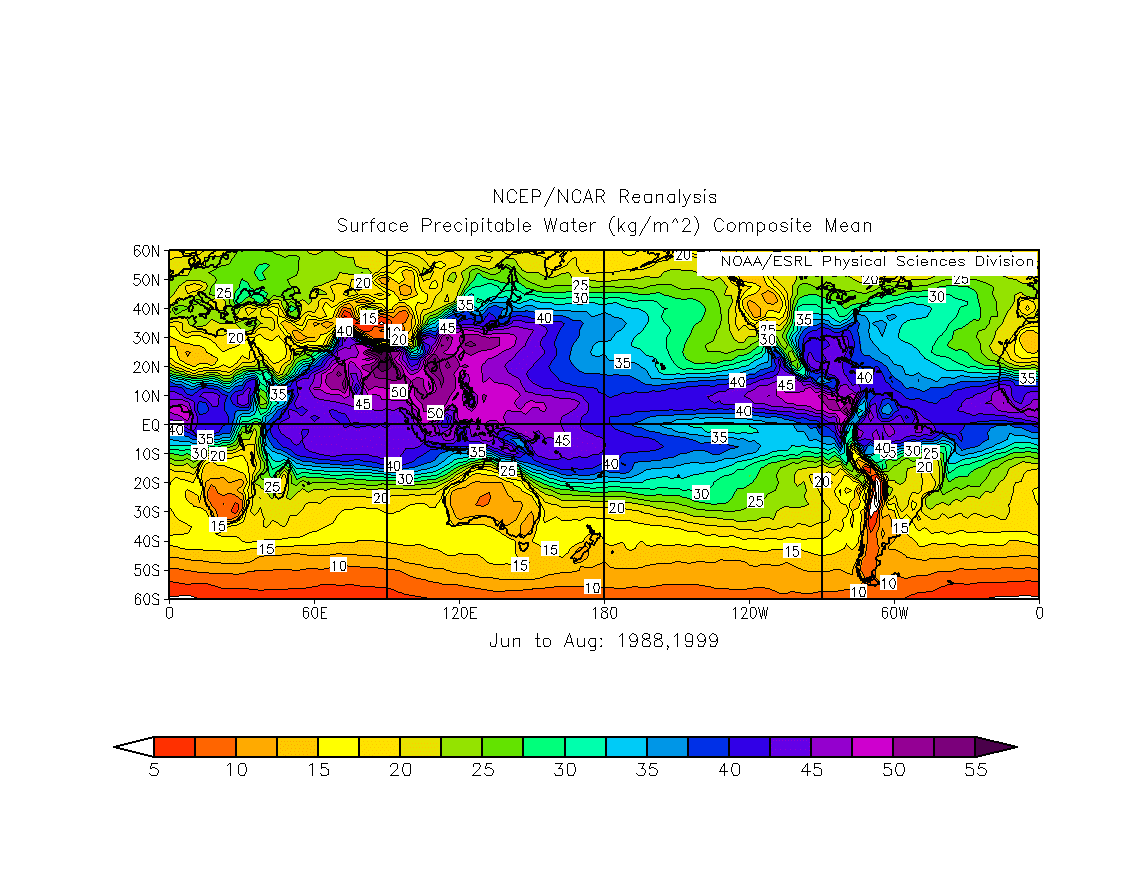
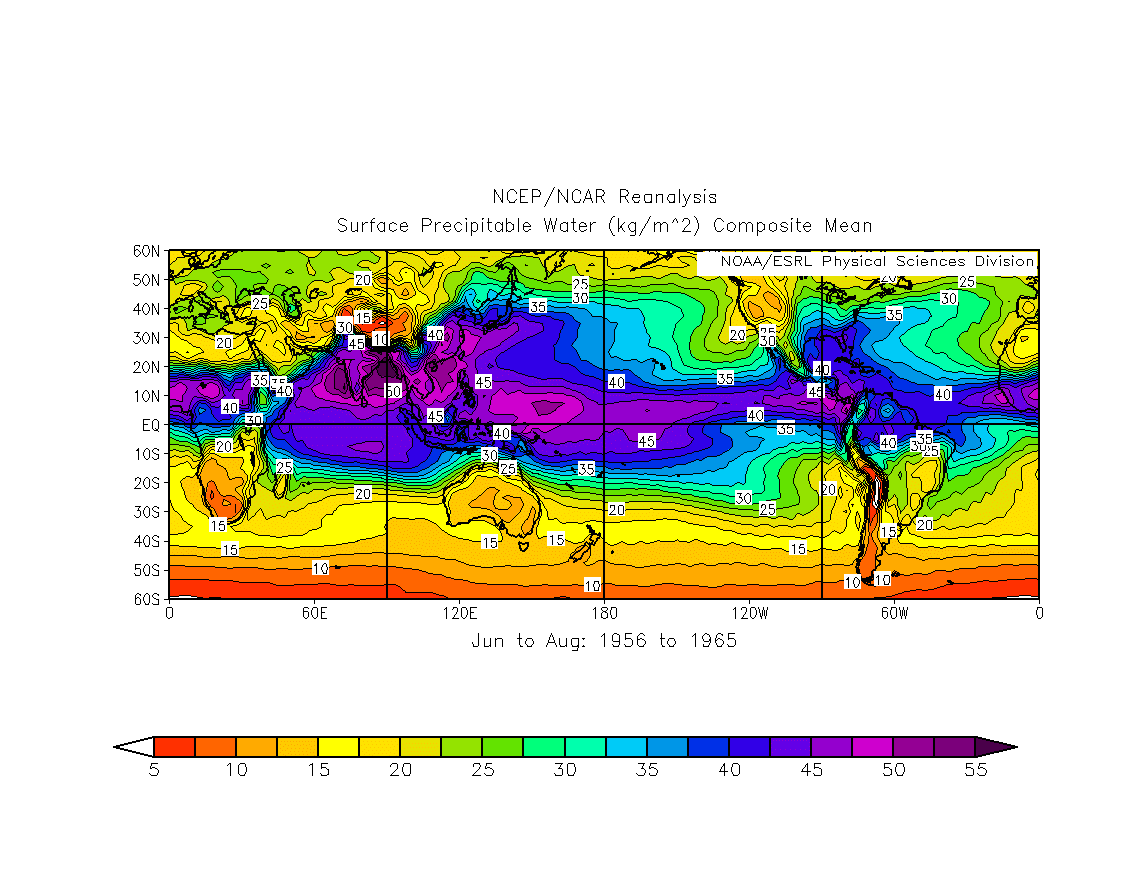
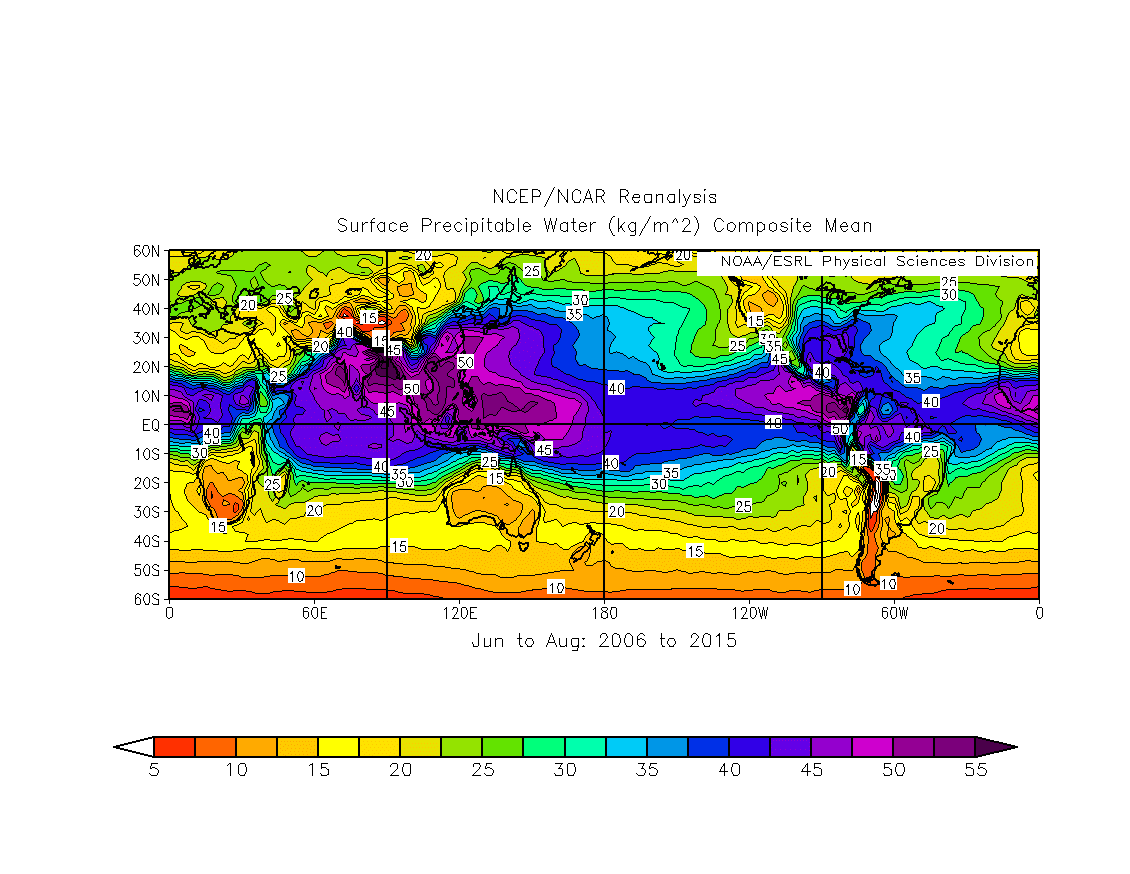
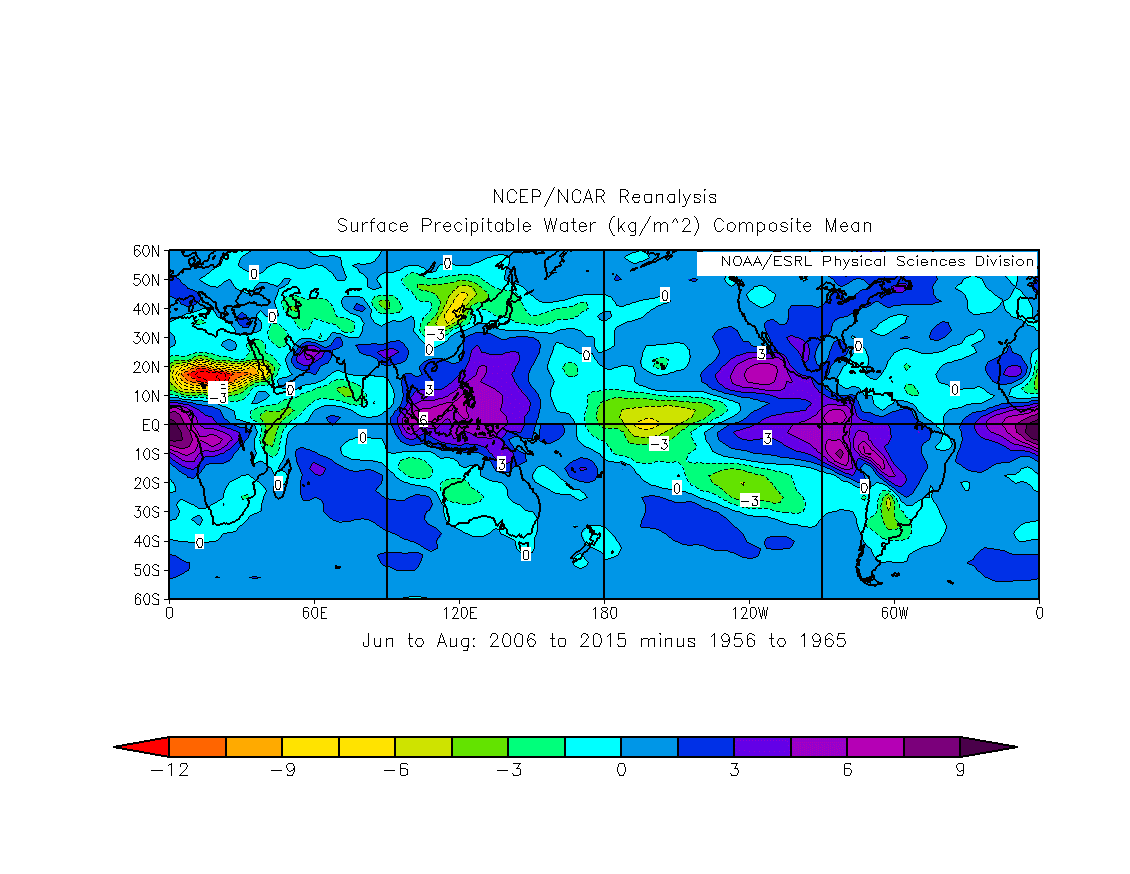
Web:Precipitable Water Patterns
-PW 1988-1989: JJA
-PW 1956-1965: JJA
-PW 2006-2015: JJA
-PW Difference (2006-2015) minus (1956-1965): JJA
MJO
Madden Julian Oscillation: CPC/NOAA
--MJO Summary
--Wikipedia
27 Oct 2015
Exam #1 Given by Proctor (Lance and Philippe were attending Cyclone Workshop at Asilomar)
29 Oct 2015
No Class (Lance and Philippe were attending Cyclone Workshop at Asilomar)
3 Nov 2015
Reading Assignment
Barry and Hall-McKim: Essentials of the Earth's Climate System
Ch. 3: The Elements of Climate (A Global View of Pressure, Winds, and Storms)
Ch. 6.11: The MJO
Links
Web:Global Sea Surface Temperatures (high resolution): NOAA OSPO
MJO Continuing discussion prior to Cyclone Workshop
Madden Julian Oscillation: CPC/NOAA
--MJO Summary
--Wikipedia
--"The Storm King" (article about The Madden Julian Oscillation): Science Oct 2015
5 Nov 2015
Continuing discussion on streamfunction and velocity potential (see your class notes)
Reading Assignment
Barry and Hall-McKim: Essentials of the Earth's Climate System
Ch. 3: The Elements of Climate (A Global View of Pressure, Winds, and Storms)
Ch. 6.11: The MJO
Links
Web:9 Nov 2015
Illustrated the differences in in streamfunction and velocity potential in El Nino vs. La Nina years.
Resumed discussion on the MJO, but now with added benefit of applying velocity potential thinking in order to explain global propagation around equator.
Reading Assignment
Barry and Hall-McKim: Essentials of the Earth's Climate System
Ch. 3: The Elements of Climate (A Global View of Pressure, Winds, and Storms)
Links
Web:--MJO Summary
--"The Storm King" (article about The Madden Julian Oscillation): Science Oct 2015
10 Nov 2015
Started with overview of Exam #1 (problems with multiple choice short essays)
Continue discussion on MJO (low-level fields), and looking at the latest MJO discussion from the CPC
Finished up by looking at the latest ENSO discussion from the CPC
HW#3 Due; HW#4 Announced
Reading Assignment
Barry and Hall-McKim: Essentials of the Earth's Climate System
Ch. 6.11: The MJO
Ch. 6.2: ENSO and the Southern Oscillation
Links
Web:MJO Information From the Climate Prediction Center
Main Page--Discussion ppt:MJO Evolution 9 Nov 2015
--Discussion pdf:MJO Evolution 9 Nov 2015
ENSO Information From the Climate Prediction Center
Main Page--Discussion ppt:ENSO Evolution 9 Nov 2015
--Discussion pdf:ENSO Evolution 9 Nov 2015
12 Nov 2015
Finished up by looking at the latest MJO/ENSO discussion from the CPC
Started on statistics notes covering: Wind, Standardization, Correlation, and Regression
Reading Assignment
Links
Web:PPT: Statistics Presentation
PDF: Statistics Presentation
--Southern Oscillation Index (application of Standardized Anomalies): NCDC
--Global Precipitation Time Series (application of CFDs): CPC
--Video explaining Least Squares Fit
--Interactive tool to show how Least Squares Fit Regression Works
--Correlation Plot Example
--Regression Plot Example
17 Nov 2015
Reading Assignment
Links
Web:Skewed Temperature Distributions: Scott Runion
--Full Presentation
Martin, J. E., 2015: Contraction of the Northern Hemisphere, Lower-Tropospheric, Wintertime Cold Pool over the Past 66 Years. J. Clim., 28, 3764-3778. PDF
Anantha Aiyyer's 1000-500 hPa thickness climatology (HDSC - NWS - NOAA)
Protected File: 1000-500 hPa thickness trend over time (Eyad Atallah)
19 Nov 2015
Review of HW#3: Global Topography Maps
Reading Assignment
Links
Web:Global Climate Analysis - October 2015: NCDC
State of the Climate: NCDC
24 Nov 2015
EXAM #2 Given
1 Dec 2015
Review of Exam #2 and HW #5.
Finish Discussion of Martin (2015)
Links
Web:Martin, J. E., 2015: Contraction of the Northern Hemisphere, Lower-Tropospheric, Wintertime Cold Pool over the Past 66 Years. J. Clim., 28, 3764-3778. PDF
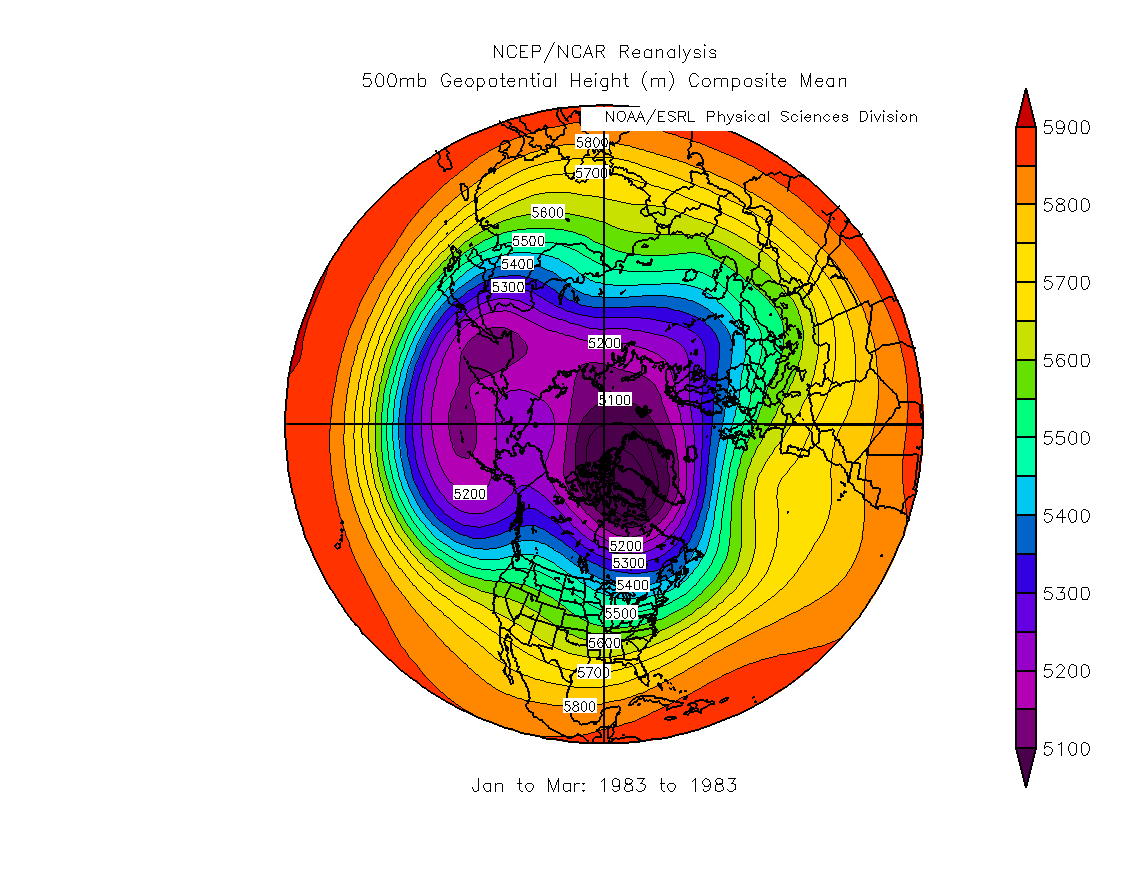
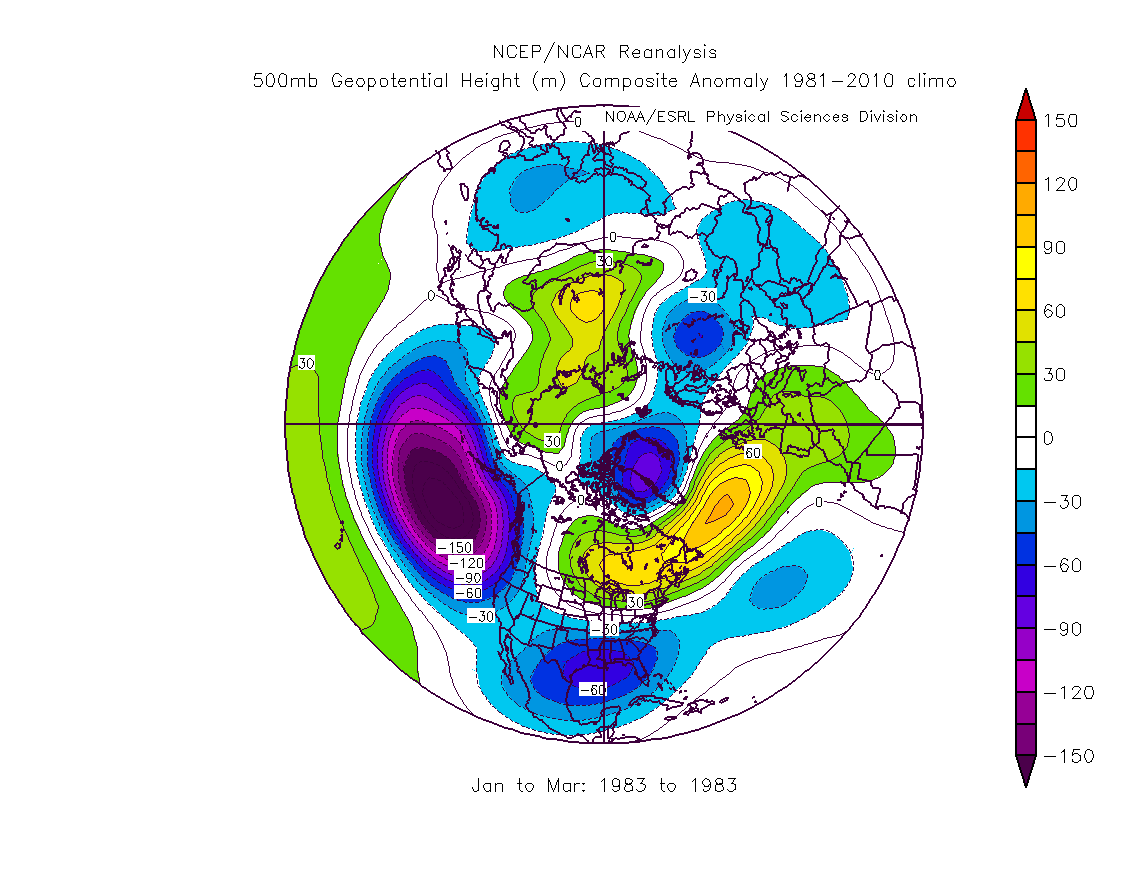
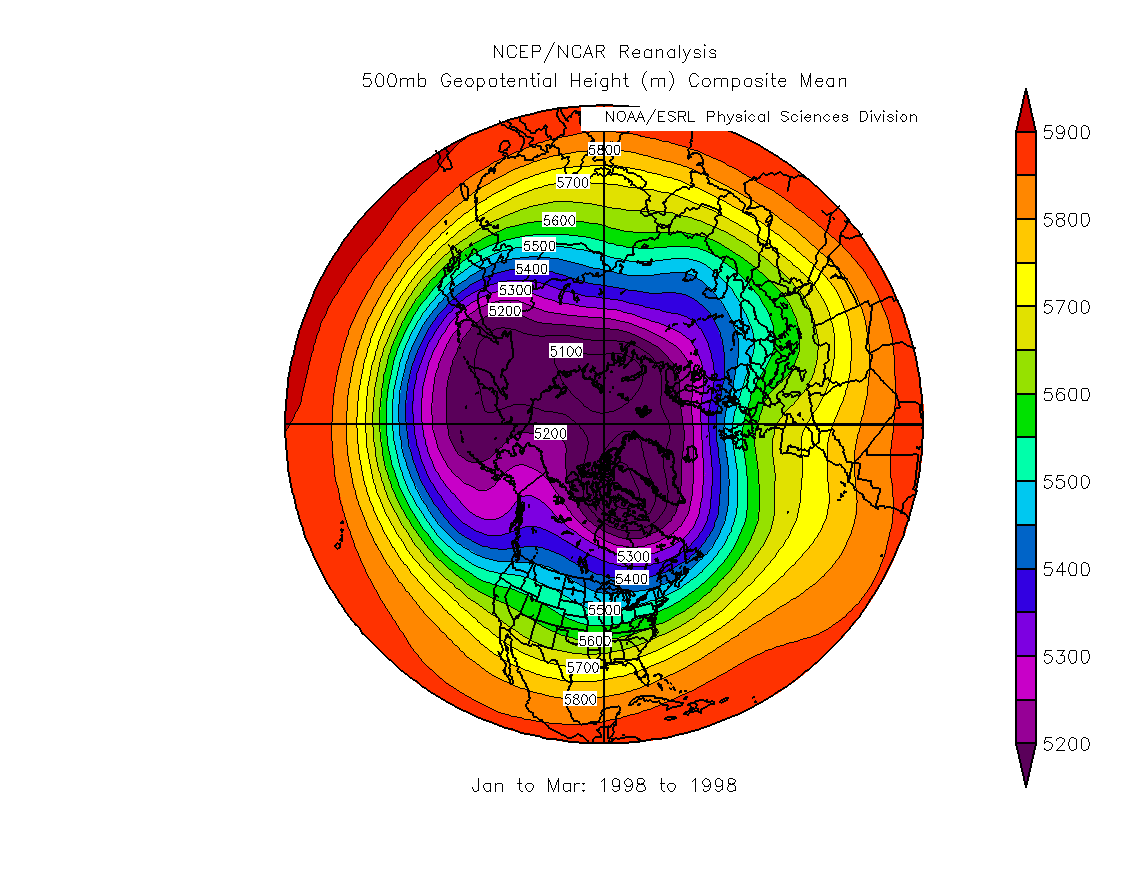
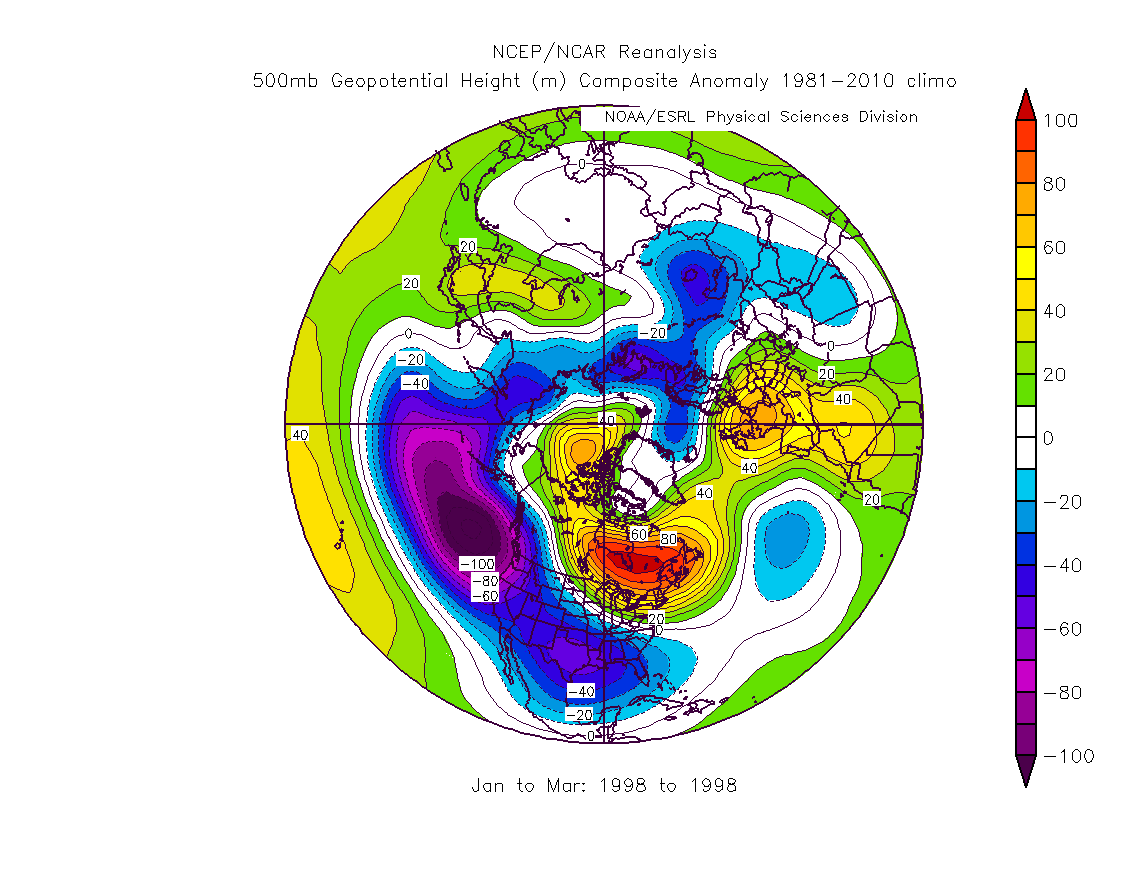
ENSO (1983 and 1998)
500hPa Geopotential Height: JFM (1983)
500hPa Geopotential Height Anomalies: JFM (1983)
500hPa Geopotential Height: JFM (1998)
500hPa Geopotential Height Anomalies: JFM (1998)
Thanksgiving Ice Storm: TX/OK/KS
2m Temperature, 10m Wind, Radar Reflecticity: Oklahoma Mesonet
250 hPa standardized height anomalies: Kyle Griffin
1000 hPa standardized height anomalies: Kyle Griffin
850 hPa standardized temperature anomalies: Kyle Griffin
Asian Monsoon Climate Maps: Summer Asian Monsoon: ESRL
3 Dec 2015
Links
Concluded discussion of the Asian summer monsoon
Global climatology of closed (850/200 hPa) anticyclones (after Galarneau et al. 2008)
High Plains summer drought vs. wet years (1998 vs. 1993)
UK summer drought vs. wet years (1976 vs. 2007)
CONUS record heat: Southwest (June 1994) and Midwest (July 1954)
8 Dec 2015
Links
Summer 2010 Pakistan floods and Russia/China heat wavesLa Reunion Island world record rains
Orographic influences on precipitation
Taiwan (TCs)
~~~~
Relief Map of SE Asia/Taiwan
~~~~
Relief Map of Taiwan
~~~~
Orographic influences on precipitation: Tyhpoons Sepat and Wipha (2007)
Kahasi Hills (Cherrapunji), India
~~~~ Topography of Bangladesh-Regional ~~~~ Topography of Cherrapunji (elevation ~ 1290 m) ~~~~ Cherrapunji Climate - en.allmetsat.comGreat Southern Plains rains of May 2015 (scroll to bottom)
NASA: A Year in the Life of Earth's CO2