import pyart;
import fsspec
from metpy.plots import USCOUNTIES, ctables
import matplotlib.pyplot as plt
import cartopy.crs as ccrs
import cartopy.feature as cfeature
import warnings
from datetime import datetime as dt
from datetime import timedelta
import matplotlib
matplotlib.rcParams['animation.html'] = 'html5'
from matplotlib.animation import ArtistAnimation
warnings.filterwarnings("ignore")
datTime = dt(2025,1,21,18)
year = dt.strftime(datTime,format="%Y")
month = dt.strftime(datTime,format="%m")
day = dt.strftime(datTime,format="%d")
hour = dt.strftime(datTime,format="%H")
timeStr = f'{year}{month}{day}{hour}'
site = 'KHDC'
fs = fsspec.filesystem("s3", anon=True)
pattern1 = f's3://noaa-nexrad-level2/{year}/{month}/{day}/{site}/{site}{year}{month}{day}_{hour}*V06'
pattern2 = f's3://noaa-nexrad-level2/{year}/{month}/{day}/{site}/{site}{year}{month}{day}_{hour}*V*.gz'
pattern3 = f's3://noaa-nexrad-level2/{year}/{month}/{day}/{site}/{site}{year}{month}{day}_{hour}*.gz'
files = sorted(fs.glob(pattern1))
if (len(files) == 0):
files = sorted(fs.glob(pattern2))
if (len(files) == 0):
files = sorted(fs.glob(pattern3))
if (len(files) == 0):
print ("There are no files found for this date and location. Either try a different date/site, \
or browse the NEXRAD2 archive to see if the file name uses a different pattern.")
radar = pyart.io.read_nexrad_archive(f's3://{files[0]}')
cLon, cLat = radar.longitude['data'], radar.latitude['data']
lonW = cLon - 2
lonE = cLon + 2
latS = cLat - 2
latN = cLat + 2
domain = lonW, lonE, latS, latN
res = '10m'
sweep = 0
def nexRadSweepTimeElev (radar, sweep):
sweepRayIndex = radar.sweep_start_ray_index['data'][sweep]
baseTimeStr = radar.time['units'].split()[-1]
baseTime = dt.strptime(baseTimeStr, "%Y-%m-%dT%H:%M:%SZ")
timeSweep = baseTime + timedelta(seconds=radar.time['data'][sweepRayIndex])
timeSweepStr = dt.strftime(timeSweep, format="%Y-%m-%d %H:%M:%S UTC")
elevSweep = radar.fixed_angle['data'][sweep]
elevSweepStr = f'{elevSweep:.1f}°'
return timeSweepStr, elevSweepStr
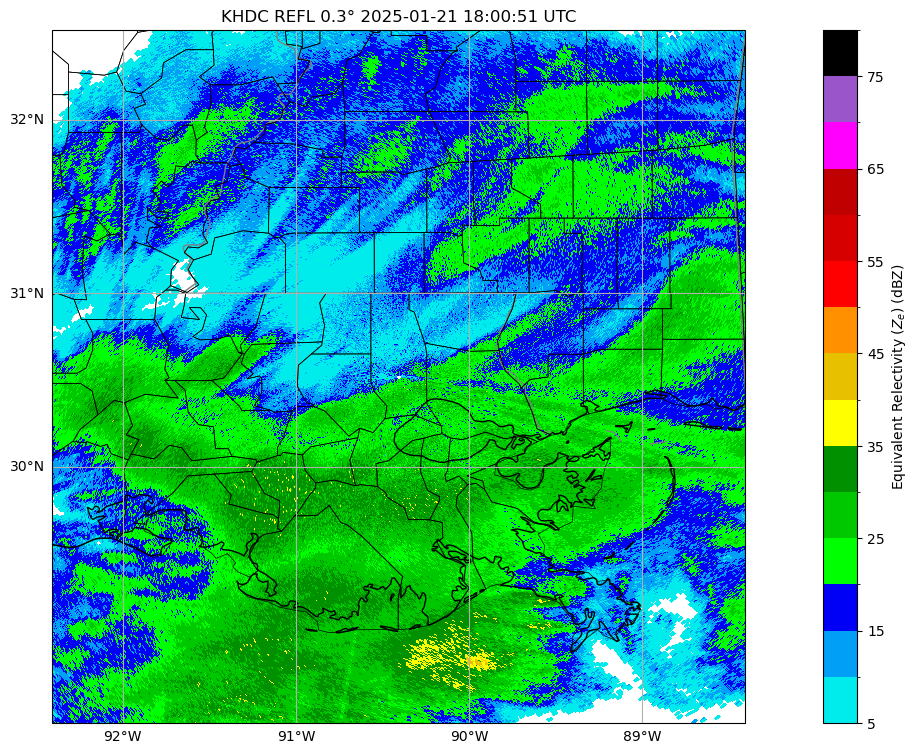
field = 'reflectivity'
shortName = 'REFL'
# Creating color tables for reflectivity (every 5 dBZ starting with 5 dBZ):
ref_norm, ref_cmap = ctables.registry.get_with_steps('NWSReflectivity', 5, 5)
# Call the function that creates the title string, among other things.
timeSweepStr, elevSweepStr = nexRadSweepTimeElev (radar, sweep)
titleStr = f'{site} {shortName} {elevSweepStr} {timeSweepStr}'
# Create our figure
fig = plt.figure(figsize=[20, 9])
# Set up a single axes and plot reflectivity
ax = plt.subplot(111, projection=ccrs.PlateCarree())
ax.set_extent ([lonW, lonE, latS, latN])
display = pyart.graph.RadarMapDisplay(radar)
ref_map = display.plot_ppi_map(field,sweep=sweep, vmin=20, vmax=80, ax=ax, raster=False, title=titleStr,
colorbar_label='Equivalent Relectivity ($Z_{e}$) (dBZ)', norm=ref_norm, cmap=ref_cmap, resolution=res)
# Add counties
ax.add_feature(USCOUNTIES, linewidth=0.5);