Week 7 overview
Contents
Week 7 overview
Learning Objectives:
Gridded Data with Xarray
Learn the three main components of an Xarray data object: data variables, coordinate variables, named dimensions
Visualize gridded datasets
Git and GitHub: Version Control
Learning and Participation Activities with Due Dates (Wednesday, Wed. Oct. 12, Noon EDT):
Xarray data analysis and visualization notebooks
a.
cdto your/spare11/atm533/<NetID>directoryb. Clone Kevin’s week7 folder:
git clone /spare11/atm533/ktyle/week7c. Open up a JupyterLab session on Turing
d. Browse to your atm533/week7 directory
e. Work through notebooks 5-8
Version control and branches in Git:
Push the simple edit in your
sample.txtfile that you made last week to your personal GitHub repository:Be sure you have created and switched to the fix-typo branch, as described in the Create a new feature branch section in https://foundations.projectpythia.org/foundations/github/basic-git.html
Type the following:
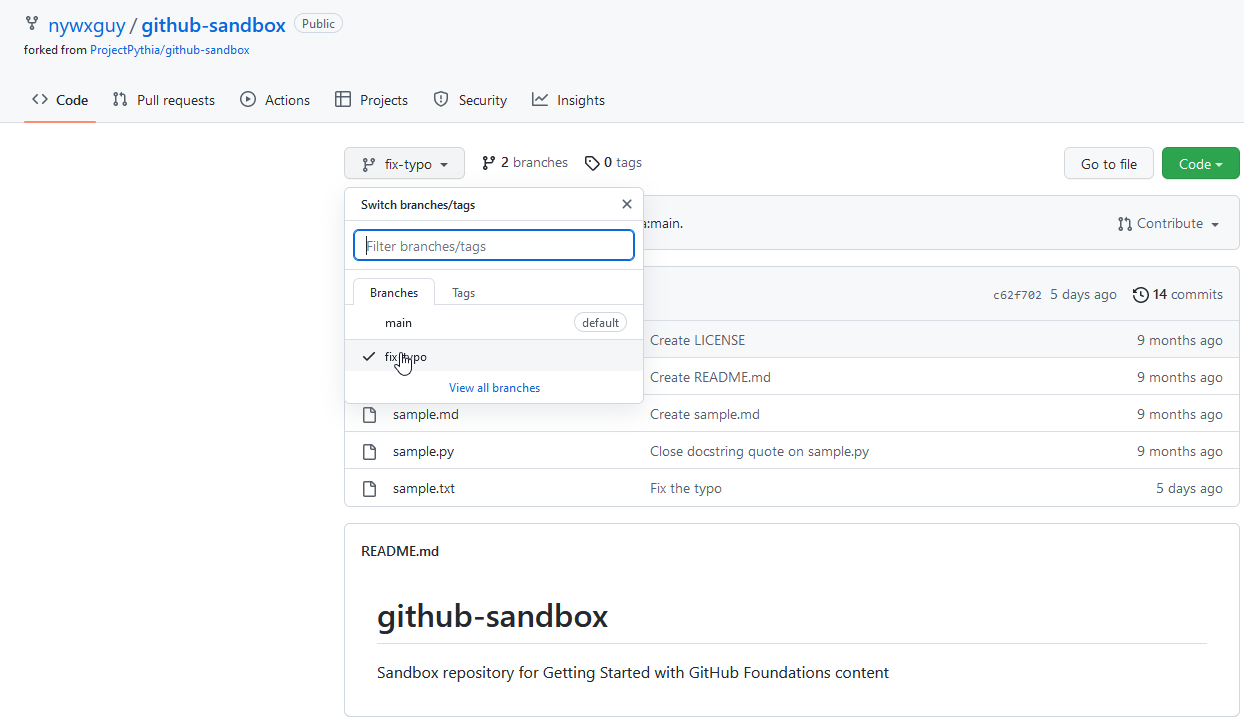
git push origin fix-typoNavigate to your personal GitHub page (e.g., https://github.com/nywxguy)
Click on the *github-sandbox` repository
You should be able to switch from the main to fix-typo branch and see that the
sample.txtfile has been updated, as in the screenshot below.
Team assignments:
You will receive an invitation to join the GitHub team that I assigned you to last week. Please confirm that invitation as soon as possible after receiving it.
Team project:
A more detailed email announcment will follow, but for now, you and your team members should decide on a particular weather event, any time from 1979 through July 31 2022, that you would like to analyze and create plots for. Your resulting plots will be displayed on our Science on a Sphere. Since this will entail a global display, your weather event should be synoptic-scale or larger (i.e., do not choose an isolated tornado case).
Post any questions you have on the Week 7 Blackboard Class Community Forum.