ATM350 Intro: NYS Mesonet Map
ATM350 Intro: NYS Mesonet Map
import matplotlib.pyplot as plt
import numpy as np
import pandas as pd
from datetime import datetime
from cartopy import crs as ccrs
from cartopy import feature as cfeature
from metpy.calc import wind_components, dewpoint_from_relative_humidity
from metpy.units import units
from metpy.plots import StationPlot
nysm_data = pd.read_csv('https://www.atmos.albany.edu/products/nysm/nysm_latest.csv')
stid = nysm_data['station']
lats = nysm_data['lat']
lons = nysm_data['lon']
wspd = nysm_data['max_wind_speed_prop [m/s]'].values * units['m/s']
drct = nysm_data['wind_direction_prop [degrees]'].values * units['degree']
wspk = wspd.to('knots')
u, v = wind_components(wspk, drct)
tmpc = nysm_data['temp_2m [degC]'].values * units('degC')
tmpf = tmpc.to('degF')
rh = nysm_data['relative_humidity [percent]'].values * units('percent')
pres = nysm_data['station_pressure [mbar]'].values * units('mbar')
timeString = nysm_data['time'][0]
timeObj = datetime.strptime(timeString,"%Y-%m-%d %H:%M:%S")
titleString = datetime.strftime(timeObj,"%B %d %Y, %H%M UTC")
figString = datetime.strftime(timeObj,"%Y%m%d_%H%M")
elev = nysm_data['elevation']
sensorHeight = .5
# Reduce station pressure to SLP. Source: https://www.sandhurstweather.org.uk/barometric.pdf
slp = pres.m/np.exp(-1*(elev+sensorHeight)/((tmpc.m + 273.15) * 29.263))
dwpc = dewpoint_from_relative_humidity(tmpf, rh)
dwpf = dwpc.to('degF')
# Set the domain for defining the plot region.
latN = 45.2
latS = 40.2
lonW = -80.0
lonE = -72.0
cLat = (latN + latS)/2
cLon = (lonW + lonE )/2
proj = ccrs.LambertConformal(central_longitude=cLon, central_latitude=cLat)
res = '50m'
fig = plt.figure(figsize=(18,12),dpi=150) # Increase the dots per inch from default 100 to make plot easier to read
ax = fig.add_subplot(1,1,1,projection=proj)
ax.set_extent ([lonW,lonE,latS,latN])
ax.set_facecolor(cfeature.COLORS['water'])
ax.add_feature(cfeature.STATES.with_scale(res))
ax.add_feature(cfeature.RIVERS.with_scale(res))
ax.add_feature (cfeature.LAND.with_scale(res))
ax.add_feature(cfeature.COASTLINE.with_scale(res))
ax.add_feature (cfeature.LAKES.with_scale(res))
ax.add_feature (cfeature.STATES.with_scale(res))
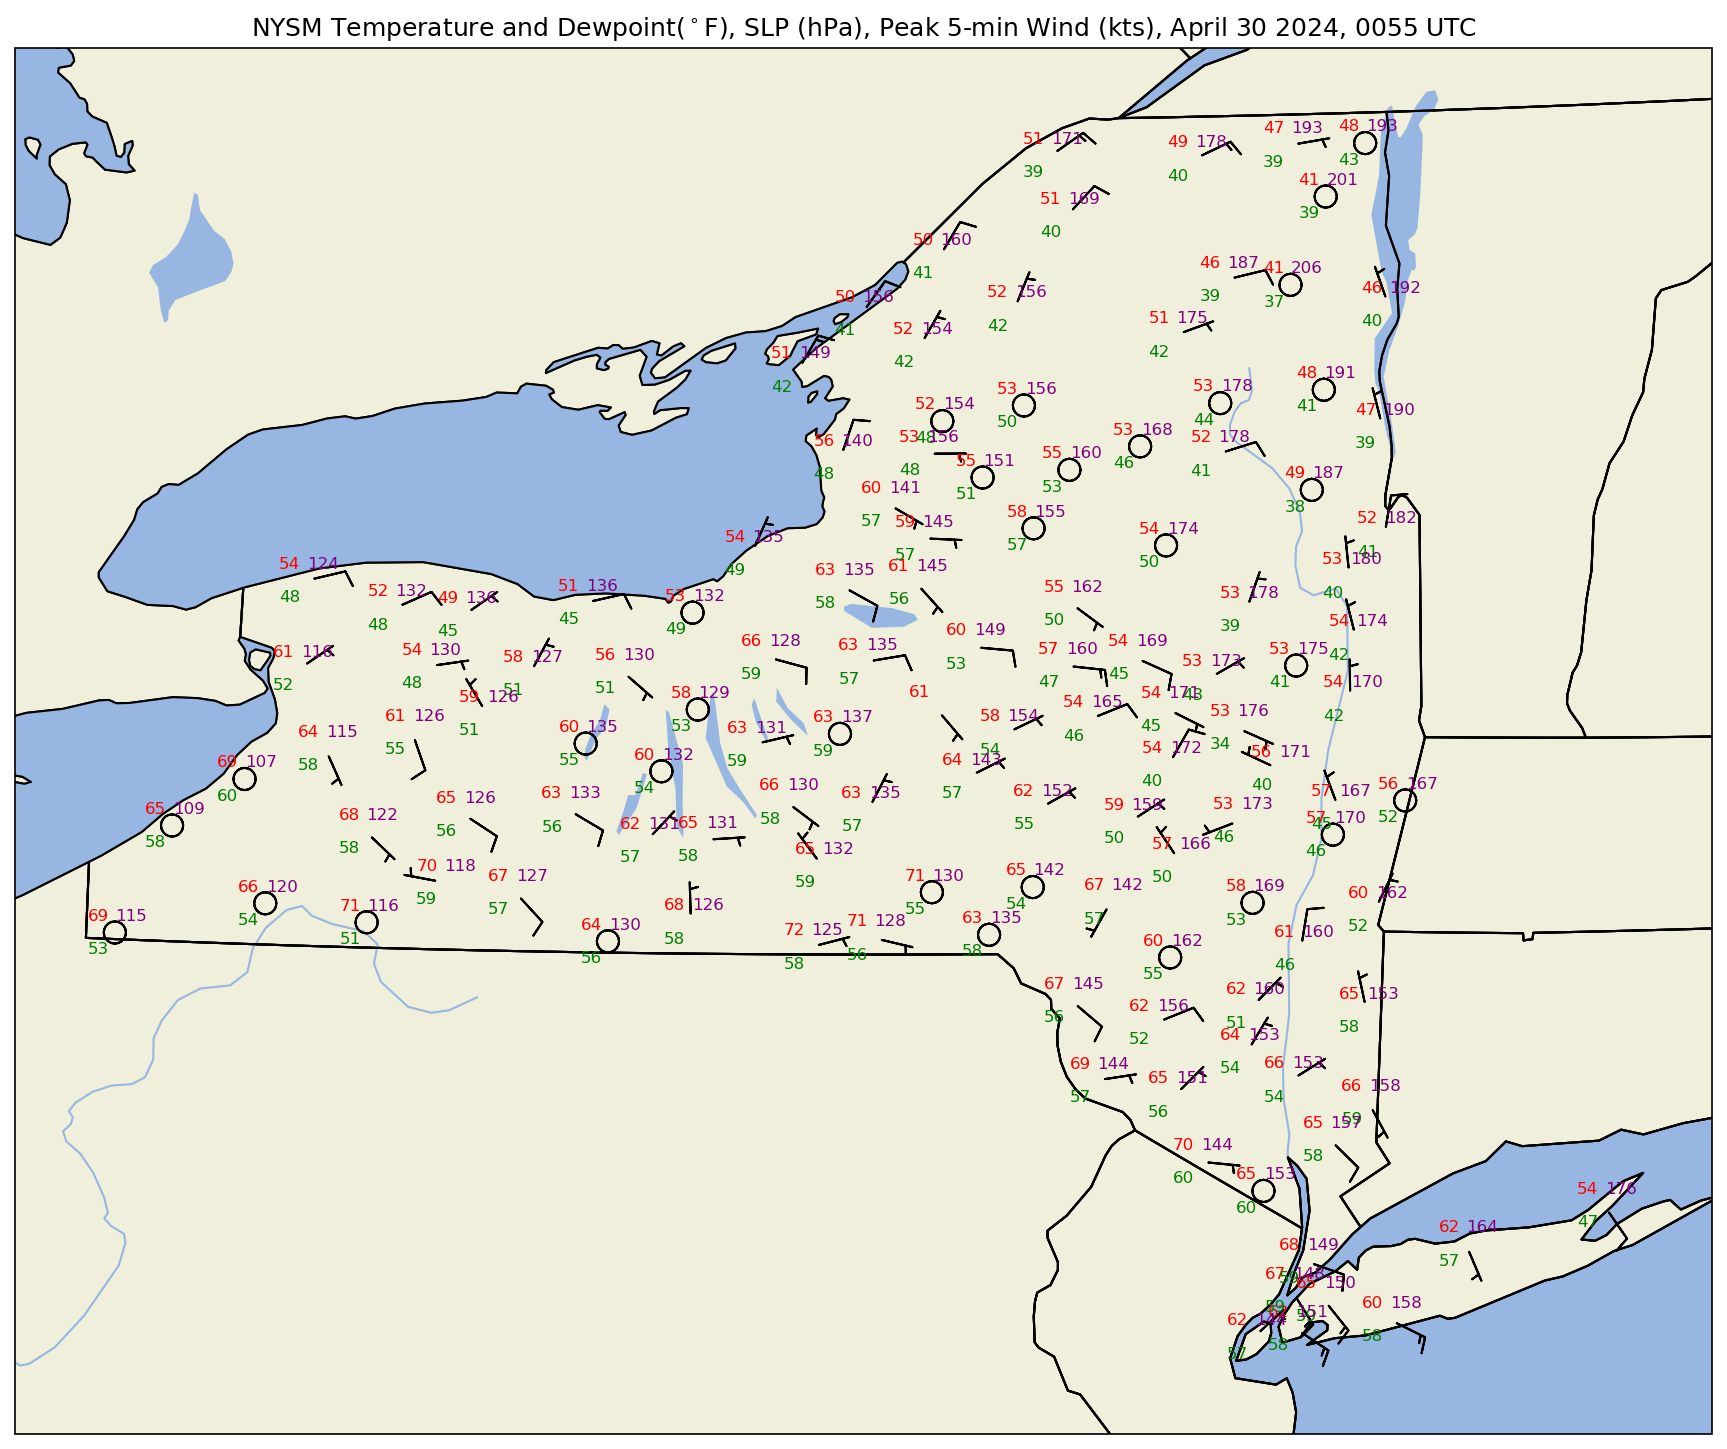
stationplot = StationPlot(ax, lons, lats, transform=ccrs.PlateCarree(),
fontsize=8)
stationplot.plot_parameter('NW', tmpf, color='red')
stationplot.plot_parameter('SW', dwpf, color='green')
# A more complex example uses a custom formatter to control how the sea-level pressure
# values are plotted. This uses the standard trailing 3-digits of the pressure value
# in tenths of millibars.
stationplot.plot_parameter('NE', slp, color='purple', formatter=lambda v: format(10 * v, '.0f')[-3:])
stationplot.plot_barb(u, v,zorder=2)
plotTitle = f'NYSM Temperature and Dewpoint($^\circ$F), SLP (hPa), Peak 5-min Wind (kts), {titleString}'
ax.set_title (plotTitle);
figName = f'NYSM_{figString}.png'

fig.savefig(figName)