HW4 Q3: NYS Mesonet Observations during the 2024 Solar Eclipse
Contents
HW4 Q3: NYS Mesonet Observations during the 2024 Solar Eclipse
Imports
import pandas as pd
from datetime import datetime
import matplotlib.pyplot as plt
import seaborn as sns
from matplotlib.dates import DateFormatter, AutoDateLocator,HourLocator,DayLocator,MonthLocator,MinuteLocator
TASK: Add a code cell that sets the default Seaborn settings for Matplotlib
# Write your code here
sns.set()
Create a Dataframe from the April 8 2024 NYSM data file. Interpret the time column in datetime format.
df = pd.read_csv('/spare11/atm350/common/hw4/20240408_nysm.csv', parse_dates=['time'])
TASK: Examine the
dataframe# Write your code here
df
| station | time | temp_2m [degC] | temp_9m [degC] | relative_humidity [percent] | precip_incremental [mm] | precip_local [mm] | precip_max_intensity [mm/min] | avg_wind_speed_prop [m/s] | max_wind_speed_prop [m/s] | ... | soil_temp_05cm [degC] | soil_temp_25cm [degC] | soil_temp_50cm [degC] | soil_moisture_05cm [m^3/m^3] | soil_moisture_25cm [m^3/m^3] | soil_moisture_50cm [m^3/m^3] | lat | lon | elevation | name | |
|---|---|---|---|---|---|---|---|---|---|---|---|---|---|---|---|---|---|---|---|---|---|
| 0 | ADDI | 2024-04-07 23:00:00+00:00 | 10.0 | 10.2 | 27.8 | 0.0 | 0.0 | 0.0 | 3.7 | 5.9 | ... | 7.3 | 5.4 | 5.2 | 0.56 | 0.46 | 0.43 | 42.04036 | -77.23726 | 507.614 | Addison |
| 1 | ADDI | 2024-04-07 23:05:00+00:00 | 9.7 | 10.0 | 28.5 | 0.0 | 0.0 | 0.0 | 2.8 | 4.8 | ... | 7.3 | 5.4 | 5.2 | 0.56 | 0.46 | 0.43 | 42.04036 | -77.23726 | 507.614 | Addison |
| 2 | ADDI | 2024-04-07 23:10:00+00:00 | 9.3 | 9.7 | 30.0 | 0.0 | 0.0 | 0.0 | 1.8 | 3.3 | ... | 7.3 | 5.4 | 5.2 | 0.56 | 0.46 | 0.43 | 42.04036 | -77.23726 | 507.614 | Addison |
| 3 | ADDI | 2024-04-07 23:15:00+00:00 | 9.0 | 9.5 | 29.8 | 0.0 | 0.0 | 0.0 | 2.4 | 4.7 | ... | 7.3 | 5.4 | 5.2 | 0.56 | 0.46 | 0.43 | 42.04036 | -77.23726 | 507.614 | Addison |
| 4 | ADDI | 2024-04-07 23:20:00+00:00 | 8.8 | 9.3 | 29.7 | 0.0 | 0.0 | 0.0 | 2.8 | 4.9 | ... | 7.3 | 5.4 | 5.2 | 0.56 | 0.46 | 0.43 | 42.04036 | -77.23726 | 507.614 | Addison |
| ... | ... | ... | ... | ... | ... | ... | ... | ... | ... | ... | ... | ... | ... | ... | ... | ... | ... | ... | ... | ... | ... |
| 37975 | YORK | 2024-04-08 23:35:00+00:00 | 14.6 | 14.8 | 40.7 | 0.0 | 0.0 | 0.0 | 1.6 | 2.4 | ... | 7.7 | 7.1 | 7.0 | 0.25 | 0.29 | 0.38 | 42.85504 | -77.84776 | 177.942 | York |
| 37976 | YORK | 2024-04-08 23:40:00+00:00 | 14.3 | 14.7 | 41.4 | 0.0 | 0.0 | 0.0 | 1.3 | 1.7 | ... | 7.7 | 7.1 | 7.0 | 0.25 | 0.30 | 0.38 | 42.85504 | -77.84776 | 177.942 | York |
| 37977 | YORK | 2024-04-08 23:45:00+00:00 | 13.1 | 14.4 | 45.6 | 0.0 | 0.0 | 0.0 | 1.3 | 1.6 | ... | 7.7 | 7.1 | 7.0 | 0.25 | 0.30 | 0.38 | 42.85504 | -77.84776 | 177.942 | York |
| 37978 | YORK | 2024-04-08 23:50:00+00:00 | 11.6 | 14.1 | 52.1 | 0.0 | 0.0 | 0.0 | 1.1 | 1.5 | ... | 7.7 | 7.0 | 7.0 | 0.25 | 0.29 | 0.38 | 42.85504 | -77.84776 | 177.942 | York |
| 37979 | YORK | 2024-04-08 23:55:00+00:00 | 11.1 | 14.0 | 52.7 | 0.0 | 0.0 | 0.0 | 1.2 | 1.4 | ... | 7.7 | 7.1 | 7.0 | 0.25 | 0.30 | 0.38 | 42.85504 | -77.84776 | 177.942 | York |
37980 rows × 34 columns
TASK: Select start and end time that covers a 3-hour period that includes the peak of the 4/8/24 eclipse over NYS. Use Pandas'
Timestamp function. An example invocation to set the start time to 2000 UTC March 8 1970 would be:timeStart = pd.Timestamp(1970, 3, 8, 14, tz='UTC')# Write your code here
timeStart = pd.Timestamp(2024, 4, 8, 18, tz = 'UTC')
timeEnd = pd.Timestamp(2024, 4, 8, 21, tz = 'UTC')
Set a boolean mask that includes the period of interest, then create a new Dataframe from that mask.
mask = (df['time'] >= timeStart) & (df['time'] <=timeEnd)
dfSub = df[mask]
TASK: Examine the subsetted Dataframe
dfSub
| station | time | temp_2m [degC] | temp_9m [degC] | relative_humidity [percent] | precip_incremental [mm] | precip_local [mm] | precip_max_intensity [mm/min] | avg_wind_speed_prop [m/s] | max_wind_speed_prop [m/s] | ... | soil_temp_05cm [degC] | soil_temp_25cm [degC] | soil_temp_50cm [degC] | soil_moisture_05cm [m^3/m^3] | soil_moisture_25cm [m^3/m^3] | soil_moisture_50cm [m^3/m^3] | lat | lon | elevation | name | |
|---|---|---|---|---|---|---|---|---|---|---|---|---|---|---|---|---|---|---|---|---|---|
| 228 | ADDI | 2024-04-08 18:00:00+00:00 | 12.0 | 12.0 | 39.4 | 0.0 | 0.0 | 0.0 | 3.3 | 5.3 | ... | 5.6 | 5.4 | 5.4 | 0.56 | 0.46 | 0.44 | 42.04036 | -77.23726 | 507.614 | Addison |
| 229 | ADDI | 2024-04-08 18:05:00+00:00 | 11.8 | 11.9 | 40.1 | 0.0 | 0.0 | 0.0 | 3.5 | 5.3 | ... | 5.6 | 5.4 | 5.4 | 0.56 | 0.46 | 0.44 | 42.04036 | -77.23726 | 507.614 | Addison |
| 230 | ADDI | 2024-04-08 18:10:00+00:00 | 11.6 | 11.7 | 42.6 | 0.0 | 0.0 | 0.0 | 4.0 | 5.5 | ... | 5.7 | 5.4 | 5.4 | 0.56 | 0.46 | 0.44 | 42.04036 | -77.23726 | 507.614 | Addison |
| 231 | ADDI | 2024-04-08 18:15:00+00:00 | 11.7 | 11.8 | 40.9 | 0.0 | 0.0 | 0.0 | 3.8 | 5.7 | ... | 5.7 | 5.4 | 5.4 | 0.56 | 0.46 | 0.44 | 42.04036 | -77.23726 | 507.614 | Addison |
| 232 | ADDI | 2024-04-08 18:20:00+00:00 | 11.8 | 11.9 | 39.3 | 0.0 | 0.0 | 0.0 | 4.2 | 6.8 | ... | 5.7 | 5.4 | 5.4 | 0.56 | 0.46 | 0.44 | 42.04036 | -77.23726 | 507.614 | Addison |
| ... | ... | ... | ... | ... | ... | ... | ... | ... | ... | ... | ... | ... | ... | ... | ... | ... | ... | ... | ... | ... | ... |
| 37940 | YORK | 2024-04-08 20:40:00+00:00 | 14.3 | 13.9 | 45.5 | 0.0 | 0.0 | 0.0 | 0.4 | 0.7 | ... | 7.4 | 7.0 | 7.0 | 0.25 | 0.30 | 0.38 | 42.85504 | -77.84776 | 177.942 | York |
| 37941 | YORK | 2024-04-08 20:45:00+00:00 | 14.8 | 14.3 | 41.6 | 0.0 | 0.0 | 0.0 | 0.2 | 0.6 | ... | 7.4 | 7.0 | 7.0 | 0.25 | 0.30 | 0.38 | 42.85504 | -77.84776 | 177.942 | York |
| 37942 | YORK | 2024-04-08 20:50:00+00:00 | 15.1 | 14.5 | 39.9 | 0.0 | 0.0 | 0.0 | 0.8 | 1.1 | ... | 7.4 | 6.9 | 7.0 | 0.25 | 0.29 | 0.38 | 42.85504 | -77.84776 | 177.942 | York |
| 37943 | YORK | 2024-04-08 20:55:00+00:00 | 15.5 | 14.7 | 39.7 | 0.0 | 0.0 | 0.0 | 1.2 | 1.7 | ... | 7.4 | 7.0 | 7.0 | 0.25 | 0.30 | 0.38 | 42.85504 | -77.84776 | 177.942 | York |
| 37944 | YORK | 2024-04-08 21:00:00+00:00 | 15.7 | 14.7 | 37.7 | 0.0 | 0.0 | 0.0 | 1.4 | 2.0 | ... | 7.4 | 7.0 | 7.0 | 0.25 | 0.30 | 0.38 | 42.85504 | -77.84776 | 177.942 | York |
4752 rows × 34 columns
Task: define five NYSM stations from across the state. Ideally, choose sites that vary in terms of time of totality and/or degree of totality.
# Write your code here
site1 = "BRAN"
site2 = "RUSH"
site3 = "REDF"
site4 = "TUPP"
site5 = "CHAZ"
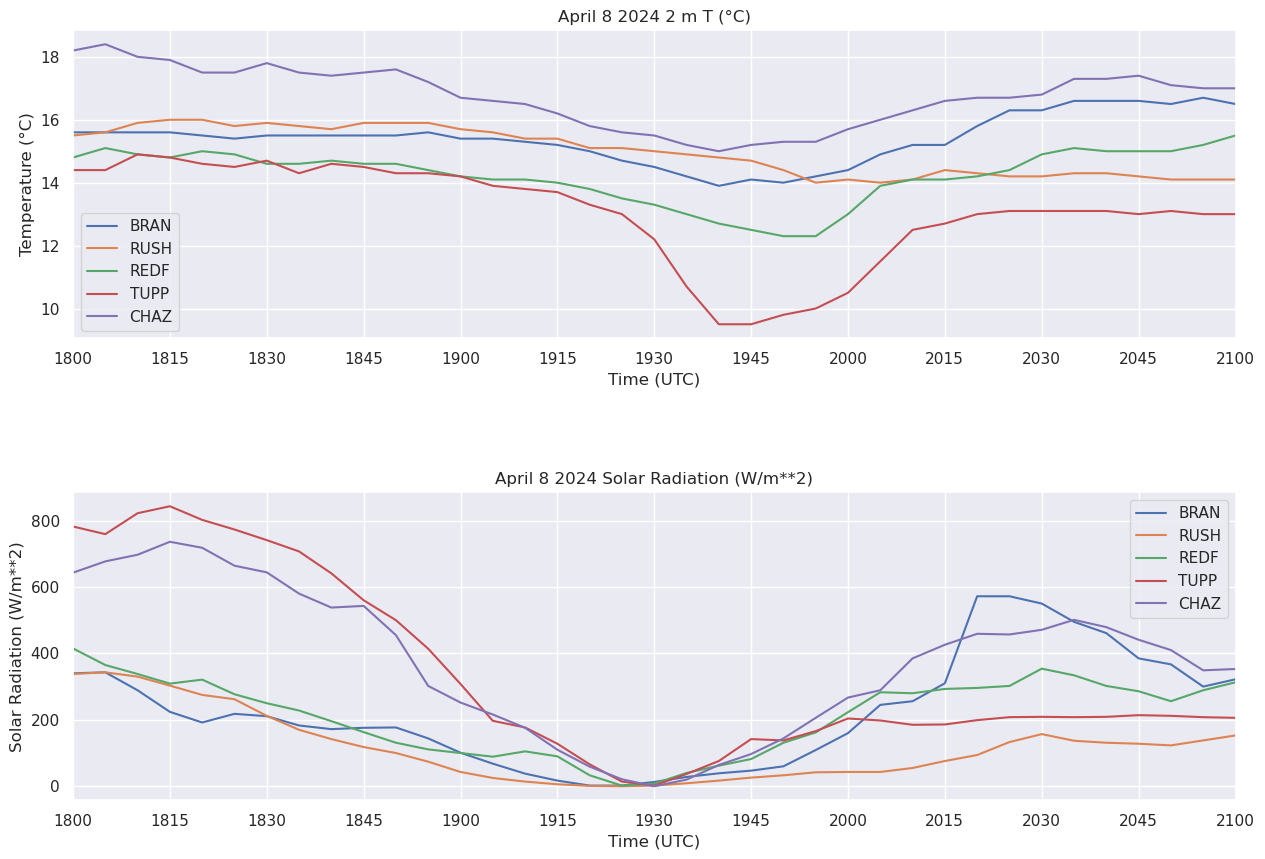
TASK: Complete the following code cell in order to produce a well-labeled figure containing two subplots, one on top of the other, containing time series of 2m temperature and incoming solar radiation for the five NYSM sites you have defined above.
fig = plt.figure(figsize=(15,10))
ax1 = fig.add_subplot(2,1,1)
ax2 = fig.add_subplot(2,1,2, sharex=ax1)

for site in [site1, site2, site3, site4, site5]:

    siteData = dfSub.query('station == @site')
    dattim = siteData['time']
    t2m = siteData['temp_2m [degC]']
    srad = siteData['solar_insolation [W/m^2]']

    ax1.plot (dattim, t2m, label=site)
    ax2.plot (dattim, srad, label=site)

ax1.set_title ("April 8 2024 2 m T (°C)")
ax1.set_xlabel('Time (UTC)')
ax1.set_ylabel('Temperature (°C)')
ax1.xaxis.set_major_locator(MinuteLocator(interval=15))
dateFmt = DateFormatter('%H%M')
ax1.xaxis.set_major_formatter(dateFmt)
ax1.set_xlim(timeStart, timeEnd)
ax1.legend(loc='best')

ax2.set_title ("April 8 2024 Solar Radiation (W/m**2)")
ax2.set_xlabel('Time (UTC)')
ax2.set_ylabel('Solar Radiation (W/m**2)')
ax2.legend(loc='best')

# Add some space between the two subplots
plt.subplots_adjust(wspace=0.5, hspace=0.5)