HW1 2022 Atlantic Tropical Cyclone Tracking Chart
Contents
HW1 2022 Atlantic Tropical Cyclone Tracking Chart
2022 Atlantic Tropical Cyclones Track Map
This notebook reads in historical tropical cyclone tracks from the Hurdat2 database; selects named storms that occurred in the Atlantic basin in 2022, and plots their tracks on a labeled map.
Based on Metpy Monday Episodes 142 and 143
Notebook author: Kevin Tyle
Imports
import pandas as pd
import matplotlib.pyplot as plt
from datetime import datetime
import cartopy.crs as ccrs
import cartopy.feature as cfeature
import matplotlib.pyplot as plt
import matplotlib as mpl
import numpy as np
Define a function to convert coordinates into floating point values
def lat_lon_to_float(v):
    """
    Convert strings from NHC to float locations
    """
    if (v[-1] == 'S') or (v[-1] == 'W'):
        multiplier = -1
    else:
        multiplier = 1
    return float(v[:-1]) * multiplier
Read in and parse the HURDAT2 data file, using built-in Python functions and the datetime library
data = []
with open('/spare11/atm533/data/hurdat2.txt', 'r') as f:
    for line in f.readlines():
        if line.startswith('AL'):
            storm_id = line.split(',')
            storm_number = storm_id[0].strip()
            storm_name = storm_id[1].strip()
        else:
            location_line = line.split(',')
            dt = datetime.strptime(location_line[0] + location_line[1], '%Y%m%d %H%M')
            storm_status = location_line[3].strip()
            storm_lat = lat_lon_to_float(location_line[4].strip())
            storm_lon = lat_lon_to_float(location_line[5].strip())
            max_speed = float(location_line[6].strip())
            data.append([storm_number, storm_name, storm_status, storm_lat,storm_lon, dt, max_speed])
Examine the first list element
data[0]
['AL011851',
 'UNNAMED',
 'HU',
 28.0,
 -94.8,
 datetime.datetime(1851, 6, 25, 0, 0),
 80.0]
Create a Pandas dateframe from the list, explicitly defining column names.
df = pd.DataFrame(data, columns=['Storm Number', 'Storm Name', 'Storm Status', 'Lat', 'Lon', 'Time', 'Max Speed'])
Examine the dataframe
df
| Storm Number | Storm Name | Storm Status | Lat | Lon | Time | Max Speed | |
|---|---|---|---|---|---|---|---|
| 0 | AL011851 | UNNAMED | HU | 28.0 | -94.8 | 1851-06-25 00:00:00 | 80.0 |
| 1 | AL011851 | UNNAMED | HU | 28.0 | -95.4 | 1851-06-25 06:00:00 | 80.0 |
| 2 | AL011851 | UNNAMED | HU | 28.0 | -96.0 | 1851-06-25 12:00:00 | 80.0 |
| 3 | AL011851 | UNNAMED | HU | 28.1 | -96.5 | 1851-06-25 18:00:00 | 80.0 |
| 4 | AL011851 | UNNAMED | HU | 28.2 | -96.8 | 1851-06-25 21:00:00 | 80.0 |
| ... | ... | ... | ... | ... | ... | ... | ... |
| 53971 | AL172022 | NICOLE | TS | 29.2 | -83.0 | 2022-11-10 19:00:00 | 40.0 |
| 53972 | AL172022 | NICOLE | TS | 30.1 | -84.0 | 2022-11-11 00:00:00 | 35.0 |
| 53973 | AL172022 | NICOLE | TD | 31.2 | -84.6 | 2022-11-11 06:00:00 | 30.0 |
| 53974 | AL172022 | NICOLE | TD | 33.2 | -84.6 | 2022-11-11 12:00:00 | 25.0 |
| 53975 | AL172022 | NICOLE | LO | 35.4 | -83.8 | 2022-11-11 18:00:00 | 25.0 |
53976 rows × 7 columns
How many unique storms do we have?
len(df['Storm Number'].unique())
1952
uniqueStorms = df['Storm Number'].unique()
uniqueStorms
array(['AL011851', 'AL021851', 'AL031851', ..., 'AL152022', 'AL162022',
       'AL172022'], dtype=object)
Grouping by storm status, get the counts of each class of storm.
df.groupby('Storm Status').count()
| Storm Number | Storm Name | Lat | Lon | Time | Max Speed | |
|---|---|---|---|---|---|---|
| Storm Status | ||||||
| DB | 258 | 258 | 258 | 258 | 258 | 258 |
| EX | 6018 | 6018 | 6018 | 6018 | 6018 | 6018 |
| HU | 15388 | 15388 | 15388 | 15388 | 15388 | 15388 |
| LO | 1531 | 1531 | 1531 | 1531 | 1531 | 1531 |
| SD | 323 | 323 | 323 | 323 | 323 | 323 |
| SS | 699 | 699 | 699 | 699 | 699 | 699 |
| TD | 9798 | 9798 | 9798 | 9798 | 9798 | 9798 |
| TS | 19823 | 19823 | 19823 | 19823 | 19823 | 19823 |
| WV | 138 | 138 | 138 | 138 | 138 | 138 |
Get those storms that occurred in a desired year
year = '2022'
dfYear = df[df['Time'].dt.strftime("%Y") == year]
dfYear
| Storm Number | Storm Name | Storm Status | Lat | Lon | Time | Max Speed | |
|---|---|---|---|---|---|---|---|
| 53505 | AL012022 | ALEX | DB | 21.3 | -87.5 | 2022-06-02 18:00:00 | 30.0 |
| 53506 | AL012022 | ALEX | DB | 21.6 | -87.3 | 2022-06-03 00:00:00 | 30.0 |
| 53507 | AL012022 | ALEX | DB | 21.9 | -87.1 | 2022-06-03 06:00:00 | 35.0 |
| 53508 | AL012022 | ALEX | DB | 22.2 | -86.9 | 2022-06-03 12:00:00 | 35.0 |
| 53509 | AL012022 | ALEX | DB | 22.8 | -86.3 | 2022-06-03 18:00:00 | 35.0 |
| ... | ... | ... | ... | ... | ... | ... | ... |
| 53971 | AL172022 | NICOLE | TS | 29.2 | -83.0 | 2022-11-10 19:00:00 | 40.0 |
| 53972 | AL172022 | NICOLE | TS | 30.1 | -84.0 | 2022-11-11 00:00:00 | 35.0 |
| 53973 | AL172022 | NICOLE | TD | 31.2 | -84.6 | 2022-11-11 06:00:00 | 30.0 |
| 53974 | AL172022 | NICOLE | TD | 33.2 | -84.6 | 2022-11-11 12:00:00 | 25.0 |
| 53975 | AL172022 | NICOLE | LO | 35.4 | -83.8 | 2022-11-11 18:00:00 | 25.0 |
471 rows × 7 columns
What are the unique storm names of this particular year?
dfYear['Storm Name'].unique()
array(['ALEX', 'BONNIE', 'COLIN', 'DANIELLE', 'EARL', 'FIONA', 'GASTON',
       'IAN', 'HERMINE', 'ELEVEN', 'TWELVE', 'JULIA', 'KARL', 'LISA',
       'MARTIN', 'NICOLE'], dtype=object)
Notice we have a couple of unnamed storms … that is, storms that have been assigned a numerical name. These were tropical cyclones tracked by NHC (and thus in the HURDAT2 database) but never reached tropical storm status. We will want to omit these. We can do this by excluding those storms that never reached tropical storm, subtropical storm, or hurricane status.
To make things easier to read and analyze, make the storm name the index of the dataframe.
dfYear = dfYear.set_index('Storm Name')
dfYear
| Storm Number | Storm Status | Lat | Lon | Time | Max Speed | |
|---|---|---|---|---|---|---|
| Storm Name | ||||||
| ALEX | AL012022 | DB | 21.3 | -87.5 | 2022-06-02 18:00:00 | 30.0 |
| ALEX | AL012022 | DB | 21.6 | -87.3 | 2022-06-03 00:00:00 | 30.0 |
| ALEX | AL012022 | DB | 21.9 | -87.1 | 2022-06-03 06:00:00 | 35.0 |
| ALEX | AL012022 | DB | 22.2 | -86.9 | 2022-06-03 12:00:00 | 35.0 |
| ALEX | AL012022 | DB | 22.8 | -86.3 | 2022-06-03 18:00:00 | 35.0 |
| ... | ... | ... | ... | ... | ... | ... |
| NICOLE | AL172022 | TS | 29.2 | -83.0 | 2022-11-10 19:00:00 | 40.0 |
| NICOLE | AL172022 | TS | 30.1 | -84.0 | 2022-11-11 00:00:00 | 35.0 |
| NICOLE | AL172022 | TD | 31.2 | -84.6 | 2022-11-11 06:00:00 | 30.0 |
| NICOLE | AL172022 | TD | 33.2 | -84.6 | 2022-11-11 12:00:00 | 25.0 |
| NICOLE | AL172022 | LO | 35.4 | -83.8 | 2022-11-11 18:00:00 | 25.0 |
471 rows × 6 columns
Iterate over each storm name, and check if the storm ever reached a named storm status. If so, add it to a list.
dfYear.index.unique()
Index(['ALEX', 'BONNIE', 'COLIN', 'DANIELLE', 'EARL', 'FIONA', 'GASTON', 'IAN',
       'HERMINE', 'ELEVEN', 'TWELVE', 'JULIA', 'KARL', 'LISA', 'MARTIN',
       'NICOLE'],
      dtype='object', name='Storm Name')
keep = []
for name in dfYear.index.unique():
    stormStatusSeries = dfYear.loc[name]['Storm Status']
    if stormStatusSeries.str.contains('DB|TS|SS').any():
        print(f'{name} was named')
        keep.append(name)
    else:
        print(f'{name} was NOT named')
ALEX was named
BONNIE was named
COLIN was named
DANIELLE was named
EARL was named
FIONA was named
GASTON was named
IAN was named
HERMINE was named
ELEVEN was NOT named
TWELVE was NOT named
JULIA was named
KARL was named
LISA was named
MARTIN was named
NICOLE was named
dfYear.loc['FIONA'].iloc[0].Lat
16.0
Create a new Dataframe which now consists only of the named storms.
dfYearNamed = dfYear.loc[keep]
dfYearNamed.index.unique()
Index(['ALEX', 'BONNIE', 'COLIN', 'DANIELLE', 'EARL', 'FIONA', 'GASTON', 'IAN',
       'HERMINE', 'JULIA', 'KARL', 'LISA', 'MARTIN', 'NICOLE'],
      dtype='object', name='Storm Name')
How many named storms do we have?
nStorms = len(dfYearNamed.index.unique())
nStorms
14
Plot the map
Set the projection for the dataset and figure. The dataset uses latitude and longitude for its coordinates (PlateCarree). Given the large domain over which TCs may have tracked in a given year, use PlateCarree for the figure as well.
data_crs = ccrs.PlateCarree()
plot_crs = ccrs.PlateCarree()
Color and linestyle considerations
Distinguishing each track will be challenging. One strategy is to cycle through colors in a colormap and linestyles in a tuple (akin to a list).
colors = mpl.cm.hsv(np.linspace(0, 1, nStorms))
Create a tuple of Matplotlib linestyles. Repeat the pattern a number of times so we can ensure the number of linestyles is always greater than or equal to the number of storms.
linestyle_tuple = 100*[
     ('loosely dotted',        (0, (1, 10))),
     ('dotted',                (0, (1, 1))),
     ('densely dotted',        (0, (1, 1))),
     ('long dash with offset', (5, (10, 3))),
     ('loosely dashed',        (0, (5, 10))),
     ('dashed',                (0, (5, 5))),
     ('densely dashed',        (0, (5, 1))),

     ('loosely dashdotted',    (0, (3, 10, 1, 10))),
     ('dashdotted',            (0, (3, 5, 1, 5))),
     ('densely dashdotted',    (0, (3, 1, 1, 1))),

     ('dashdotdotted',         (0, (3, 5, 1, 5, 1, 5))),
     ('loosely dashdotdotted', (0, (3, 10, 1, 10, 1, 10))),
     ('densely dashdotdotted', (0, (3, 1, 1, 1, 1, 1)))]
linestyles = linestyle_tuple[::1][:nStorms]
# Use medium-scale cartographic features
res = '50m'
fig = plt.figure(figsize=(15,12), dpi=150)
ax = plt.subplot(1,1,1, projection=plot_crs)
ax.set_extent([-150, 0, 5, 65], data_crs)
ax.set_facecolor(cfeature.COLORS['water'])
ax.add_feature (cfeature.STATES.with_scale(res))
ax.add_feature (cfeature.LAND.with_scale(res))
ax.add_feature (cfeature.COASTLINE.with_scale(res))
ax.add_feature (cfeature.LAKES.with_scale(res))
ax.add_feature (cfeature.STATES.with_scale(res))
# Loop over each storm
for idx, storm_name in enumerate(dfYearNamed.index.unique()):
storm_data = dfYearNamed[dfYearNamed.index == storm_name]
track_len = len(storm_data)
ax.plot(storm_data['Lon'], storm_data['Lat'], transform=data_crs,
label=storm_name,c=colors[idx],linestyle=linestyles[idx][1])
s = ax.scatter(storm_data['Lon'], storm_data['Lat'], transform=data_crs, c=storm_data['Max Speed'],
vmin=40, vmax=150, s=storm_data['Max Speed']/5, cmap='Reds')
# Get the coordinates of the first point in each storm's track, to be used for labeling
lon0, lat0 = storm_data['Lon'].iloc[0], storm_data['Lat'].iloc[0]
ax.text(lon0, lat0, s=storm_name,fontdict=dict(color='black', size=6), bbox=dict(facecolor='#CCCCCC', alpha=0.5))
ax.legend(loc='upper left', fontsize=7)
# Once out of the loop, create and label a colorbar, set the title, and save the figure.
cbar = plt.colorbar(s,shrink=0.35)
cbar.ax.tick_params(labelsize=12)
cbar.ax.set_ylabel("Windspeed (kts)",fontsize=13);
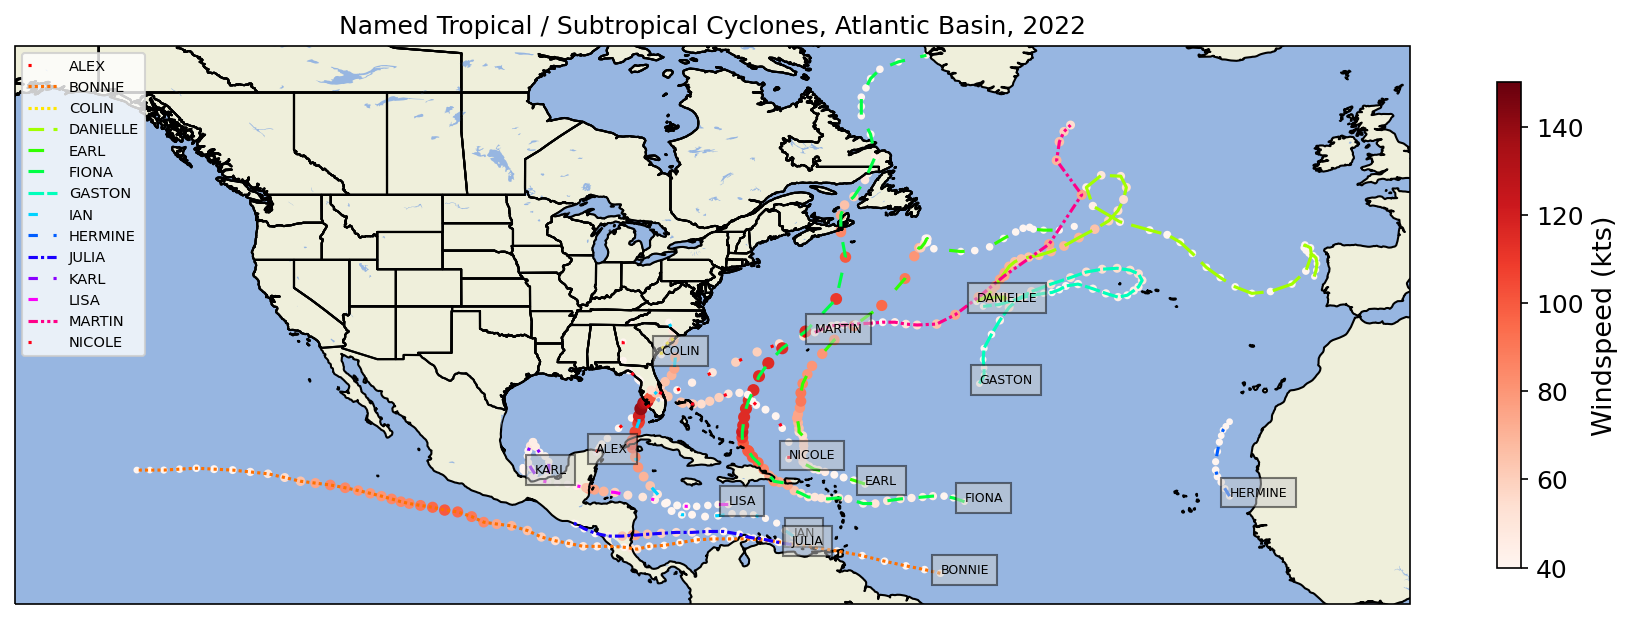
plotTitle = f'Named Tropical / Subtropical Cyclones, Atlantic Basin, {year}'
ax.set_title (plotTitle);
fig.savefig (f'AtlTCs{year}.png')
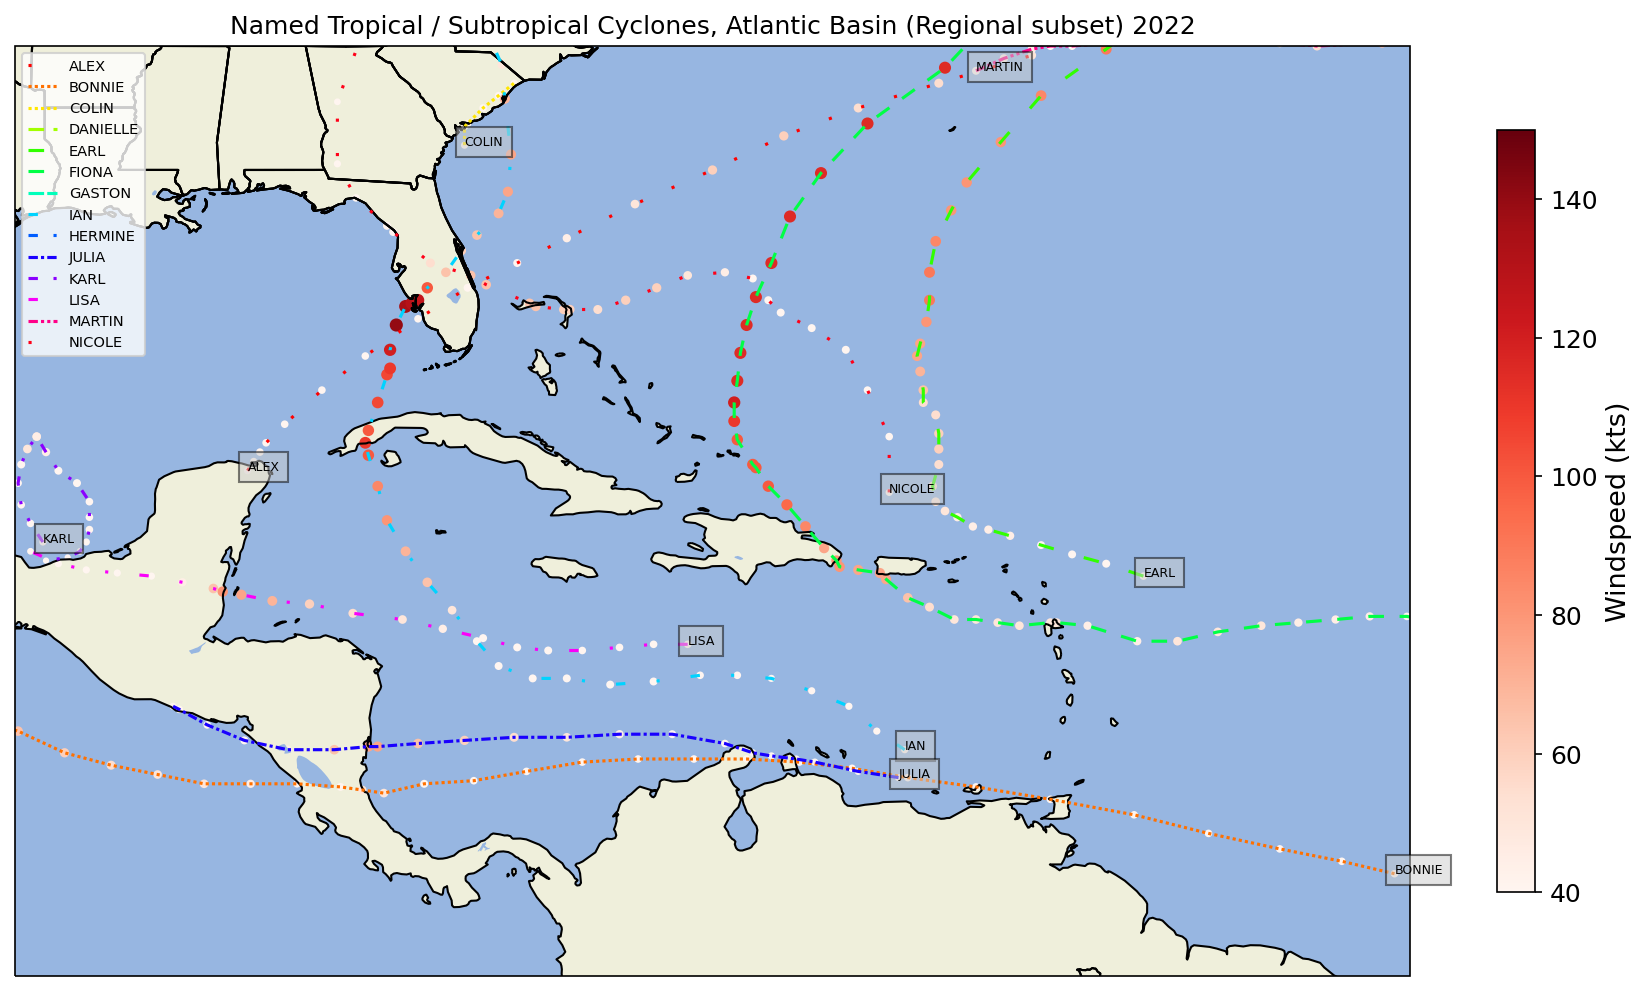
Create another map, this time centered over a smaller region.
regLonW, regLonE, regLatS, regLatN = (-95, -50, 5, 35)
# Use medium-scale cartographic features
res = '50m'

fig = plt.figure(figsize=(15,12), dpi=150)
ax = plt.subplot(1,1,1, projection=plot_crs)

ax.set_extent([regLonW, regLonE, regLatS, regLatN], data_crs)
ax.set_facecolor(cfeature.COLORS['water'])
ax.add_feature (cfeature.STATES.with_scale(res))
ax.add_feature (cfeature.LAND.with_scale(res))
ax.add_feature (cfeature.COASTLINE.with_scale(res))
ax.add_feature (cfeature.LAKES.with_scale(res))
ax.add_feature (cfeature.STATES.with_scale(res))

# Loop over each storm
for idx, storm_name in enumerate(dfYearNamed.index.unique()):

    storm_data = dfYearNamed[dfYearNamed.index == storm_name]
    track_len = len(storm_data)
    ax.plot(storm_data['Lon'], storm_data['Lat'], transform=data_crs,
           label=storm_name,c=colors[idx],linestyle=linestyles[idx][1])
    s = ax.scatter(storm_data['Lon'], storm_data['Lat'], transform=data_crs, c=storm_data['Max Speed'],
                   vmin=40, vmax=150, s=storm_data['Max Speed']/5, cmap='Reds')
# Get the coordinates of the first point in each storm's track, to be used for labeling

    lon0, lat0 = storm_data['Lon'].iloc[0], storm_data['Lat'].iloc[0]
# Ensure that we only plot the text box if the coordinates are within the regional extent
    if (regLonW < lon0 < regLonE and regLatS < lat0 < regLatN):
        ax.text(lon0, lat0, s=storm_name,fontdict=dict(color='black', size=6), bbox=dict(facecolor='#CCCCCC', alpha=0.5))


    ax.legend(loc='upper left', fontsize=7)

# Once out of the loop, create and label a colorbar, set the title, and save the figure.
cbar = plt.colorbar(s,shrink=0.55)
cbar.ax.tick_params(labelsize=12)
cbar.ax.set_ylabel("Windspeed (kts)",fontsize=13);

plotTitle = f'Named Tropical / Subtropical Cyclones, Atlantic Basin (Regional subset) {year}'
ax.set_title (plotTitle);

fig.savefig (f'AtlTCs{year}Regional.png')
Summary
We’ve done a lot of tweaking to produce a fairly self-explanatory tropical cyclone tracking chart … but as always there’s room to further improve!