ERA5_ARCO Pressure Level Data Exploration: Matplotlib
Contents
|
|

|

|
ERA5_ARCO Pressure Level Data Exploration: Matplotlib
Overview
A team at Google Research & Cloud are making parts of the ECMWF Reanalysis version 5 (aka ERA-5) accessible in a Analysis Ready, Cloud Optimized (aka ARCO) format.
In this notebook, we will do the following:
Access the ERA-5 ARCO catalog
Select a particular dataset and variable from the catalog
Imports
import xarray as xr
import matplotlib.pyplot as plt
import cartopy.crs as ccrs
import cartopy.feature as cfeature
from metpy import calc as mpcalc
from metpy.units import units
import metpy
import numpy as np
from datetime import datetime, timedelta
Access the ARCO ERA-5 catalog on Google Cloud
Let’s open the 37-level isobaric surfaces reanalysis Zarr file
reanalysis = xr.open_zarr(
    'gs://gcp-public-data-arco-era5/ar/1959-2022-full_37-1h-0p25deg-chunk-1.zarr-v2',
    consolidated=True
)
reanalysis
<xarray.Dataset>
Dimensions:                                           (time: 552264,
                                                       latitude: 721,
                                                       longitude: 1440,
                                                       level: 37)
Coordinates:
  * latitude                                          (latitude) float32 90.0...
  * level                                             (level) int64 1 2 ... 1000
  * longitude                                         (longitude) float32 0.0...
  * time                                              (time) datetime64[ns] 1...
Data variables: (12/31)
    10m_u_component_of_wind                           (time, latitude, longitude) float32 dask.array<chunksize=(1, 721, 1440), meta=np.ndarray>
    10m_v_component_of_wind                           (time, latitude, longitude) float32 dask.array<chunksize=(1, 721, 1440), meta=np.ndarray>
    2m_temperature                                    (time, latitude, longitude) float32 dask.array<chunksize=(1, 721, 1440), meta=np.ndarray>
    angle_of_sub_gridscale_orography                  (latitude, longitude) float32 dask.array<chunksize=(721, 1440), meta=np.ndarray>
    anisotropy_of_sub_gridscale_orography             (latitude, longitude) float32 dask.array<chunksize=(721, 1440), meta=np.ndarray>
    geopotential                                      (time, level, latitude, longitude) float32 dask.array<chunksize=(1, 37, 721, 1440), meta=np.ndarray>
    ...                                                ...
    total_precipitation                               (time, latitude, longitude) float32 dask.array<chunksize=(1, 721, 1440), meta=np.ndarray>
    type_of_high_vegetation                           (latitude, longitude) float32 dask.array<chunksize=(721, 1440), meta=np.ndarray>
    type_of_low_vegetation                            (latitude, longitude) float32 dask.array<chunksize=(721, 1440), meta=np.ndarray>
    u_component_of_wind                               (time, level, latitude, longitude) float32 dask.array<chunksize=(1, 37, 721, 1440), meta=np.ndarray>
    v_component_of_wind                               (time, level, latitude, longitude) float32 dask.array<chunksize=(1, 37, 721, 1440), meta=np.ndarray>
vertical_velocity (time, level, latitude, longitude) float32 dask.array<chunksize=(1, 37, 721, 1440), meta=np.ndarray>geop = reanalysis.geopotential
temp = reanalysis.temperature
geop
<xarray.DataArray 'geopotential' (time: 552264, level: 37, latitude: 721,
longitude: 1440)>
dask.array<open_dataset-geopotential, shape=(552264, 37, 721, 1440), dtype=float32, chunksize=(1, 37, 721, 1440), chunktype=numpy.ndarray>
Coordinates:
* latitude (latitude) float32 90.0 89.75 89.5 89.25 ... -89.5 -89.75 -90.0
* level (level) int64 1 2 3 5 7 10 20 30 ... 850 875 900 925 950 975 1000
* longitude (longitude) float32 0.0 0.25 0.5 0.75 ... 359.0 359.2 359.5 359.8
* time (time) datetime64[ns] 1959-01-01 ... 2021-12-31T23:00:00
Attributes:
long_name: Geopotential
short_name: z
standard_name: geopotential
units: m**2 s**-2Select time and level ranges from the dataset.
nHours = 6
startTime = datetime(1993,3,13,18)
endTime = startTime + timedelta(hours=nHours)
RESTRICT YOUR TIME/LEVEL RANGES!
The full dataset is over 70 TB ... if you try to load in too large a range (or forget to specify the start/stop points), you will likely run out of system memory!
The full dataset is over 70 TB ... if you try to load in too large a range (or forget to specify the start/stop points), you will likely run out of system memory!
geopSub1 = geop.sel(time=slice(startTime, endTime), level=500)
tempSub1 = temp.sel(time=slice(startTime, endTime), level=850)
Convert to dam and deg C.
Z = mpcalc.geopotential_to_height(geopSub1).metpy.convert_units('dam')
T = tempSub1.metpy.convert_units('degC')
Z
<xarray.DataArray 'truediv-2f0b3ac192d450f946fff895443b747d' (time: 7,
latitude: 721,
longitude: 1440)>
<Quantity(dask.array<mul, shape=(7, 721, 1440), dtype=float32, chunksize=(1, 721, 1440), chunktype=numpy.ndarray>, 'decameter')>
Coordinates:
* latitude (latitude) float32 90.0 89.75 89.5 89.25 ... -89.5 -89.75 -90.0
level int64 500
* longitude (longitude) float32 0.0 0.25 0.5 0.75 ... 359.0 359.2 359.5 359.8
* time (time) datetime64[ns] 1993-03-13T18:00:00 ... 1993-03-14T
<xarray.DataArray 'temperature' (time: 7, latitude: 721, longitude: 1440)>
<Quantity(dask.array<truediv, shape=(7, 721, 1440), dtype=float32, chunksize=(1, 721, 1440), chunktype=numpy.ndarray>, 'degree_Celsius')>
Coordinates:
* latitude (latitude) float32 90.0 89.75 89.5 89.25 ... -89.5 -89.75 -90.0
level int64 850
* longitude (longitude) float32 0.0 0.25 0.5 0.75 ... 359.0 359.2 359.5 359.8
* time (time) datetime64[ns] 1993-03-13T18:00:00 ... 1993-03-14
Attributes:
long_name: Temperature
short_name: t
standard_name: air_temperaturePlot the data using Matplotlib
projData = ccrs.PlateCarree()
lons, lats = Z.longitude, Z.latitude
tLevels = np.arange(-45,39,3)
zLevels = np.arange(468, 606, 6)
res = '110m'
dpi = 100
fig = plt.figure(figsize=(2048/dpi, 1024/dpi))
ax = plt.subplot(1,1,1,projection=projData, frameon=False)
ax.add_feature(cfeature.COASTLINE.with_scale(res), edgecolor='brown', linewidth=2.5)
ax.add_feature(cfeature.BORDERS.with_scale(res), edgecolor='brown', linewidth=2.5)
ax.add_feature(cfeature.STATES.with_scale(res), edgecolor='brown')
# Temperature (T) contour fills
# Note we don't need the transform argument since the map/data projections are the same, but we'll leave it in
CF = ax.contourf(lons,lats,T,levels=tLevels,cmap=plt.get_cmap('coolwarm'), extend='both', transform=projData)
# Height (Z) contour lines
CL = ax.contour(lons,lats,Z,zLevels,linewidths=1.25,colors='yellow', transform=projData)
ax.clabel(CL, inline_spacing=0.2, fontsize=8, fmt='%.0f')
fig.tight_layout(pad=.01)
---------------------------------------------------------------------------
TypeError Traceback (most recent call last)
Cell In[15], line 13
8 ax.add_feature(cfeature.STATES.with_scale(res), edgecolor='brown')
10 # Temperature (T) contour fills
11
12 # Note we don't need the transform argument since the map/data projections are the same, but we'll leave it in
---> 13 CF = ax.contourf(lons,lats,T,levels=tLevels,cmap=plt.get_cmap('coolwarm'), extend='both', transform=projData)
15 # Height (Z) contour lines
16 CL = ax.contour(lons,lats,Z,zLevels,linewidths=1.25,colors='yellow', transform=projData)
File /knight/mamba_aug23/envs/aug23_env/lib/python3.11/site-packages/cartopy/mpl/geoaxes.py:318, in _add_transform.<locals>.wrapper(self, *args, **kwargs)
313 raise ValueError(f'Invalid transform: Spherical {func.__name__} '
314 'is not supported - consider using '
315 'PlateCarree/RotatedPole.')
317 kwargs['transform'] = transform
--> 318 return func(self, *args, **kwargs)
File /knight/mamba_aug23/envs/aug23_env/lib/python3.11/site-packages/cartopy/mpl/geoaxes.py:362, in _add_transform_first.<locals>.wrapper(self, *args, **kwargs)
360 # Use the new points as the input arguments
361 args = (x, y, z) + args[3:]
--> 362 return func(self, *args, **kwargs)
File /knight/mamba_aug23/envs/aug23_env/lib/python3.11/site-packages/cartopy/mpl/geoaxes.py:1662, in GeoAxes.contourf(self, *args, **kwargs)
1659 if not hasattr(sub_trans, 'force_path_ccw'):
1660 sub_trans.force_path_ccw = True
-> 1662 result = super().contourf(*args, **kwargs)
1664 # We need to compute the dataLim correctly for contours.
1665 bboxes = [col.get_datalim(self.transData)
1666 for col in result.collections
1667 if col.get_paths()]
File /knight/mamba_aug23/envs/aug23_env/lib/python3.11/site-packages/matplotlib/__init__.py:1442, in _preprocess_data.<locals>.inner(ax, data, *args, **kwargs)
1439 @functools.wraps(func)
1440 def inner(ax, *args, data=None, **kwargs):
1441 if data is None:
-> 1442 return func(ax, *map(sanitize_sequence, args), **kwargs)
1444 bound = new_sig.bind(ax, *args, **kwargs)
1445 auto_label = (bound.arguments.get(label_namer)
1446 or bound.kwargs.get(label_namer))
File /knight/mamba_aug23/envs/aug23_env/lib/python3.11/site-packages/matplotlib/axes/_axes.py:6467, in Axes.contourf(self, *args, **kwargs)
6458 """
6459 Plot filled contours.
6460
(...)
6464 %(contour_doc)s
6465 """
6466 kwargs['filled'] = True
-> 6467 contours = mcontour.QuadContourSet(self, *args, **kwargs)
6468 self._request_autoscale_view()
6469 return contours
File /knight/mamba_aug23/envs/aug23_env/lib/python3.11/site-packages/matplotlib/contour.py:769, in ContourSet.__init__(self, ax, levels, filled, linewidths, linestyles, hatches, alpha, origin, extent, cmap, colors, norm, vmin, vmax, extend, antialiased, nchunk, locator, transform, negative_linestyles, *args, **kwargs)
765 if self.negative_linestyles is None:
766 self.negative_linestyles = \
767 mpl.rcParams['contour.negative_linestyle']
--> 769 kwargs = self._process_args(*args, **kwargs)
770 self._process_levels()
772 self._extend_min = self.extend in ['min', 'both']
File /knight/mamba_aug23/envs/aug23_env/lib/python3.11/site-packages/matplotlib/contour.py:1411, in QuadContourSet._process_args(self, corner_mask, algorithm, *args, **kwargs)
1408 corner_mask = mpl.rcParams['contour.corner_mask']
1409 self._corner_mask = corner_mask
-> 1411 x, y, z = self._contour_args(args, kwargs)
1413 contour_generator = contourpy.contour_generator(
1414 x, y, z, name=self._algorithm, corner_mask=self._corner_mask,
1415 line_type=contourpy.LineType.SeparateCode,
1416 fill_type=contourpy.FillType.OuterCode,
1417 chunk_size=self.nchunk)
1419 t = self.get_transform()
File /knight/mamba_aug23/envs/aug23_env/lib/python3.11/site-packages/matplotlib/contour.py:1450, in QuadContourSet._contour_args(self, args, kwargs)
1448 elif nargs <= 4:
1449 x, y, z_orig, *args = args
-> 1450 x, y, z = self._check_xyz(x, y, z_orig, kwargs)
1451 else:
1452 raise _api.nargs_error(fn, takes="from 1 to 4", given=nargs)
File /knight/mamba_aug23/envs/aug23_env/lib/python3.11/site-packages/matplotlib/contour.py:1475, in QuadContourSet._check_xyz(self, x, y, z, kwargs)
1472 z = ma.asarray(z)
1474 if z.ndim != 2:
-> 1475 raise TypeError(f"Input z must be 2D, not {z.ndim}D")
1476 if z.shape[0] < 2 or z.shape[1] < 2:
1477 raise TypeError(f"Input z must be at least a (2, 2) shaped array, "
1478 f"but has shape {z.shape}")
TypeError: Input z must be 2D, not 3D
Z
<xarray.DataArray 'truediv-2f0b3ac192d450f946fff895443b747d' (time: 7,
latitude: 721,
longitude: 1440)>
<Quantity(dask.array<mul, shape=(7, 721, 1440), dtype=float32, chunksize=(1, 721, 1440), chunktype=numpy.ndarray>, 'decameter')>
Coordinates:
* latitude (latitude) float32 90.0 89.75 89.5 89.25 ... -89.5 -89.75 -90.0
level int64 500
* longitude (longitude) float32 0.0 0.25 0.5 0.75 ... 359.0 359.2 359.5 359.8
* time (time) datetime64[ns] 1993-03-13T18:00:00 ... 1993-03-14Z.isel(time=0)
<xarray.DataArray 'truediv-2f0b3ac192d450f946fff895443b747d' (latitude: 721,
longitude: 1440)>
<Quantity(dask.array<getitem, shape=(721, 1440), dtype=float32, chunksize=(721, 1440), chunktype=numpy.ndarray>, 'decameter')>
Coordinates:
* latitude (latitude) float32 90.0 89.75 89.5 89.25 ... -89.5 -89.75 -90.0
level int64 500
* longitude (longitude) float32 0.0 0.25 0.5 0.75 ... 359.0 359.2 359.5 359.8
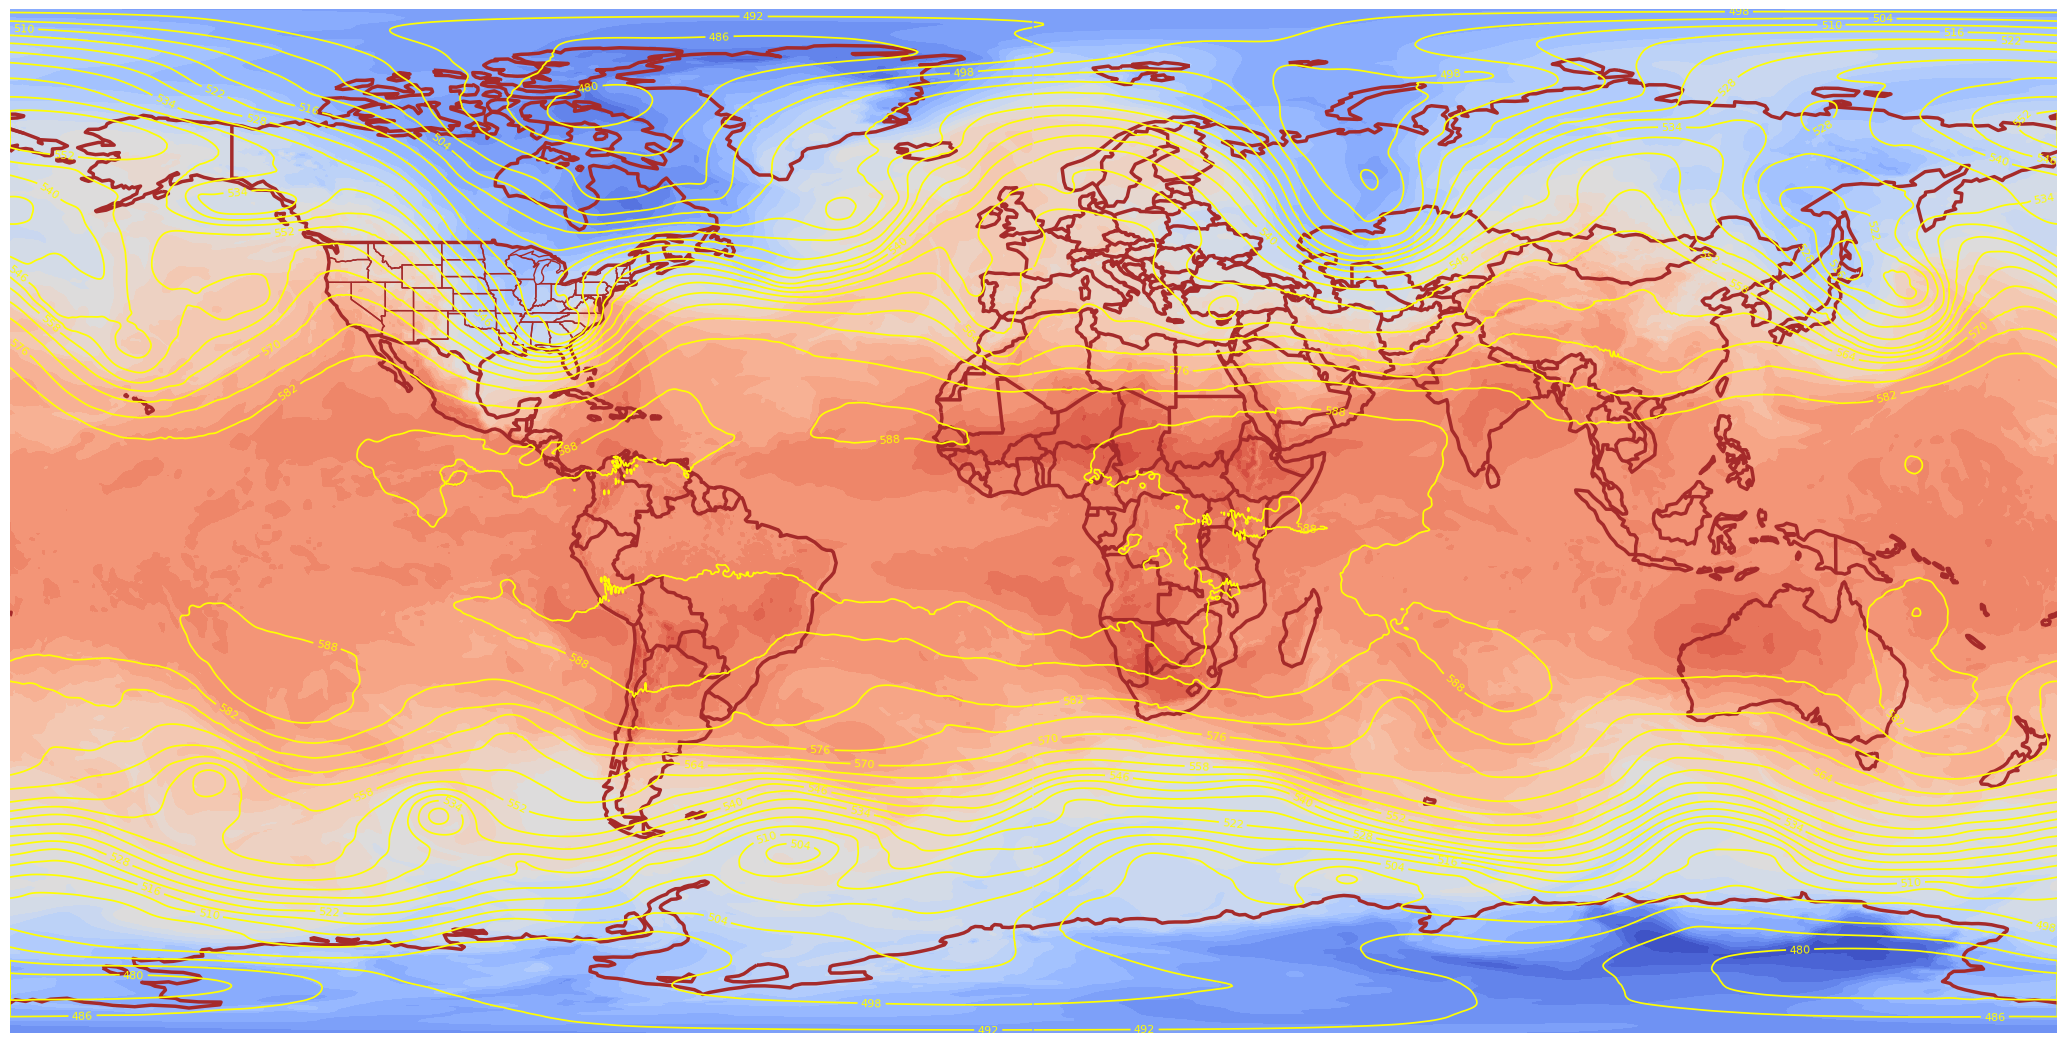
time datetime64[ns] 1993-03-13T18:00:00res = '110m'
dpi = 100
fig = plt.figure(figsize=(2048/dpi, 1024/dpi))
ax = plt.subplot(1,1,1,projection=projData, frameon=False)
ax.add_feature(cfeature.COASTLINE.with_scale(res), edgecolor='brown', linewidth=2.5)
ax.add_feature(cfeature.BORDERS.with_scale(res), edgecolor='brown', linewidth=2.5)
ax.add_feature(cfeature.STATES.with_scale(res), edgecolor='brown')
# Temperature (T) contour fills
# Note we don't need the transform argument since the map/data projections are the same, but we'll leave it in
CF = ax.contourf(lons,lats,T.isel(time=0),levels=tLevels,cmap=plt.get_cmap('coolwarm'), extend='both', transform=projData)
# Height (Z) contour lines
CL = ax.contour(lons,lats,Z.isel(time=0),zLevels,linewidths=1.25,colors='yellow', transform=projData)
ax.clabel(CL, inline_spacing=0.2, fontsize=8, fmt='%.0f')
fig.tight_layout(pad=.01)
lonW, lonE, latS, latN = -130, -60, 20, 55
lonRange = np.arange(lonW, lonE + 0.1, 0.25)
latRange = np.arange(latS, latN + 0.1, 0.25)
print(latRange)
[20. 20.25 20.5 20.75 21. 21.25 21.5 21.75 22. 22.25 22.5 22.75
23. 23.25 23.5 23.75 24. 24.25 24.5 24.75 25. 25.25 25.5 25.75
26. 26.25 26.5 26.75 27. 27.25 27.5 27.75 28. 28.25 28.5 28.75
29. 29.25 29.5 29.75 30. 30.25 30.5 30.75 31. 31.25 31.5 31.75
32. 32.25 32.5 32.75 33. 33.25 33.5 33.75 34. 34.25 34.5 34.75
35. 35.25 35.5 35.75 36. 36.25 36.5 36.75 37. 37.25 37.5 37.75
38. 38.25 38.5 38.75 39. 39.25 39.5 39.75 40. 40.25 40.5 40.75
41. 41.25 41.5 41.75 42. 42.25 42.5 42.75 43. 43.25 43.5 43.75
44. 44.25 44.5 44.75 45. 45.25 45.5 45.75 46. 46.25 46.5 46.75
47. 47.25 47.5 47.75 48. 48.25 48.5 48.75 49. 49.25 49.5 49.75
50. 50.25 50.5 50.75 51. 51.25 51.5 51.75 52. 52.25 52.5 52.75
53. 53.25 53.5 53.75 54. 54.25 54.5 54.75 55. ]
print(lonRange)
[-130. -129.75 -129.5 -129.25 -129. -128.75 -128.5 -128.25 -128.
-127.75 -127.5 -127.25 -127. -126.75 -126.5 -126.25 -126. -125.75
-125.5 -125.25 -125. -124.75 -124.5 -124.25 -124. -123.75 -123.5
-123.25 -123. -122.75 -122.5 -122.25 -122. -121.75 -121.5 -121.25
-121. -120.75 -120.5 -120.25 -120. -119.75 -119.5 -119.25 -119.
-118.75 -118.5 -118.25 -118. -117.75 -117.5 -117.25 -117. -116.75
-116.5 -116.25 -116. -115.75 -115.5 -115.25 -115. -114.75 -114.5
-114.25 -114. -113.75 -113.5 -113.25 -113. -112.75 -112.5 -112.25
-112. -111.75 -111.5 -111.25 -111. -110.75 -110.5 -110.25 -110.
-109.75 -109.5 -109.25 -109. -108.75 -108.5 -108.25 -108. -107.75
-107.5 -107.25 -107. -106.75 -106.5 -106.25 -106. -105.75 -105.5
-105.25 -105. -104.75 -104.5 -104.25 -104. -103.75 -103.5 -103.25
-103. -102.75 -102.5 -102.25 -102. -101.75 -101.5 -101.25 -101.
-100.75 -100.5 -100.25 -100. -99.75 -99.5 -99.25 -99. -98.75
-98.5 -98.25 -98. -97.75 -97.5 -97.25 -97. -96.75 -96.5
-96.25 -96. -95.75 -95.5 -95.25 -95. -94.75 -94.5 -94.25
-94. -93.75 -93.5 -93.25 -93. -92.75 -92.5 -92.25 -92.
-91.75 -91.5 -91.25 -91. -90.75 -90.5 -90.25 -90. -89.75
-89.5 -89.25 -89. -88.75 -88.5 -88.25 -88. -87.75 -87.5
-87.25 -87. -86.75 -86.5 -86.25 -86. -85.75 -85.5 -85.25
-85. -84.75 -84.5 -84.25 -84. -83.75 -83.5 -83.25 -83.
-82.75 -82.5 -82.25 -82. -81.75 -81.5 -81.25 -81. -80.75
-80.5 -80.25 -80. -79.75 -79.5 -79.25 -79. -78.75 -78.5
-78.25 -78. -77.75 -77.5 -77.25 -77. -76.75 -76.5 -76.25
-76. -75.75 -75.5 -75.25 -75. -74.75 -74.5 -74.25 -74.
-73.75 -73.5 -73.25 -73. -72.75 -72.5 -72.25 -72. -71.75
-71.5 -71.25 -71. -70.75 -70.5 -70.25 -70. -69.75 -69.5
-69.25 -69. -68.75 -68.5 -68.25 -68. -67.75 -67.5 -67.25
-67. -66.75 -66.5 -66.25 -66. -65.75 -65.5 -65.25 -65.
-64.75 -64.5 -64.25 -64. -63.75 -63.5 -63.25 -63. -62.75
-62.5 -62.25 -62. -61.75 -61.5 -61.25 -61. -60.75 -60.5
-60.25 -60. ]
ZSub2 = Z.sel(latitude = latRange, longitude = lonRange)
TSub2 = T.sel(latitude = latRange, longitude = lonRange)
---------------------------------------------------------------------------
KeyError Traceback (most recent call last)
Cell In[22], line 1
----> 1 ZSub2 = Z.sel(latitude = latRange, longitude = lonRange)
2 TSub2 = T.sel(latitude = latRange, longitude = lonRange)
File /knight/mamba_aug23/envs/aug23_env/lib/python3.11/site-packages/xarray/core/dataarray.py:1550, in DataArray.sel(self, indexers, method, tolerance, drop, **indexers_kwargs)
1440 def sel(
1441 self: T_DataArray,
1442 indexers: Mapping[Any, Any] | None = None,
(...)
1446 **indexers_kwargs: Any,
1447 ) -> T_DataArray:
1448 """Return a new DataArray whose data is given by selecting index
1449 labels along the specified dimension(s).
1450
(...)
1548 Dimensions without coordinates: points
1549 """
-> 1550 ds = self._to_temp_dataset().sel(
1551 indexers=indexers,
1552 drop=drop,
1553 method=method,
1554 tolerance=tolerance,
1555 **indexers_kwargs,
1556 )
1557 return self._from_temp_dataset(ds)
File /knight/mamba_aug23/envs/aug23_env/lib/python3.11/site-packages/xarray/core/dataset.py:2794, in Dataset.sel(self, indexers, method, tolerance, drop, **indexers_kwargs)
2733 """Returns a new dataset with each array indexed by tick labels
2734 along the specified dimension(s).
2735
(...)
2791 DataArray.sel
2792 """
2793 indexers = either_dict_or_kwargs(indexers, indexers_kwargs, "sel")
-> 2794 query_results = map_index_queries(
2795 self, indexers=indexers, method=method, tolerance=tolerance
2796 )
2798 if drop:
2799 no_scalar_variables = {}
File /knight/mamba_aug23/envs/aug23_env/lib/python3.11/site-packages/xarray/core/indexing.py:190, in map_index_queries(obj, indexers, method, tolerance, **indexers_kwargs)
188 results.append(IndexSelResult(labels))
189 else:
--> 190 results.append(index.sel(labels, **options))
192 merged = merge_sel_results(results)
194 # drop dimension coordinates found in dimension indexers
195 # (also drop multi-index if any)
196 # (.sel() already ensures alignment)
File /knight/mamba_aug23/envs/aug23_env/lib/python3.11/site-packages/xarray/core/indexes.py:498, in PandasIndex.sel(self, labels, method, tolerance)
496 indexer = get_indexer_nd(self.index, label_array, method, tolerance)
497 if np.any(indexer < 0):
--> 498 raise KeyError(f"not all values found in index {coord_name!r}")
500 # attach dimension names and/or coordinates to positional indexer
501 if isinstance(label, Variable):
KeyError: "not all values found in index 'longitude'"
lats
<xarray.DataArray 'latitude' (latitude: 721)>
array([ 90. , 89.75, 89.5 , ..., -89.5 , -89.75, -90. ], dtype=float32)
Coordinates:
* latitude (latitude) float32 90.0 89.75 89.5 89.25 ... -89.5 -89.75 -90.0
level int64 500
Attributes:
long_name: latitude
units: degrees_northlons
<xarray.DataArray 'longitude' (longitude: 1440)>
array([0.0000e+00, 2.5000e-01, 5.0000e-01, ..., 3.5925e+02, 3.5950e+02,
       3.5975e+02], dtype=float32)
Coordinates:
level int64 500
* longitude (longitude) float32 0.0 0.25 0.5 0.75 ... 359.0 359.2 359.5 359.8
Attributes:
long_name: longitude
units: degrees_eastZSub2 = Z.sel(latitude = latRange, longitude = lonRange)
TSub2 = T.sel(latitude = latRange, longitude = lonRange)
---------------------------------------------------------------------------
KeyError Traceback (most recent call last)
Cell In[25], line 1
----> 1 ZSub2 = Z.sel(latitude = latRange, longitude = lonRange)
2 TSub2 = T.sel(latitude = latRange, longitude = lonRange)
File /knight/mamba_aug23/envs/aug23_env/lib/python3.11/site-packages/xarray/core/dataarray.py:1550, in DataArray.sel(self, indexers, method, tolerance, drop, **indexers_kwargs)
1440 def sel(
1441 self: T_DataArray,
1442 indexers: Mapping[Any, Any] | None = None,
(...)
1446 **indexers_kwargs: Any,
1447 ) -> T_DataArray:
1448 """Return a new DataArray whose data is given by selecting index
1449 labels along the specified dimension(s).
1450
(...)
1548 Dimensions without coordinates: points
1549 """
-> 1550 ds = self._to_temp_dataset().sel(
1551 indexers=indexers,
1552 drop=drop,
1553 method=method,
1554 tolerance=tolerance,
1555 **indexers_kwargs,
1556 )
1557 return self._from_temp_dataset(ds)
File /knight/mamba_aug23/envs/aug23_env/lib/python3.11/site-packages/xarray/core/dataset.py:2794, in Dataset.sel(self, indexers, method, tolerance, drop, **indexers_kwargs)
2733 """Returns a new dataset with each array indexed by tick labels
2734 along the specified dimension(s).
2735
(...)
2791 DataArray.sel
2792 """
2793 indexers = either_dict_or_kwargs(indexers, indexers_kwargs, "sel")
-> 2794 query_results = map_index_queries(
2795 self, indexers=indexers, method=method, tolerance=tolerance
2796 )
2798 if drop:
2799 no_scalar_variables = {}
File /knight/mamba_aug23/envs/aug23_env/lib/python3.11/site-packages/xarray/core/indexing.py:190, in map_index_queries(obj, indexers, method, tolerance, **indexers_kwargs)
188 results.append(IndexSelResult(labels))
189 else:
--> 190 results.append(index.sel(labels, **options))
192 merged = merge_sel_results(results)
194 # drop dimension coordinates found in dimension indexers
195 # (also drop multi-index if any)
196 # (.sel() already ensures alignment)
File /knight/mamba_aug23/envs/aug23_env/lib/python3.11/site-packages/xarray/core/indexes.py:498, in PandasIndex.sel(self, labels, method, tolerance)
496 indexer = get_indexer_nd(self.index, label_array, method, tolerance)
497 if np.any(indexer < 0):
--> 498 raise KeyError(f"not all values found in index {coord_name!r}")
500 # attach dimension names and/or coordinates to positional indexer
501 if isinstance(label, Variable):
KeyError: "not all values found in index 'longitude'"
lonW, lonE, latS, latN = -130, -60, 20, 55
Z.latitude
<xarray.DataArray 'latitude' (latitude: 721)>
array([ 90. , 89.75, 89.5 , ..., -89.5 , -89.75, -90. ], dtype=float32)
Coordinates:
* latitude (latitude) float32 90.0 89.75 89.5 89.25 ... -89.5 -89.75 -90.0
level int64 500
Attributes:
long_name: latitude
units: degrees_northZ.longitude
<xarray.DataArray 'longitude' (longitude: 1440)>
array([0.0000e+00, 2.5000e-01, 5.0000e-01, ..., 3.5925e+02, 3.5950e+02,
       3.5975e+02], dtype=float32)
Coordinates:
level int64 500
* longitude (longitude) float32 0.0 0.25 0.5 0.75 ... 359.0 359.2 359.5 359.8
Attributes:
long_name: longitude
units: degrees_eastZSub2 = Z.sel(latitude = latRange, longitude = lonRange)
TSub2 = T.sel(latitude = latRange, longitude = lonRange)
---------------------------------------------------------------------------
KeyError Traceback (most recent call last)
Cell In[29], line 1
----> 1 ZSub2 = Z.sel(latitude = latRange, longitude = lonRange)
2 TSub2 = T.sel(latitude = latRange, longitude = lonRange)
File /knight/mamba_aug23/envs/aug23_env/lib/python3.11/site-packages/xarray/core/dataarray.py:1550, in DataArray.sel(self, indexers, method, tolerance, drop, **indexers_kwargs)
1440 def sel(
1441 self: T_DataArray,
1442 indexers: Mapping[Any, Any] | None = None,
(...)
1446 **indexers_kwargs: Any,
1447 ) -> T_DataArray:
1448 """Return a new DataArray whose data is given by selecting index
1449 labels along the specified dimension(s).
1450
(...)
1548 Dimensions without coordinates: points
1549 """
-> 1550 ds = self._to_temp_dataset().sel(
1551 indexers=indexers,
1552 drop=drop,
1553 method=method,
1554 tolerance=tolerance,
1555 **indexers_kwargs,
1556 )
1557 return self._from_temp_dataset(ds)
File /knight/mamba_aug23/envs/aug23_env/lib/python3.11/site-packages/xarray/core/dataset.py:2794, in Dataset.sel(self, indexers, method, tolerance, drop, **indexers_kwargs)
2733 """Returns a new dataset with each array indexed by tick labels
2734 along the specified dimension(s).
2735
(...)
2791 DataArray.sel
2792 """
2793 indexers = either_dict_or_kwargs(indexers, indexers_kwargs, "sel")
-> 2794 query_results = map_index_queries(
2795 self, indexers=indexers, method=method, tolerance=tolerance
2796 )
2798 if drop:
2799 no_scalar_variables = {}
File /knight/mamba_aug23/envs/aug23_env/lib/python3.11/site-packages/xarray/core/indexing.py:190, in map_index_queries(obj, indexers, method, tolerance, **indexers_kwargs)
188 results.append(IndexSelResult(labels))
189 else:
--> 190 results.append(index.sel(labels, **options))
192 merged = merge_sel_results(results)
194 # drop dimension coordinates found in dimension indexers
195 # (also drop multi-index if any)
196 # (.sel() already ensures alignment)
File /knight/mamba_aug23/envs/aug23_env/lib/python3.11/site-packages/xarray/core/indexes.py:498, in PandasIndex.sel(self, labels, method, tolerance)
496 indexer = get_indexer_nd(self.index, label_array, method, tolerance)
497 if np.any(indexer < 0):
--> 498 raise KeyError(f"not all values found in index {coord_name!r}")
500 # attach dimension names and/or coordinates to positional indexer
501 if isinstance(label, Variable):
KeyError: "not all values found in index 'longitude'"
lonW, lonE, latN, latS = 230, 290, 55, 20
lonRange = np.arange(lonW, lonE - 0.1, 0.25)
latRange = np.arange(latN, latS - 0.1, -0.25)
ZSub2 = Z.sel(latitude = latRange, longitude = lonRange)
TSub2 = T.sel(latitude = latRange, longitude = lonRange)
ZSub2
<xarray.DataArray 'truediv-2f0b3ac192d450f946fff895443b747d' (time: 7,
latitude: 141,
longitude: 240)>
<Quantity(dask.array<getitem, shape=(7, 141, 240), dtype=float32, chunksize=(1, 141, 240), chunktype=numpy.ndarray>, 'decameter')>
Coordinates:
* latitude (latitude) float32 55.0 54.75 54.5 54.25 ... 20.5 20.25 20.0
level int64 500
* longitude (longitude) float32 230.0 230.2 230.5 230.8 ... 289.2 289.5 289.8
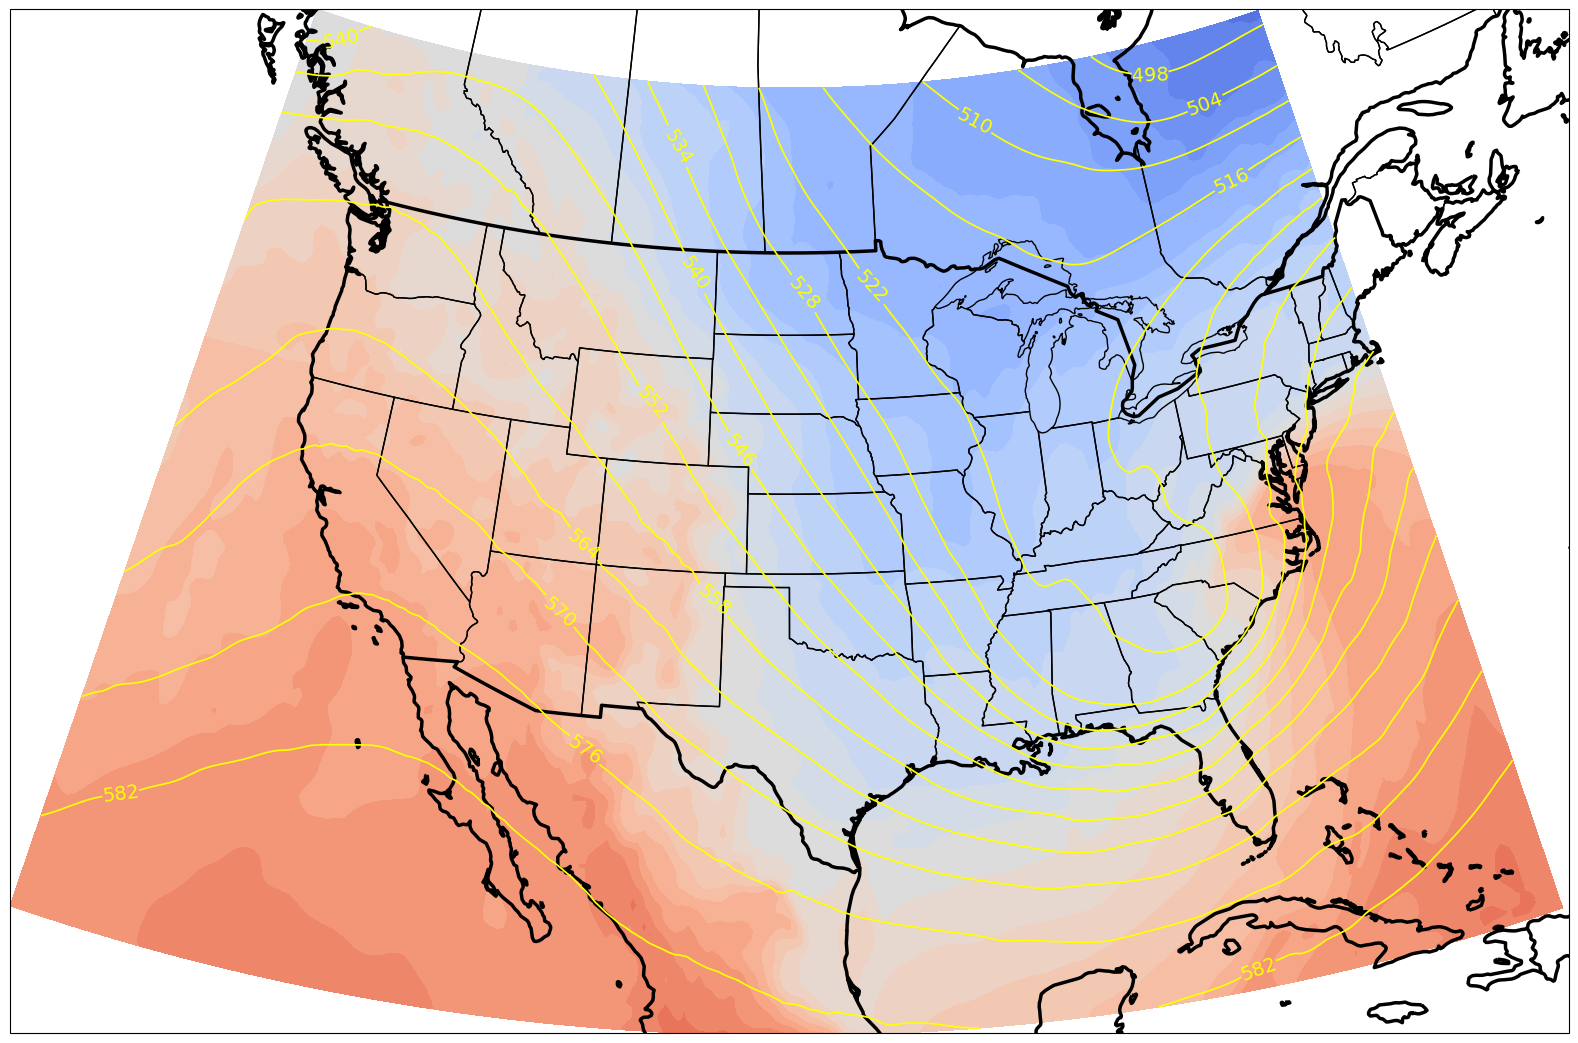
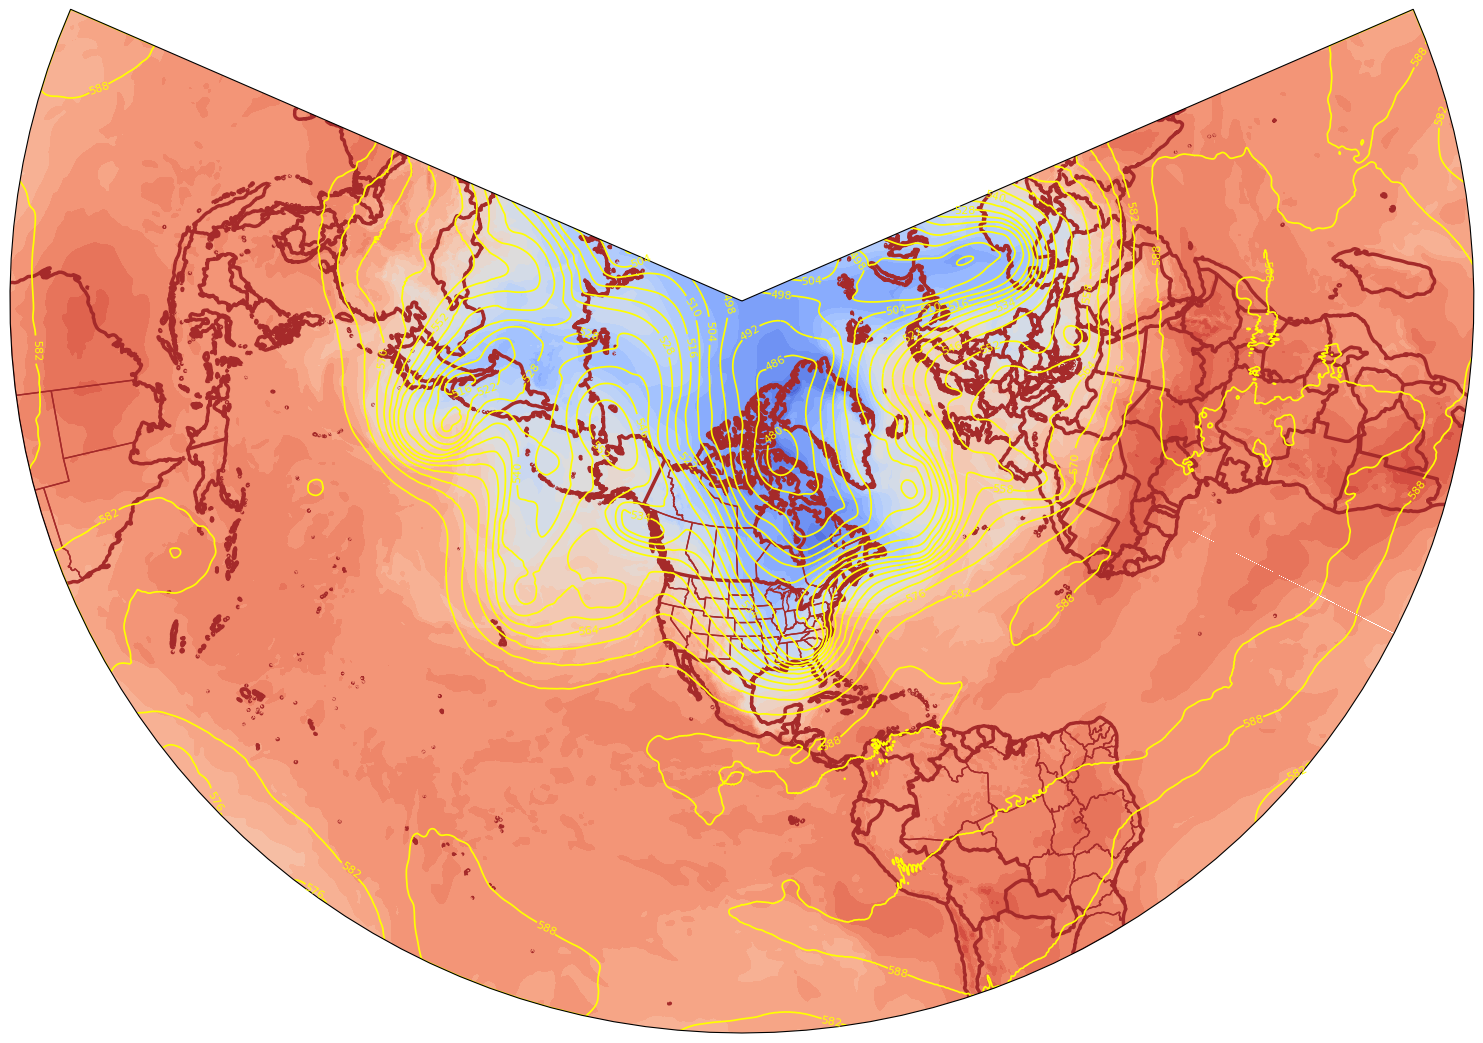
* time (time) datetime64[ns] 1993-03-13T18:00:00 ... 1993-03-14projMap = ccrs.LambertConformal(central_longitude=(lonW + lonE) / 2., central_latitude=(latS + latN) / 2.)
%%time
res = '50m'
dpi = 100
fig = plt.figure(figsize=(2048/dpi, 1024/dpi))
ax = plt.subplot(1,1,1,projection=projMap)

ax.add_feature(cfeature.COASTLINE.with_scale(res), edgecolor='brown', linewidth=2.5)
ax.add_feature(cfeature.BORDERS.with_scale(res), edgecolor='brown', linewidth=2.5)
ax.add_feature(cfeature.STATES.with_scale(res), edgecolor='brown')

# Temperature (T) contour fills

CF = ax.contourf(lons,lats,T.isel(time=0),levels=tLevels,cmap=plt.get_cmap('coolwarm'), extend='both', transform=projData)

# Height (Z) contour lines
CL = ax.contour(lons,lats,Z.isel(time=0),zLevels,linewidths=1.25,colors='yellow', transform=projData)
ax.clabel(CL, inline_spacing=0.2, fontsize=8, fmt='%.0f')
fig.tight_layout(pad=.01)
CPU times: user 45.5 s, sys: 969 ms, total: 46.4 s
Wall time: 48.8 s
%%time
res = '50m'
dpi = 100
fig = plt.figure(figsize=(2048/dpi, 1024/dpi))
ax = plt.subplot(1,1,1,projection=projMap)
ax.set_extent([lonW, lonE, latS, latN], crs=ccrs.PlateCarree())
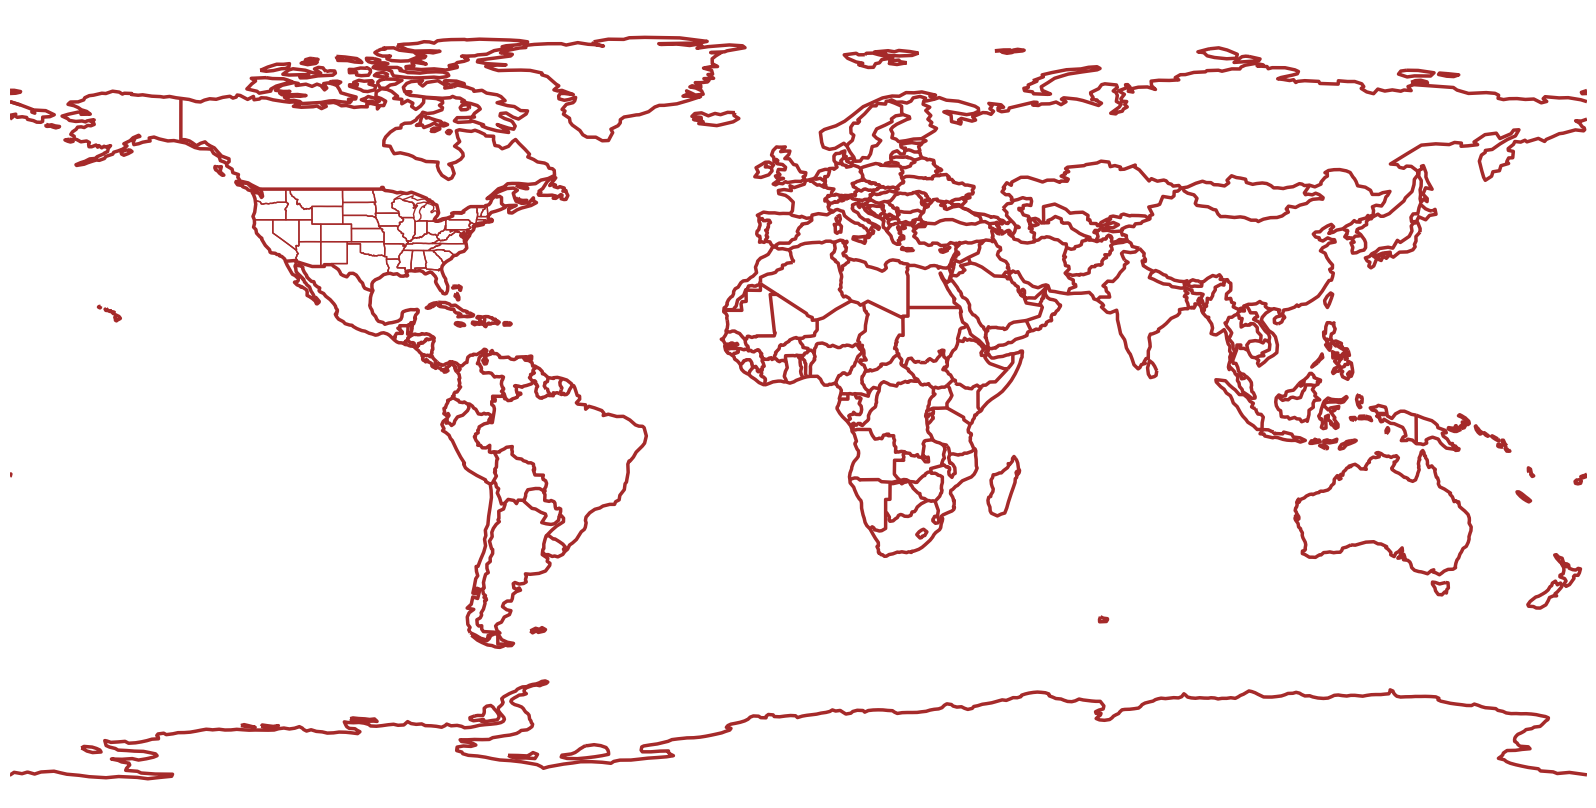
ax.add_feature(cfeature.COASTLINE.with_scale(res), edgecolor='k', linewidth=2.5)
ax.add_feature(cfeature.BORDERS.with_scale(res), edgecolor='k', linewidth=2.5)
ax.add_feature(cfeature.STATES.with_scale(res), edgecolor='k')
# Temperature (T) contour fills
CF = ax.contourf(TSub2.longitude,TSub2.latitude,TSub2.isel(time=0),levels=tLevels,cmap=plt.get_cmap('coolwarm'), extend='both', transform=projData)
# Height (Z) contour lines
CL = ax.contour(TSub2.longitude,TSub2.latitude,ZSub2.isel(time=0),zLevels,linewidths=1.25,colors='yellow', transform=projData)
ax.clabel(CL, inline_spacing=0.2, fontsize=14, fmt='%.0f')
fig.tight_layout(pad=.01)
CPU times: user 2.24 s, sys: 560 ms, total: 2.8 s
Wall time: 4.93 s