02_InteractiveVisualization Part 1: Geoviews
Contents
|
|

|

|
02_InteractiveVisualization Part 1: Geoviews
Overview
A team at Google Research & Cloud are making parts of the ECMWF Reanalysis version 5 (aka ERA-5) accessible in a Analysis Ready, Cloud Optimized (aka ARCO) format.
In this notebook, we will do the following:
Access the ERA-5 ARCO catalog
Select a particular dataset and variable from the catalog
Convert the data from Gaussian to Cartesian coordinates
Plot a map of sea-level pressure contours and 2-meter temperature mesh using Geoviews.
Prerequisites
Concepts |
Importance |
Notes |
|---|---|---|
Necessary |
||
Necessary |
||
[Geoviews] |
Necessary |
Time to learn: 30 minutes
Imports
import fsspec
import xarray as xr
import matplotlib.pyplot as plt
import cartopy.crs as ccrs
import cartopy.feature as cfeature
from metpy import calc as mpcalc
from metpy.units import units
import metpy
import scipy.spatial
import numpy as np
/knight/mamba_aug23/envs/sep23_env/lib/python3.11/site-packages/dask/config.py:742: FutureWarning: Dask configuration key 'ucx.cuda-copy' has been deprecated; please use 'distributed.ucx.cuda_copy' instead
  warnings.warn(
/knight/mamba_aug23/envs/sep23_env/lib/python3.11/site-packages/dask/config.py:742: FutureWarning: Dask configuration key 'ucx.tcp' has been deprecated; please use 'distributed.ucx.tcp' instead
  warnings.warn(
/knight/mamba_aug23/envs/sep23_env/lib/python3.11/site-packages/dask/config.py:742: FutureWarning: Dask configuration key 'ucx.nvlink' has been deprecated; please use 'distributed.ucx.nvlink' instead
  warnings.warn(
/knight/mamba_aug23/envs/sep23_env/lib/python3.11/site-packages/dask/config.py:742: FutureWarning: Dask configuration key 'ucx.infiniband' has been deprecated; please use 'distributed.ucx.infiniband' instead
  warnings.warn(
/knight/mamba_aug23/envs/sep23_env/lib/python3.11/site-packages/dask/config.py:742: FutureWarning: Dask configuration key 'ucx.rdmacm' has been deprecated; please use 'distributed.ucx.rdmacm' instead
  warnings.warn(
/knight/mamba_aug23/envs/sep23_env/lib/python3.11/site-packages/dask/config.py:742: FutureWarning: Dask configuration key 'ucx.net-devices' has been deprecated; please use 'distributed.ucx.net-devices' instead
  warnings.warn(
/knight/mamba_aug23/envs/sep23_env/lib/python3.11/site-packages/dask/config.py:742: FutureWarning: Dask configuration key 'ucx.reuse-endpoints' has been deprecated; please use 'distributed.ucx.reuse-endpoints' instead
  warnings.warn(
/knight/mamba_aug23/envs/sep23_env/lib/python3.11/site-packages/dask/config.py:742: FutureWarning: Dask configuration key 'rmm.pool-size' has been deprecated; please use 'distributed.rmm.pool-size' instead
  warnings.warn(
Access the ARCO ERA-5 catalog on Google Cloud
Let’s open the 37-level isobaric surfaces reanalysis Zarr file
reanalysis = xr.open_zarr(
    'gs://gcp-public-data-arco-era5/ar/1959-2022-full_37-1h-0p25deg-chunk-1.zarr-v2',
    chunks={'time': 48},
    consolidated=True,
)
reanalysis
<xarray.Dataset>
Dimensions:                                           (time: 552264,
                                                       latitude: 721,
                                                       longitude: 1440,
                                                       level: 37)
Coordinates:
  * latitude                                          (latitude) float32 90.0...
  * level                                             (level) int64 1 2 ... 1000
  * longitude                                         (longitude) float32 0.0...
  * time                                              (time) datetime64[ns] 1...
Data variables: (12/31)
    10m_u_component_of_wind                           (time, latitude, longitude) float32 dask.array<chunksize=(48, 721, 1440), meta=np.ndarray>
    10m_v_component_of_wind                           (time, latitude, longitude) float32 dask.array<chunksize=(48, 721, 1440), meta=np.ndarray>
    2m_temperature                                    (time, latitude, longitude) float32 dask.array<chunksize=(48, 721, 1440), meta=np.ndarray>
    angle_of_sub_gridscale_orography                  (latitude, longitude) float32 dask.array<chunksize=(721, 1440), meta=np.ndarray>
    anisotropy_of_sub_gridscale_orography             (latitude, longitude) float32 dask.array<chunksize=(721, 1440), meta=np.ndarray>
    geopotential                                      (time, level, latitude, longitude) float32 dask.array<chunksize=(48, 37, 721, 1440), meta=np.ndarray>
    ...                                                ...
    total_precipitation                               (time, latitude, longitude) float32 dask.array<chunksize=(48, 721, 1440), meta=np.ndarray>
    type_of_high_vegetation                           (latitude, longitude) float32 dask.array<chunksize=(721, 1440), meta=np.ndarray>
    type_of_low_vegetation                            (latitude, longitude) float32 dask.array<chunksize=(721, 1440), meta=np.ndarray>
    u_component_of_wind                               (time, level, latitude, longitude) float32 dask.array<chunksize=(48, 37, 721, 1440), meta=np.ndarray>
    v_component_of_wind                               (time, level, latitude, longitude) float32 dask.array<chunksize=(48, 37, 721, 1440), meta=np.ndarray>
vertical_velocity (time, level, latitude, longitude) float32 dask.array<chunksize=(48, 37, 721, 1440), meta=np.ndarray>geop = reanalysis.geopotential
temp = reanalysis.temperature
geop
<xarray.DataArray 'geopotential' (time: 552264, level: 37, latitude: 721,
                                  longitude: 1440)>
dask.array<open_dataset-geopotential, shape=(552264, 37, 721, 1440), dtype=float32, chunksize=(48, 37, 721, 1440), chunktype=numpy.ndarray>
Coordinates:
  * latitude   (latitude) float32 90.0 89.75 89.5 89.25 ... -89.5 -89.75 -90.0
  * level      (level) int64 1 2 3 5 7 10 20 30 ... 850 875 900 925 950 975 1000
  * longitude  (longitude) float32 0.0 0.25 0.5 0.75 ... 359.0 359.2 359.5 359.8
  * time       (time) datetime64[ns] 1959-01-01 ... 2021-12-31T23:00:00
Attributes:
    long_name:      Geopotential
    short_name:     z
    standard_name:  geopotential
units: m**2 s**-2Select time and level ranges from the dataset.
geopSub1 = geop.sel(time=slice('1993-03-13T18:00:00','1993-03-14T00:00:00'), level=500).compute()
tempSub1 = temp.sel(time=slice('1993-03-13T18:00:00','1993-03-14T00:00:00'), level=850).compute()
/knight/mamba_aug23/envs/sep23_env/lib/python3.11/site-packages/dask/config.py:742: FutureWarning: Dask configuration key 'ucx' has been deprecated; please use 'distributed.comm.ucx' instead
  warnings.warn(
/knight/mamba_aug23/envs/sep23_env/lib/python3.11/site-packages/dask/config.py:742: FutureWarning: Dask configuration key 'rmm' has been deprecated; please use 'distributed.rmm' instead
  warnings.warn(
Convert to dam and deg C.
Z = mpcalc.geopotential_to_height(geopSub1).metpy.convert_units('dam')
T = tempSub1.metpy.convert_units('degC')
Z
<xarray.DataArray (time: 7, latitude: 721, longitude: 1440)>
<Quantity([[[496.11923 496.11923 496.11923 ... 496.11923 496.11923 496.11923]
  [495.4044  495.40805 495.40988 ... 495.39526 495.4008  495.4026 ]
  [494.79037 494.7941  494.79956 ... 494.77393 494.77945 494.78488]
  ...
  [491.92023 491.91656 491.91656 ... 491.92023 491.92023 491.92023]
  [491.47482 491.47482 491.47482 ... 491.47482 491.47482 491.47482]
  [491.01846 491.01846 491.01846 ... 491.01846 491.01846 491.01846]]

 [[496.9404  496.9404  496.9404  ... 496.9404  496.9404  496.9404 ]
  [496.1687  496.17236 496.17422 ... 496.15958 496.16138 496.16684]
  [495.5034  495.51074 495.51627 ... 495.48688 495.4924  495.49786]
  ...
  [492.12735 492.12735 492.12735 ... 492.12915 492.12915 492.12915]
  [491.70944 491.70578 491.70578 ... 491.70944 491.70944 491.70944]
  [491.2622  491.2622  491.2622  ... 491.2622  491.2622  491.2622 ]]

 [[497.71384 497.71384 497.71384 ... 497.71384 497.71384 497.71384]
  [496.88535 496.88718 496.89084 ... 496.87436 496.878   496.87985]
  [496.17422 496.18335 496.187   ... 496.1577  496.16504 496.17056]
  ...
...
  ...
  [492.77792 492.77792 492.77792 ... 492.7798  492.7798  492.7798 ]
  [492.3491  492.34543 492.34543 ... 492.3491  492.3491  492.3491 ]
  [491.8854  491.8854  491.8854  ... 491.8854  491.8854  491.8854 ]]

 [[500.47592 500.47592 500.47592 ... 500.47592 500.47592 500.47592]
  [499.58884 499.5925  499.5962  ... 499.57593 499.5796  499.58517]
  [498.8355  498.84283 498.85016 ... 498.81174 498.819   498.8264 ]
  ...
  [492.83292 492.83292 492.83292 ... 492.83478 492.83292 492.83292]
  [492.38574 492.38574 492.38574 ... 492.38574 492.38574 492.38574]
  [491.92023 491.92023 491.92023 ... 491.92023 491.92023 491.92023]]

 [[501.2972  501.2972  501.2972  ... 501.2972  501.2972  501.2972 ]
  [500.40225 500.4078  500.40973 ... 500.39102 500.39478 500.40036]
  [499.6473  499.65485 499.66232 ... 499.6268  499.63428 499.64175]
  ...
  [492.91885 492.91885 492.91885 ... 492.9226  492.9226  492.9226 ]
  [492.4518  492.4518  492.4518  ... 492.4518  492.4518  492.4518 ]
  [491.97714 491.97714 491.97714 ... 491.97714 491.97714 491.97714]]], 'decameter')>
Coordinates:
  * latitude   (latitude) float32 90.0 89.75 89.5 89.25 ... -89.5 -89.75 -90.0
    level      int64 500
  * longitude  (longitude) float32 0.0 0.25 0.5 0.75 ... 359.0 359.2 359.5 359.8
* time (time) datetime64[ns] 1993-03-13T18:00:00 ... 1993-03-14T
<xarray.DataArray 'temperature' (time: 7, latitude: 721, longitude: 1440)>
<Quantity([[[-27.231277 -27.231277 -27.231277 ... -27.231277 -27.231277 -27.231277]
  [-27.653152 -27.650772 -27.650772 ... -27.656723 -27.654343 -27.653152]
  [-28.072647 -28.070251 -28.069061 ... -28.080978 -28.076218 -28.075027]
  ...
  [-29.216705 -29.2191   -29.2191   ... -29.215515 -29.216705 -29.216705]
  [-29.601654 -29.601654 -29.601654 ... -29.601654 -29.601654 -29.601654]
  [-30.096222 -30.096222 -30.096222 ... -30.096222 -30.096222 -30.096222]]

 [[-27.255112 -27.255112 -27.255112 ... -27.255112 -27.255112 -27.255112]
  [-27.598328 -27.595947 -27.594757 ... -27.601898 -27.600708 -27.598328]
  [-27.967773 -27.964188 -27.961807 ... -27.973724 -27.971344 -27.970154]
  ...
  [-29.051056 -29.051056 -29.053452 ... -29.047485 -29.047485 -29.049866]
  [-29.444336 -29.444336 -29.444336 ... -29.444336 -29.444336 -29.444336]
  [-29.961548 -29.961548 -29.961548 ... -29.961548 -29.961548 -29.961548]]

 [[-27.234848 -27.234848 -27.234848 ... -27.234848 -27.234848 -27.234848]
  [-27.538742 -27.537552 -27.535172 ... -27.543518 -27.541122 -27.538742]
  [-27.901031 -27.898651 -27.89627  ... -27.908188 -27.906982 -27.904602]
  ...
...
  ...
  [-28.604156 -28.607727 -28.610123 ... -28.59462  -28.598206 -28.600586]
  [-28.928314 -28.930695 -28.931885 ... -28.924744 -28.925934 -28.925934]
  [-29.38713  -29.38713  -29.38713  ... -29.38713  -29.38713  -29.38713 ]]

 [[-26.82727  -26.82727  -26.82727  ... -26.82727  -26.82727  -26.82727 ]
  [-27.004837 -27.002457 -27.001266 ... -27.008423 -27.007233 -27.007233]
  [-27.172882 -27.169312 -27.166916 ... -27.182419 -27.178833 -27.175262]
  ...
  [-28.549347 -28.554108 -28.555298 ... -28.54219  -28.54457  -28.548141]
  [-28.811523 -28.813904 -28.813904 ... -28.807953 -28.809143 -28.809143]
  [-29.171432 -29.171432 -29.171432 ... -29.171432 -29.171432 -29.171432]]

 [[-26.590942 -26.590942 -26.590942 ... -26.590942 -26.590942 -26.590942]
  [-26.659225 -26.658035 -26.658035 ... -26.664032 -26.664032 -26.661621]
  [-26.710754 -26.708359 -26.704758 ... -26.717941 -26.716736 -26.714355]
  ...
  [-28.46251  -28.46611  -28.470901 ... -28.450531 -28.454132 -28.458923]
  [-28.663803 -28.666199 -28.667404 ... -28.660217 -28.661407 -28.661407]
  [-28.958557 -28.958557 -28.958557 ... -28.958557 -28.958557 -28.958557]]], 'degree_Celsius')>
Coordinates:
  * latitude   (latitude) float32 90.0 89.75 89.5 89.25 ... -89.5 -89.75 -90.0
    level      int64 850
  * longitude  (longitude) float32 0.0 0.25 0.5 0.75 ... 359.0 359.2 359.5 359.8
  * time       (time) datetime64[ns] 1993-03-13T18:00:00 ... 1993-03-14
Attributes:
    long_name:      Temperature
    short_name:     t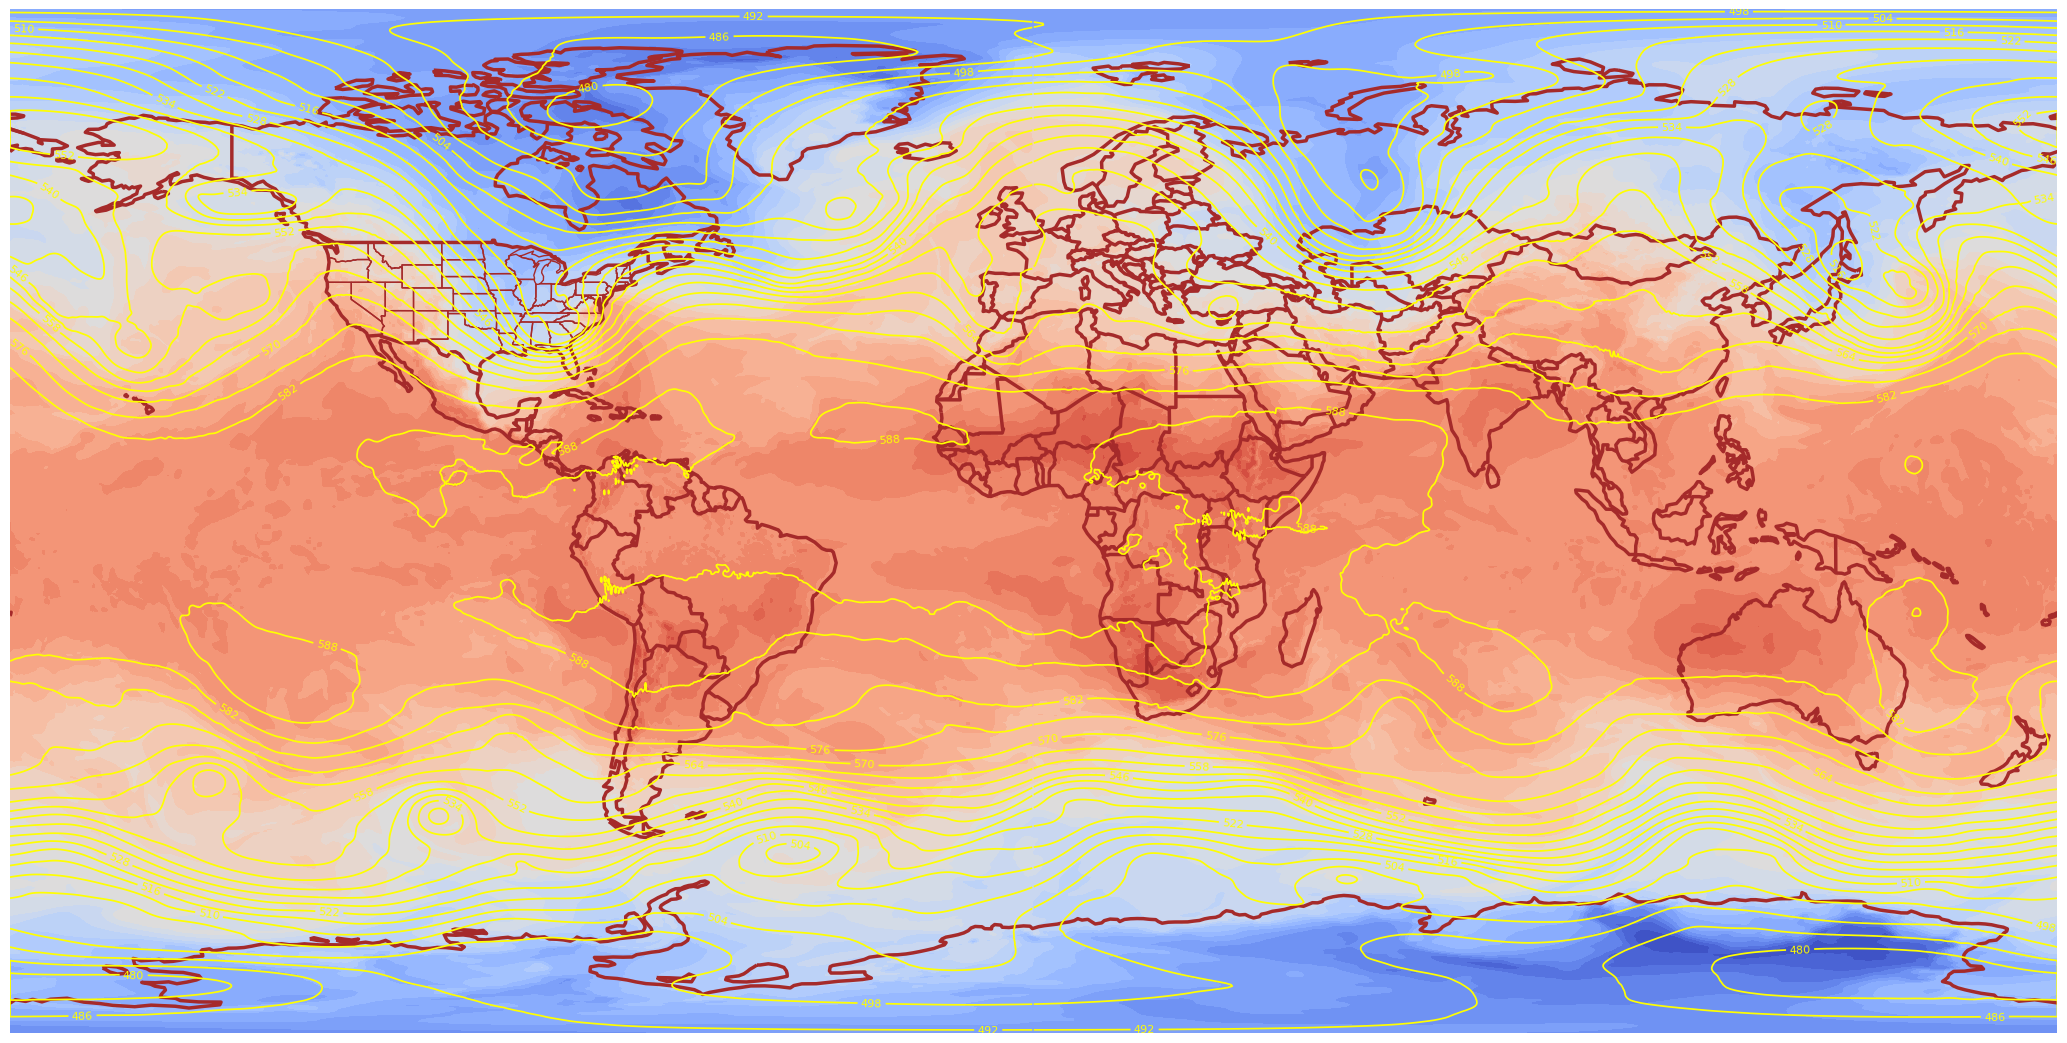
standard_name: air_temperaturePlot the data using Matplotlib
projData = ccrs.PlateCarree()
lons, lats = Z.longitude, Z.latitude
tLevels = np.arange(-45,39,3)
zLevels = np.arange(468, 606, 6)
res = '110m'
dpi = 100
fig = plt.figure(figsize=(2048/dpi, 1024/dpi))
ax = plt.subplot(1,1,1,projection=projData, frameon=False)

ax.add_feature(cfeature.COASTLINE.with_scale(res), edgecolor='brown', linewidth=2.5)
ax.add_feature(cfeature.BORDERS.with_scale(res), edgecolor='brown', linewidth=2.5)
ax.add_feature(cfeature.STATES.with_scale(res), edgecolor='brown')

# Temperature (T) contour fills

# Note we don't need the transform argument since the map/data projections are the same, but we'll leave it in
CF = ax.contourf(lons,lats,T,levels=tLevels,cmap=plt.get_cmap('coolwarm'), extend='both', transform=projData)

# Height (Z) contour lines
CL = ax.contour(lons,lats,Z,zLevels,linewidths=1.25,colors='yellow', transform=projData)
ax.clabel(CL, inline_spacing=0.2, fontsize=8, fmt='%.0f')
fig.tight_layout(pad=.01)
---------------------------------------------------------------------------
TypeError                                 Traceback (most recent call last)
Cell In[14], line 13
      8 ax.add_feature(cfeature.STATES.with_scale(res), edgecolor='brown')
     10 # Temperature (T) contour fills
     11
     12 # Note we don't need the transform argument since the map/data projections are the same, but we'll leave it in
---> 13 CF = ax.contourf(lons,lats,T,levels=tLevels,cmap=plt.get_cmap('coolwarm'), extend='both', transform=projData)
     15 # Height (Z) contour lines
     16 CL = ax.contour(lons,lats,Z,zLevels,linewidths=1.25,colors='yellow', transform=projData)

File /knight/mamba_aug23/envs/sep23_env/lib/python3.11/site-packages/cartopy/mpl/geoaxes.py:315, in _add_transform.<locals>.wrapper(self, *args, **kwargs)
    310     raise ValueError(f'Invalid transform: Spherical {func.__name__} '
    311                      'is not supported - consider using '
    312                      'PlateCarree/RotatedPole.')
    314 kwargs['transform'] = transform
--> 315 return func(self, *args, **kwargs)

File /knight/mamba_aug23/envs/sep23_env/lib/python3.11/site-packages/cartopy/mpl/geoaxes.py:359, in _add_transform_first.<locals>.wrapper(self, *args, **kwargs)
    357     # Use the new points as the input arguments
    358     args = (x, y, z) + args[3:]
--> 359 return func(self, *args, **kwargs)

File /knight/mamba_aug23/envs/sep23_env/lib/python3.11/site-packages/cartopy/mpl/geoaxes.py:1655, in GeoAxes.contourf(self, *args, **kwargs)
   1652             if not hasattr(sub_trans, 'force_path_ccw'):
   1653                 sub_trans.force_path_ccw = True
-> 1655 result = super().contourf(*args, **kwargs)
   1657 # We need to compute the dataLim correctly for contours.
   1658 if _MPL_VERSION.release[:2] < (3, 8):

File /knight/mamba_aug23/envs/sep23_env/lib/python3.11/site-packages/matplotlib/__init__.py:1446, in _preprocess_data.<locals>.inner(ax, data, *args, **kwargs)
   1443 @functools.wraps(func)
   1444 def inner(ax, *args, data=None, **kwargs):
   1445     if data is None:
-> 1446         return func(ax, *map(sanitize_sequence, args), **kwargs)
   1448     bound = new_sig.bind(ax, *args, **kwargs)
   1449     auto_label = (bound.arguments.get(label_namer)
   1450                   or bound.kwargs.get(label_namer))

File /knight/mamba_aug23/envs/sep23_env/lib/python3.11/site-packages/matplotlib/axes/_axes.py:6465, in Axes.contourf(self, *args, **kwargs)
   6456 """
   6457 Plot filled contours.
   6458
   (...)
   6462 %(contour_doc)s
   6463 """
   6464 kwargs['filled'] = True
-> 6465 contours = mcontour.QuadContourSet(self, *args, **kwargs)
   6466 self._request_autoscale_view()
   6467 return contours

File /knight/mamba_aug23/envs/sep23_env/lib/python3.11/site-packages/matplotlib/contour.py:769, in ContourSet.__init__(self, ax, levels, filled, linewidths, linestyles, hatches, alpha, origin, extent, cmap, colors, norm, vmin, vmax, extend, antialiased, nchunk, locator, transform, negative_linestyles, *args, **kwargs)
    765 if self.negative_linestyles is None:
    766     self.negative_linestyles = \
    767         mpl.rcParams['contour.negative_linestyle']
--> 769 kwargs = self._process_args(*args, **kwargs)
    770 self._process_levels()
    772 self._extend_min = self.extend in ['min', 'both']

File /knight/mamba_aug23/envs/sep23_env/lib/python3.11/site-packages/matplotlib/contour.py:1411, in QuadContourSet._process_args(self, corner_mask, algorithm, *args, **kwargs)
   1408         corner_mask = mpl.rcParams['contour.corner_mask']
   1409 self._corner_mask = corner_mask
-> 1411 x, y, z = self._contour_args(args, kwargs)
   1413 contour_generator = contourpy.contour_generator(
   1414     x, y, z, name=self._algorithm, corner_mask=self._corner_mask,
   1415     line_type=contourpy.LineType.SeparateCode,
   1416     fill_type=contourpy.FillType.OuterCode,
   1417     chunk_size=self.nchunk)
   1419 t = self.get_transform()

File /knight/mamba_aug23/envs/sep23_env/lib/python3.11/site-packages/matplotlib/contour.py:1450, in QuadContourSet._contour_args(self, args, kwargs)
   1448 elif nargs <= 4:
   1449     x, y, z_orig, *args = args
-> 1450     x, y, z = self._check_xyz(x, y, z_orig, kwargs)
   1451 else:
   1452     raise _api.nargs_error(fn, takes="from 1 to 4", given=nargs)

File /knight/mamba_aug23/envs/sep23_env/lib/python3.11/site-packages/matplotlib/contour.py:1475, in QuadContourSet._check_xyz(self, x, y, z, kwargs)
   1472 z = ma.asarray(z)
   1474 if z.ndim != 2:
-> 1475     raise TypeError(f"Input z must be 2D, not {z.ndim}D")
   1476 if z.shape[0] < 2 or z.shape[1] < 2:
   1477     raise TypeError(f"Input z must be at least a (2, 2) shaped array, "
   1478                     f"but has shape {z.shape}")

TypeError: Input z must be 2D, not 3D
res = '110m'
dpi = 100
fig = plt.figure(figsize=(2048/dpi, 1024/dpi))
ax = plt.subplot(1,1,1,projection=projData, frameon=False)

ax.add_feature(cfeature.COASTLINE.with_scale(res), edgecolor='brown', linewidth=2.5)
ax.add_feature(cfeature.BORDERS.with_scale(res), edgecolor='brown', linewidth=2.5)
ax.add_feature(cfeature.STATES.with_scale(res), edgecolor='brown')

# Temperature (T) contour fills

# Note we don't need the transform argument since the map/data projections are the same, but we'll leave it in
CF = ax.contourf(lons,lats,T.isel(time=0),levels=tLevels,cmap=plt.get_cmap('coolwarm'), extend='both', transform=projData)

# Height (Z) contour lines
CL = ax.contour(lons,lats,Z.isel(time=0),zLevels,linewidths=1.25,colors='yellow', transform=projData)
ax.clabel(CL, inline_spacing=0.2, fontsize=8, fmt='%.0f')
fig.tight_layout(pad=.01)
lonW, lonE, latS, latN = -130, -60, 20, 55
lonRange = np.arange(lonW, lonE + 0.1, 0.25)
latRange = np.arange(latS, latN + 0.1, 0.25)
ZSub2 = Z.sel(latitude = latRange, longitude = lonRange)
TSub2 = T.sel(latitude = latRange, longitude = lonRange)
---------------------------------------------------------------------------
KeyError                                  Traceback (most recent call last)
Cell In[18], line 1
----> 1 ZSub2 = Z.sel(latitude = latRange, longitude = lonRange)
      2 TSub2 = T.sel(latitude = latRange, longitude = lonRange)

File /knight/mamba_aug23/envs/sep23_env/lib/python3.11/site-packages/xarray/core/dataarray.py:1582, in DataArray.sel(self, indexers, method, tolerance, drop, **indexers_kwargs)
   1472 def sel(
   1473     self: T_DataArray,
   1474     indexers: Mapping[Any, Any] | None = None,
   (...)
   1478     **indexers_kwargs: Any,
   1479 ) -> T_DataArray:
   1480     """Return a new DataArray whose data is given by selecting index
   1481     labels along the specified dimension(s).
   1482
   (...)
   1580     Dimensions without coordinates: points
   1581     """
-> 1582     ds = self._to_temp_dataset().sel(
   1583         indexers=indexers,
   1584         drop=drop,
   1585         method=method,
   1586         tolerance=tolerance,
   1587         **indexers_kwargs,
   1588     )
   1589     return self._from_temp_dataset(ds)

File /knight/mamba_aug23/envs/sep23_env/lib/python3.11/site-packages/xarray/core/dataset.py:3020, in Dataset.sel(self, indexers, method, tolerance, drop, **indexers_kwargs)
   2959 """Returns a new dataset with each array indexed by tick labels
   2960 along the specified dimension(s).
   2961
   (...)
   3017 DataArray.sel
   3018 """
   3019 indexers = either_dict_or_kwargs(indexers, indexers_kwargs, "sel")
-> 3020 query_results = map_index_queries(
   3021     self, indexers=indexers, method=method, tolerance=tolerance
   3022 )
   3024 if drop:
   3025     no_scalar_variables = {}

File /knight/mamba_aug23/envs/sep23_env/lib/python3.11/site-packages/xarray/core/indexing.py:190, in map_index_queries(obj, indexers, method, tolerance, **indexers_kwargs)
    188         results.append(IndexSelResult(labels))
    189     else:
--> 190         results.append(index.sel(labels, **options))
    192 merged = merge_sel_results(results)
    194 # drop dimension coordinates found in dimension indexers
    195 # (also drop multi-index if any)
    196 # (.sel() already ensures alignment)

File /knight/mamba_aug23/envs/sep23_env/lib/python3.11/site-packages/xarray/core/indexes.py:781, in PandasIndex.sel(self, labels, method, tolerance)
    779     indexer = get_indexer_nd(self.index, label_array, method, tolerance)
    780     if np.any(indexer < 0):
--> 781         raise KeyError(f"not all values found in index {coord_name!r}")
    783 # attach dimension names and/or coordinates to positional indexer
    784 if isinstance(label, Variable):

KeyError: "not all values found in index 'longitude'"
projMap = ccrs.
  Cell In[19], line 1
    projMap = ccrs.
                   ^
SyntaxError: invalid syntax
res = '50m'
dpi = 100
fig = plt.figure(figsize=(2048/dpi, 1024/dpi))
ax = plt.subplot(1,1,1,projection=, frameon=False)

ax.add_feature(cfeature.COASTLINE.with_scale(res), edgecolor='brown', linewidth=2.5)
ax.add_feature(cfeature.BORDERS.with_scale(res), edgecolor='brown', linewidth=2.5)
ax.add_feature(cfeature.STATES.with_scale(res), edgecolor='brown')

# Temperature (T) contour fills

# Note we don't need the transform argument since the map/data projections are the same, but we'll leave it in
CF = ax.contourf(lons,lats,T.isel(time=0),levels=tLevels,cmap=plt.get_cmap('coolwarm'), extend='both', transform=projData)

# Height (Z) contour lines
CL = ax.contour(lons,lats,Z.isel(time=0),zLevels,linewidths=1.25,colors='yellow', transform=projData)
ax.clabel(CL, inline_spacing=0.2, fontsize=8, fmt='%.0f')
fig.tight_layout(pad=.01)
  Cell In[20], line 4
    ax = plt.subplot(1,1,1,projection=, frameon=False)
                                      ^
SyntaxError: invalid syntax