Problem 4:
Contents
Problem 4:
ATM350 Homework 3, Spring 2023
The website, xmACIS2, is a great archive for text-based weather data, climatology, records, etc.  For this problem, you will be retrieving data relevant to your final project case study.
First, create a problem4 directory and cd into it.
Then, complete the following tasks:
Part a:
Copy the notebook, /spare11/atm350/common/hwdata/hw3/Xmacis.ipynb into this directory.
Part b:
Modify the notebook as guided by the four Tasks. Choose a site and a time period (at least one week, no greater than one month) to retrieve data relevant for your case study.
Part c:
Run the notebook to its completion.
Part d:
Use Pandas and Matplotlib to create the following time-series plots:
    1. Max / min temps (deg. C)
    2. Daily precip (units of mm) (or, if relevant for your case, daily snowfall)
Imports
import pandas as pd
import numpy as np
import matplotlib.pyplot as plt
csvFile = 'climo_alb_930310_930316.csv'
Read the file into a Pandas Dataframe
df = pd.read_csv(csvFile, dtype='string')
Examine the Dataframe
df
| DATE | MAX | MIN | AVG | DEP | HDD | CDD | PCP | SNW | DPT | |
|---|---|---|---|---|---|---|---|---|---|---|
| 0 | 1993-03-10 | 38 | 25 | 31.5 | -2.1 | 33 | 0 | 0.16 | 3.1 | 2 |
| 1 | 1993-03-11 | 33 | 25 | 29.0 | -4.9 | 36 | 0 | 0.08 | 1.4 | 6 |
| 2 | 1993-03-12 | 26 | 10 | 18.0 | -16.2 | 47 | 0 | T | 0.2 | 5 |
| 3 | 1993-03-13 | 21 | 16 | 18.5 | -16.0 | 46 | 0 | 1.59 | 22.0 | M |
| 4 | 1993-03-14 | 20 | 11 | 15.5 | -19.4 | 49 | 0 | 0.24 | 4.6 | 28 |
| 5 | 1993-03-15 | 27 | 1 | 14.0 | -21.2 | 51 | 0 | 0.00 | 0.0 | 27 |
| 6 | 1993-03-16 | 43 | 17 | 30.0 | -5.6 | 35 | 0 | 0.00 | 0.0 | 27 |
Set objects for the max/min temperatures, and express as floating point values.
maxT=df['MAX'].astype("float32")
minT=df['MIN'].astype("float32")
Convert to Celsius
maxT = (maxT - 32) / 1.8
minT = (minT - 32) / 1.8
Set object for the date, and express as datetime values.
date = df['DATE']
date = pd.to_datetime(date, format="%Y-%m-%d")
Read in the daily precip (or, if relevant, snowfall) total; handle Trace values; express as floating point values; convert to mm.
df.loc[df['SNW'] =='T', ['SNW']] = '0.0'
df['SNW'] = df['SNW'].astype("float32") * 25.4
snow = df['SNW']
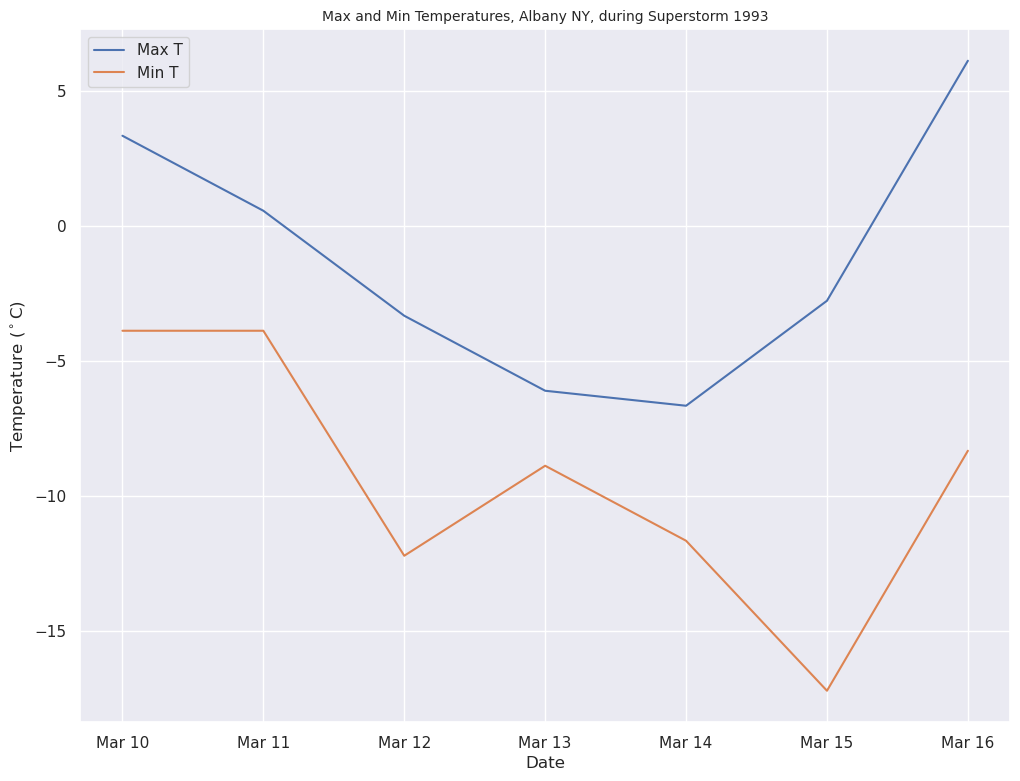
Create a figure of daily max/min temps for the period of interest
from matplotlib.dates import DateFormatter, AutoDateLocator,HourLocator,DayLocator,MonthLocator
import seaborn as sns
sns.set()
fig = plt.figure(figsize=(12, 9))
ax = fig.add_subplot() # Default is one axes per figure

ax.plot(date, maxT, label='Max T')
ax.plot(date, minT, label='Min T')

ax.xaxis.set_major_locator(DayLocator(interval=1))
dateFmt = DateFormatter('%b %d')
ax.xaxis.set_major_formatter(dateFmt)
ax.set_xlabel('Date')
ax.set_ylabel('Temperature ($^\circ$C)')
ax.legend(loc='best')
ax.set_title('Max and Min Temperatures, Albany NY, during Superstorm 1993',fontsize=10);
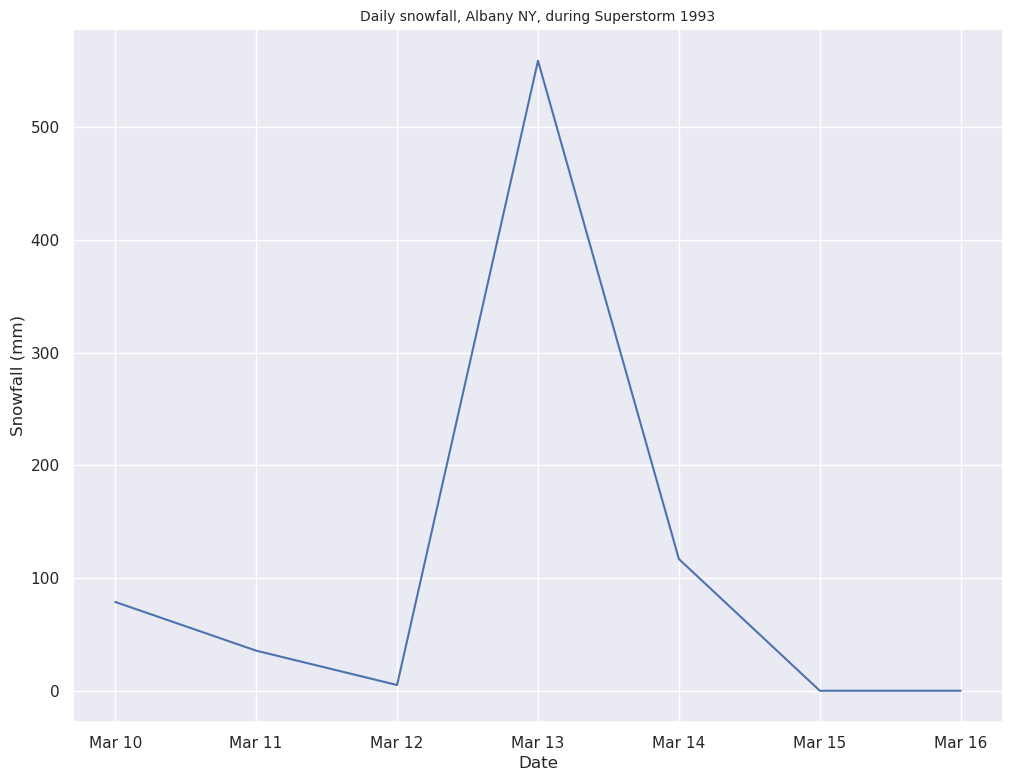
Create a figure of daily precip (or snowfall) for the period of interest
fig = plt.figure(figsize=(12, 9))
ax = fig.add_subplot() # Default is one axes per figure

ax.plot(date, snow)

ax.xaxis.set_major_locator(DayLocator(interval=1))
dateFmt = DateFormatter('%b %d')
ax.xaxis.set_major_formatter(dateFmt)
ax.set_xlabel('Date')
ax.set_ylabel('Snowfall (mm)')
ax.set_title('Daily snowfall, Albany NY, during Superstorm 1993',fontsize=10);