Pandas: Working with a JSON file
Contents
Pandas: Working with a JSON file
Overview
In this notebook, we will create a Pandas Dataframe from a remotely-served JSON file. This particular file contains forecasted solar wind parameters from NOAA’s Space Weather Prediction Center.
Read in a JSON file
Reformat the
DataframeVisualize the dataset
Imports
import pandas as pd
Read in a JSON file
NOAA’s SWPC has a variety of forecast output in JSON format. Here, we create a Dataframe Pandas’ read_json method from the current 1-day plasma forecast.
df = pd.read_json("https://services.swpc.noaa.gov/products/solar-wind/plasma-1-day.json")
Examine the Dataframe
df
| 0 | 1 | 2 | 3 | |
|---|---|---|---|---|
| 0 | time_tag | density | speed | temperature |
| 1 | 2023-11-19 22:11:00.000 | 6.45 | 322.4 | 10579 |
| 2 | 2023-11-19 22:12:00.000 | 6.45 | 322.2 | 10691 |
| 3 | 2023-11-19 22:13:00.000 | 6.29 | 322.1 | 10405 |
| 4 | 2023-11-19 22:14:00.000 | 6.30 | 322.2 | 10576 |
| ... | ... | ... | ... | ... |
| 1433 | 2023-11-20 22:03:00.000 | 13.84 | 303.8 | 35283 |
| 1434 | 2023-11-20 22:04:00.000 | 14.38 | 304.1 | 35331 |
| 1435 | 2023-11-20 22:05:00.000 | 14.25 | 305.2 | 34041 |
| 1436 | 2023-11-20 22:06:00.000 | 14.44 | 312.1 | 31645 |
| 1437 | 2023-11-20 22:07:00.000 | 14.24 | 305.0 | 34145 |
1438 rows × 4 columns
Reformat the Dataframe
Notice that the column headers look to be in the Dataframe’s first row. Let’s modify it.
# Set the columns to be the values of the first row. Then drop that first row.
df = df.rename(columns=df.iloc[0]).drop(df.index[0])
Examine the reformatted Dataframe
df
| time_tag | density | speed | temperature | |
|---|---|---|---|---|
| 1 | 2023-11-19 22:11:00.000 | 6.45 | 322.4 | 10579 |
| 2 | 2023-11-19 22:12:00.000 | 6.45 | 322.2 | 10691 |
| 3 | 2023-11-19 22:13:00.000 | 6.29 | 322.1 | 10405 |
| 4 | 2023-11-19 22:14:00.000 | 6.30 | 322.2 | 10576 |
| 5 | 2023-11-19 22:15:00.000 | 6.52 | 322.2 | 10775 |
| ... | ... | ... | ... | ... |
| 1433 | 2023-11-20 22:03:00.000 | 13.84 | 303.8 | 35283 |
| 1434 | 2023-11-20 22:04:00.000 | 14.38 | 304.1 | 35331 |
| 1435 | 2023-11-20 22:05:00.000 | 14.25 | 305.2 | 34041 |
| 1436 | 2023-11-20 22:06:00.000 | 14.44 | 312.1 | 31645 |
| 1437 | 2023-11-20 22:07:00.000 | 14.24 | 305.0 | 34145 |
1437 rows × 4 columns
Set the Dataframe’s index to the timestamped column.
df.index
RangeIndex(start=1, stop=1438, step=1)
Currently, the Dataframe has a default index (i.e., a range of integers). For time series data (i.e., time is the independent variable), it is good practice to use a time-based column as the index.
df = df.set_index('time_tag')
df
| density | speed | temperature | |
|---|---|---|---|
| time_tag | |||
| 2023-11-19 22:11:00.000 | 6.45 | 322.4 | 10579 |
| 2023-11-19 22:12:00.000 | 6.45 | 322.2 | 10691 |
| 2023-11-19 22:13:00.000 | 6.29 | 322.1 | 10405 |
| 2023-11-19 22:14:00.000 | 6.30 | 322.2 | 10576 |
| 2023-11-19 22:15:00.000 | 6.52 | 322.2 | 10775 |
| ... | ... | ... | ... |
| 2023-11-20 22:03:00.000 | 13.84 | 303.8 | 35283 |
| 2023-11-20 22:04:00.000 | 14.38 | 304.1 | 35331 |
| 2023-11-20 22:05:00.000 | 14.25 | 305.2 | 34041 |
| 2023-11-20 22:06:00.000 | 14.44 | 312.1 | 31645 |
| 2023-11-20 22:07:00.000 | 14.24 | 305.0 | 34145 |
1437 rows × 3 columns
Check and edit the dtypes of the independent and dependent variables
In this case, the Dataframe’s index corresponds to the independent variable, and the columns correspond to the dependent variables.
df.index
Index(['2023-11-19 22:11:00.000', '2023-11-19 22:12:00.000',
       '2023-11-19 22:13:00.000', '2023-11-19 22:14:00.000',
       '2023-11-19 22:15:00.000', '2023-11-19 22:16:00.000',
       '2023-11-19 22:17:00.000', '2023-11-19 22:18:00.000',
       '2023-11-19 22:19:00.000', '2023-11-19 22:20:00.000',
       ...
       '2023-11-20 21:58:00.000', '2023-11-20 21:59:00.000',
       '2023-11-20 22:00:00.000', '2023-11-20 22:01:00.000',
       '2023-11-20 22:02:00.000', '2023-11-20 22:03:00.000',
       '2023-11-20 22:04:00.000', '2023-11-20 22:05:00.000',
       '2023-11-20 22:06:00.000', '2023-11-20 22:07:00.000'],
      dtype='object', name='time_tag', length=1437)
df.dtypes
density        object
speed          object
temperature    object
dtype: object
They are all objects … and as a result won’t be amenable to typical time-series visualization methods. Change them to more appropriate dtypes … float32 for the dependent variables, and datetime64 for the time-based one.
for col in df.columns:
    df[col] = df[col].astype("float32")
df.index = pd.to_datetime(df.index)
df.index = pd.to_datetime(df.index)
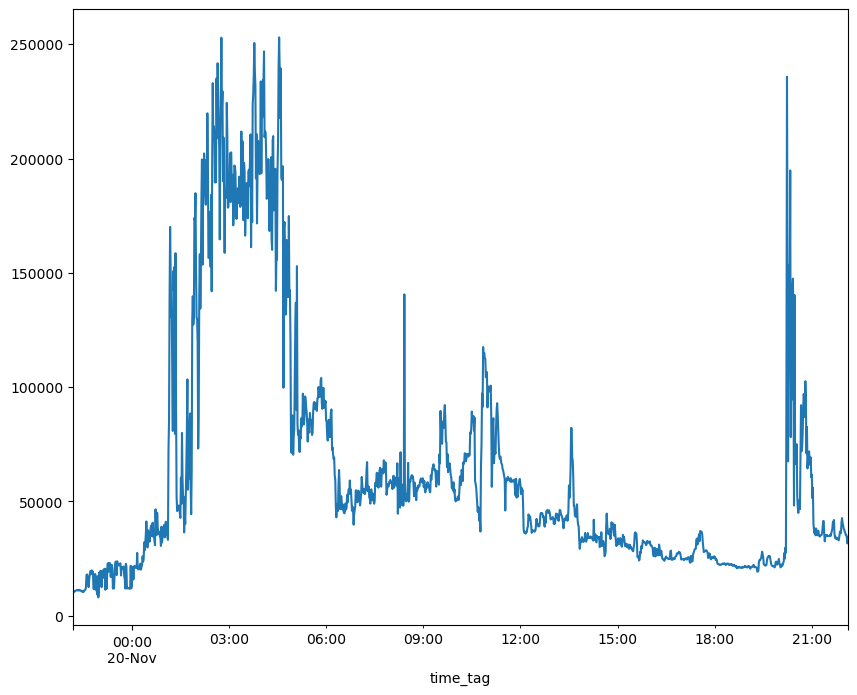
Visualize the dataset
df.temperature.plot(figsize=(10, 8));
Summary
Pandas has several reader functions for differently-formatted tabular datasets. In this notebook, we created a Dataframe via Pandas read_json function, and then manipulated the Dataframe to allow for a useful time-series visualization.
Note:
There is no strict format specification for JSON files. The strategy we followed to create and reformat the Dataframe in this notebook will likely need to change for other JSON-formatted datasets you may encounter!
What’s next?
Future Project Pythia Foundations Pandas notebooks will explore additional file format-specific reader methods.