Map Discussion Links
A User's Guide to ECMWF Forecast Products
Ensemble and Deterministic Forecasting
Forecast Verification
Comet Modules Web Pages
Dual-Polarization Radar Topics
Severe Weather Links
Items of Interest (Spring 2018)
Items of Interest (Spring 2017)
Items of Interest (Spring 2016)
Items of Interest (Spring 2015)
Items of Interest (Spring 2014)
Items of Interest (Spring 2013)
Items of Interest (Spring 2012)
Diagnostics of Archived and Real-time Analyses and Model Forecast Products
Tom Galarneau's Real-Time Diagnostic Analyses and Model Forecast Pages:
----UCAR archive
----Real-time GFS and MPAS Analysis and Model Forecast Diagnostics page
--------MPAS = Model for Prediction Across Scales
----Real-time Analyses and Forecasts of the QG Diagnostic Equations
Real-time and Archived GFS Products:
----Tomer Burg's GFS and NAM Maps
----Alicia Bentley's Real-time GFS Maps
----Kyle Griffin's Real-time Global Maps
----Heather Archambault's Archived GFS Analyses and Diagnostic Products Page
----Matt Onderlinde (NHC) weather analysis, model assortment, and diagnostics page
Map Discussion Links
"Outside the envelope" GEFS graphics (NCEP)
NWS Current and Archived Station Data (note to user: replace wfo=xxx to desired NWS office)
Weather and Climate Links (Courtesy of Tom Galarneau)
NCAR RAL Real-Time Weather Data
NOAA View Data Exploration Tool
SPC Surface and Upper Air Maps
University of Wyoming Surface and Upper Air Analysis and Archive
University of Wyoming Sounding Page
Experimental NCAR 10-member 3-km WRF model
European satellite data and METAR/SYNOP archive for the globe
Isentropic Analyses (Courtesy of Alan Srock)
Model guidance with SVR WX parameters from SLU
GIBBS Satellite Data
Ocean Prediction Center
CPC Global Temperature Time Series
CPC Global Precipitation Time Series
CPC's Gridded Seasonal Verifications
CIRA Blended Total Precipitable Water (5-d loop)
CIRA Blended Total Precipitable Water (30-d loop)
Remote Sensing Systems Satellite Data
Remote Sensing Systems Scatterometer Data
SSMI/AMSRE-derived Total Precipitable Water--Global
DEAS Surface and Upper-air Observations
PV on 315-K surface (University of Reading)
Heather Archambault's GFS Analyses
Alicia Bentley's real-time isentropic charts
OU's real-time isentropic charts
COD's real-time isentropic charts
Tom Galarneau's QG diagnostics page
Tom Galarneau's Real-time GFS and MPAS Analysis and Model Forecast Diagnostics page
----MPAS = Model for Prediction Across Scales
Hazard Mapping System Fire and Smoke Product
CIMSS Satellite Archive (BETA)
CIMSS WFO-scale Satellite Imagery (Eastern US)
CIMSS WFO-scale Satellite Imagery (Western US)
Satellite Observations in Science Education Global Imagery
Satellite Composite Images (SSEC)
WPC's Archived Surface Maps (Dan Peterson)
NCEP Model Analyses and Guidance
Penn State e-Wall: The Electronic Map Wall
Canadian Met Center Operational Analyses
NASA Worldview (powered by LANCE!)
U.S. Air Quality (The Smog Blog)
GOES-R Proving Ground Test-Bed
NOAA-NESDIS Operational Significant Event Imagery Archive
Cliff Mass Weather Blog (University of Washington)
Earth: A Visualization of Global Weather Conditions
Iowa State Archived Data (including GEMPAK) and Plots
NOAA/NCEI Analysis and Forecast Archive
U.S. City Climate Comparison Graph Maker
NOAA NCEI Local Climate Data Publications
NWS AHPS Precipitation Analysis
Oklahoma University FLASH (Flooded Locations and Simulated Hodographs Project)
National Mosaic and Multi-sensor QPE
University of Wisonsin SSEC Sea Surface Temperature
Naval Research Laboratory Satellite Products
Tropical Tidbits Numerical Model Page (Levi Cowan)
A User Guide to ECMWF Forecast Products:
ECMWF SEAS5 User Guide (PDF)
"Outside the envelope" GEFS graphics (NCEP)
The ECMWF Ensemble Prediction System (PDF) Figures from "The ECMWF Ensemble Prediction System" (PPT) THORPEX/TIGGE Early Warning Products for Extreme Weather Events Ensemble-based Occurrence Probability of Severe Weather Events Ensemble-based Warning for Severe Weather Events WMO Guidelines for Ensemble Prediction Systems Verification and Reliability of the TIGGE Multi-Center Grand Ensemble (PPT) Tsonevsky, I., (2016): ECMWF: Forecasting Extremes February 2016 Ensemble forecast and archive viewer (Rich Grumm)
NCEP-WPC winter probability products information
ECMWF Extreme Forecast Index (EFI)
----NOAA/ESRL/PSD GEFS Reforecast Version 2
----NOAA/ESRL/PSD GEFS Reforecast Version 2, Precipitation Forecast Products
Bill Bua's COMET ensemble module
Trevor Alcott’s Ensemble Situational Awareness Table
----Trevor Alcott’s Ensemble Situational Awareness Table (NCEP Production Suite Review - Dec 2013)
SUNY Stony Brook Ensemble Sensitivity Analysis Home Page
----How to use the SUNY-SB ensemble sensitivity analysis page
----Tutorial on how to interpret SUNY-SB ensemble sensitivity analysis products
----Introduction to Ensemble Sensitivity (.pdf)
A summary: NCAR Climate Data Guide
The gory details EOFs (Monahan et al. 2009)
A brief summary for the mathematically inclined
Original Ed Lorenz paper on EOFs
EOF procedures with examples (source: D. Straus)
How to construct an EOF analysis
COMET module on Probability Density Functions
SPC Ensemble Products
SREF Plumes (affectionately, SREFFY-Plumes)
Storm-Scale Ensemble of Opportunity
NCEP SREF ensemble products (click for old link) NCEP Spaghetti and other experimental products NCEP/EMC cyclogenesis tracking page PSU-NWS GEFS archive (bias-corrected) Ensemble Forecasting (Wikipedia) Mike Bodner's NCEP Experimental Standardized Anomaly Page Rich Grumm's ensemble forecast products Penn State e-Wall: Medium-Range Ensemble page GFS Model and Ensemble Forecasts & Archives (from PSU) NCEP model suite documentation Real-time GFS / NAM analysis performance metrics (click for background info) -----CoCoRaHS website
-----SPC Verification (Hitchens 2012)
-----SPC Verification Day 3 (Hitchens 2014)
-----QPF verification (Baxter et al. 2014)
-----Email chain in regards to the importance of radiosonde observations improving human warnings
-----Model Adjoint Sensitivity Impacts - Observing Systems Impact on Model Error Reduction (September 2012)
-----Email: Statistics on What Observations Matter to Severe Weather forecasting (Steve Weiss)
-----Critical Success Index (CSI) or Threat Score (TS), and Equitable Threat Score (ETS)
-----What is the Equatible Threat Scores
-----Forecast Evaluation and Skill Scores
-----ECMWF Anomaly Correlation Coefficient Definition
-----ECMWF Extreme Forecast Index (EFI) Definition and Example
-----Nov 2014 CFSv2 2-m temperature forecast and verification
-----2015 User Guide to ECMWF Forecast Products (web link) -----2015 User Guide to ECMWF Forecast Products (PDF) -----"Decisions, Decisions", Palmer and Richardson (2014) -----"Freezing Rain Prediction", Forbes et al. (2014) -----Laloyaux and Bengtsson (2015): Forty Years of Improving Global Forecast Skill
-----Magnusson et al. (2015): Predicting this Year’s European Heat Wave
-----Buizza et al. (2015): Living with the Butterfly Effect: A Seamless View of Predictability
-----Hewson (2014), Severe Weather Prediction at ECMWF -----Hewson (2016), Some Recent and Upcoming Developments at ECMWF -----Roebber (2009)
-----Taylor (2001): Summarizing multiple aspects of model performance in a single diagram
-----Taylor (2005): Taylor Diagram Primer
COMET Modules Home Discussion of dual-polarization basics (T. Schlatter, Weatherwise) Technical training on WSR-88D radar (NWS/WDTB) Technical training specific to WSR-88D dual-polarization radar products (NWS/WDTB) "Storm of the Month" webinars (NWS/WDTB) Status of WSR-88D dual-polarization upgrade NEXRAD Dual-Polarization User’s Guide (correlation coefficient and differential reflectivity) Experimental NCAR 10-member 3-km WRF model
(Lee et. al) ENSO and large-scale tornadic conditions in the US. Rich Thompson's (SPC) Tornado Forecasting Workshop Historic Northeast TC Rainfall Events 15 April 2011 Mesoscale Bands in Northern AL 27-28 April 2011 Severe Weather Outbreak 11-29 April 2011 Heavy Rains & Flooding 22 May 2011 Joplin, MO Tornado 1-3 March 2012 Severe Weather Outbreak U.S. Tornado Environment Browser (SPC) SPC Mesoscale Analysis Archive Lightning Wizard: North America (Specialized Severe Weather Maps) "Tornadogenesis: Our current understanding, forecasting considerations, and questions to guide future research" "What we know and don't know about tornado formation"
Markowski and Richardson (2014) Grams, J. S., R. L. Thompson, D. V. Snively, J. A. Prentice, G. M. Hodges and L. J. Reames, 2011: A Climatology and Comparison of Parameters for Significant
Tornado Events in the United States. Wea. Forecasting, 27, 106-123. Thompson, R. L., R. Edwards, and C. M. Mead, 2004: An update to the supercell composite and significant tornado parameters. Storm Prediction Center publications, P 8.1. Thompson, R. L., C. M. Mead, and R. Edwards, 2007: Effective Storm-Relative Helicity and Bulk Shear in Supercell Thunderstorm Environments. Wea. Forecasting, 22, 102-115. Allen, J. T., and M. K. Tippett, 2015: The characteristics of United States hail reports: 1955-2014. Electronic J. Severe Storms Meteor., 10, 1-31. Significant Tornado Parameter (STP) SPC objective ensemble verification Clark (2014): Severe Storm Forecast Verification (SPC Presentation)
Ensemble and Deterministic Forecasting:
Added Spring 2016
Added Spring 2014/2015
Added Spring 2013 and Earlier
UAlbany GEFS ensemble forecast maps page
Bill Bua's Ensemble Prediction Webcast
PSU-NWS eyewall collaborative website
Penn State e-Wall: SREF page
COMET Modules Web Pages:
http://www.meted.ucar.edu/nwp/pcu1/ensemble/
http://www.meted.ucar.edu/nwp/pcu2/ens_matrix/Dual-Polarization Radar Topics:
Severe Weather Links:
Markowski and Richardson (2009)
Grams et al. (2012)
Thompson et al. (2004)
Thompson et al. (2007)
Allen et al. (2015)
Items of Interest (Spring 2018):
Items of Interest (Spring 2017):
Northern Hemisphere PV clirculation from November 2017
--
Jim Steenburgh’s NH Dynamic Tropopause Loop
Items of Interest (Spring 2016):
"Snowzilla": 22-24 Jan 2016
Tom Galarneau's Maps:
--Traditional QG omega equation
--QGPV and RHS of QGPV tendency equationh
--QGPV
--Traditional QG height tendency equation
Alicia Bentley's Maps:
--Mid-Atlantic
Items of Interest (Spring 2015):
Evolution of a near-icing event in Atlanta: 25-26 Feb 2015
--BMX Sounding at 1200Z 25 Feb
--BMX Sounding at 1500Z 25 Feb
--BMX Sounding at 1800Z 25 Feb
--BMX Sounding at 2100Z 25 Feb
--FFC Sounding at 1400Z 25 Feb
--FFC Sounding at 1800Z 25 Feb
--FFC Sounding at 2100Z 25 Feb
--FFC Sounding at 0000Z 26 Feb
The Bruising Boston Blizzard (27 Jan 2015)
----Importance of probabilistic forecasting (Lee Grenci)
--------SREF-generated areal snowfall probabilities for the Northeast
----Russ Schumacher's 10%-90% snowfall forecast MAP post
--------10th Percentile snowfall forecast (courtesy of WPC)
--------90th Percentile snowfall forecast (courtesy of WPC)
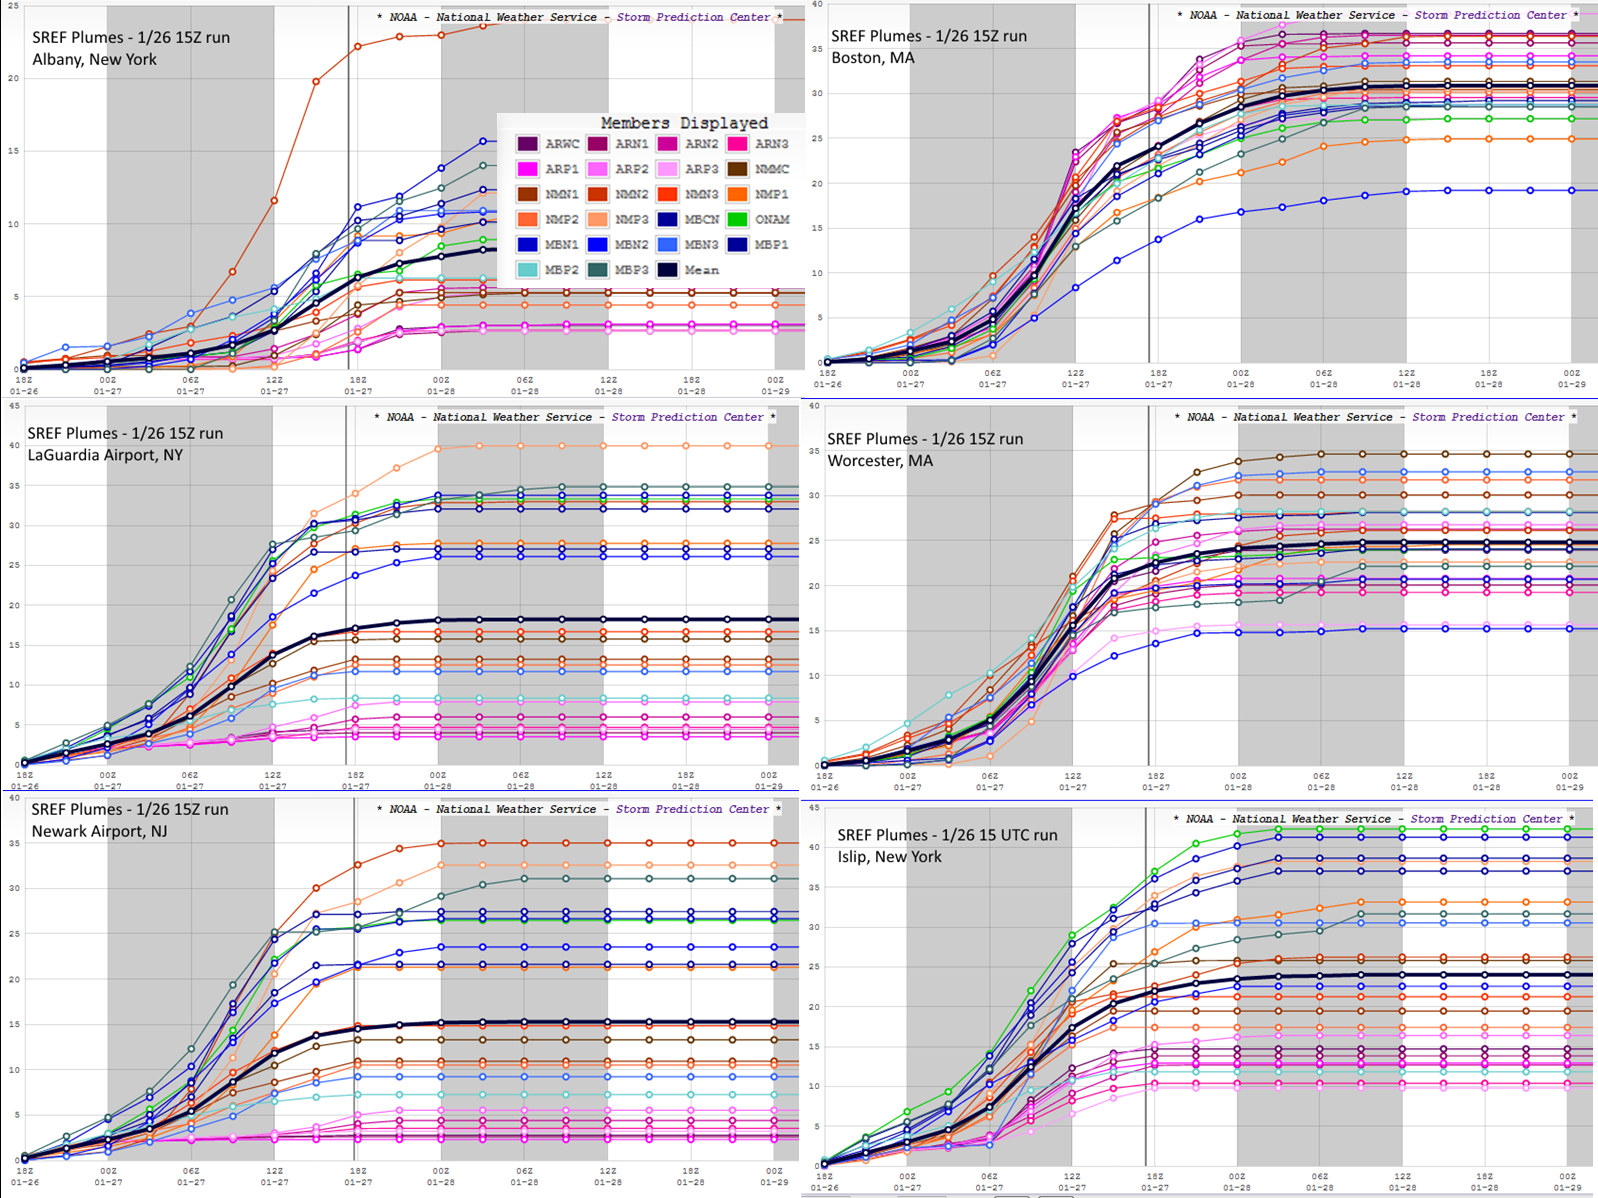
----SREF Plume forecast MAP post (Dan Lindsey and Cliff Mass)
--------SREF Plumes from 1500Z 26 Jan
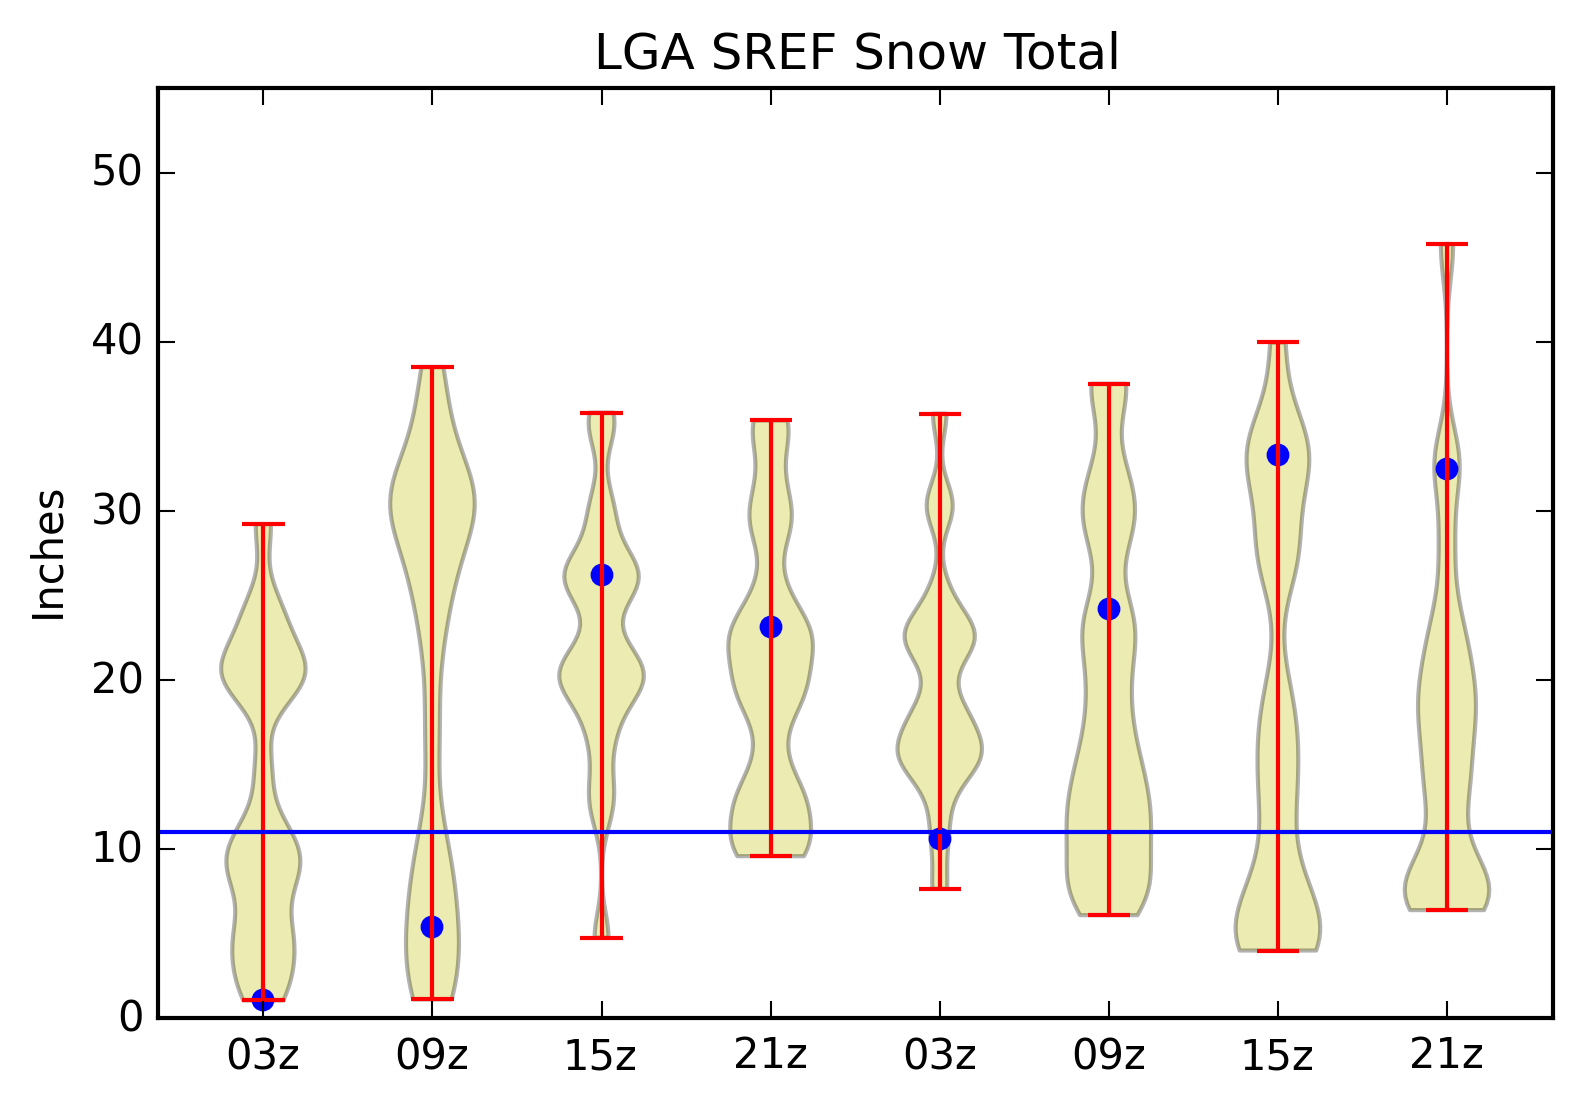
----Ensemble forecasting technique (Anton Seimon & Jimmy Correia)
--------Violin Plots of SREF Snowfall Forecast
--------SREF 3-Day Snowfall Forecast
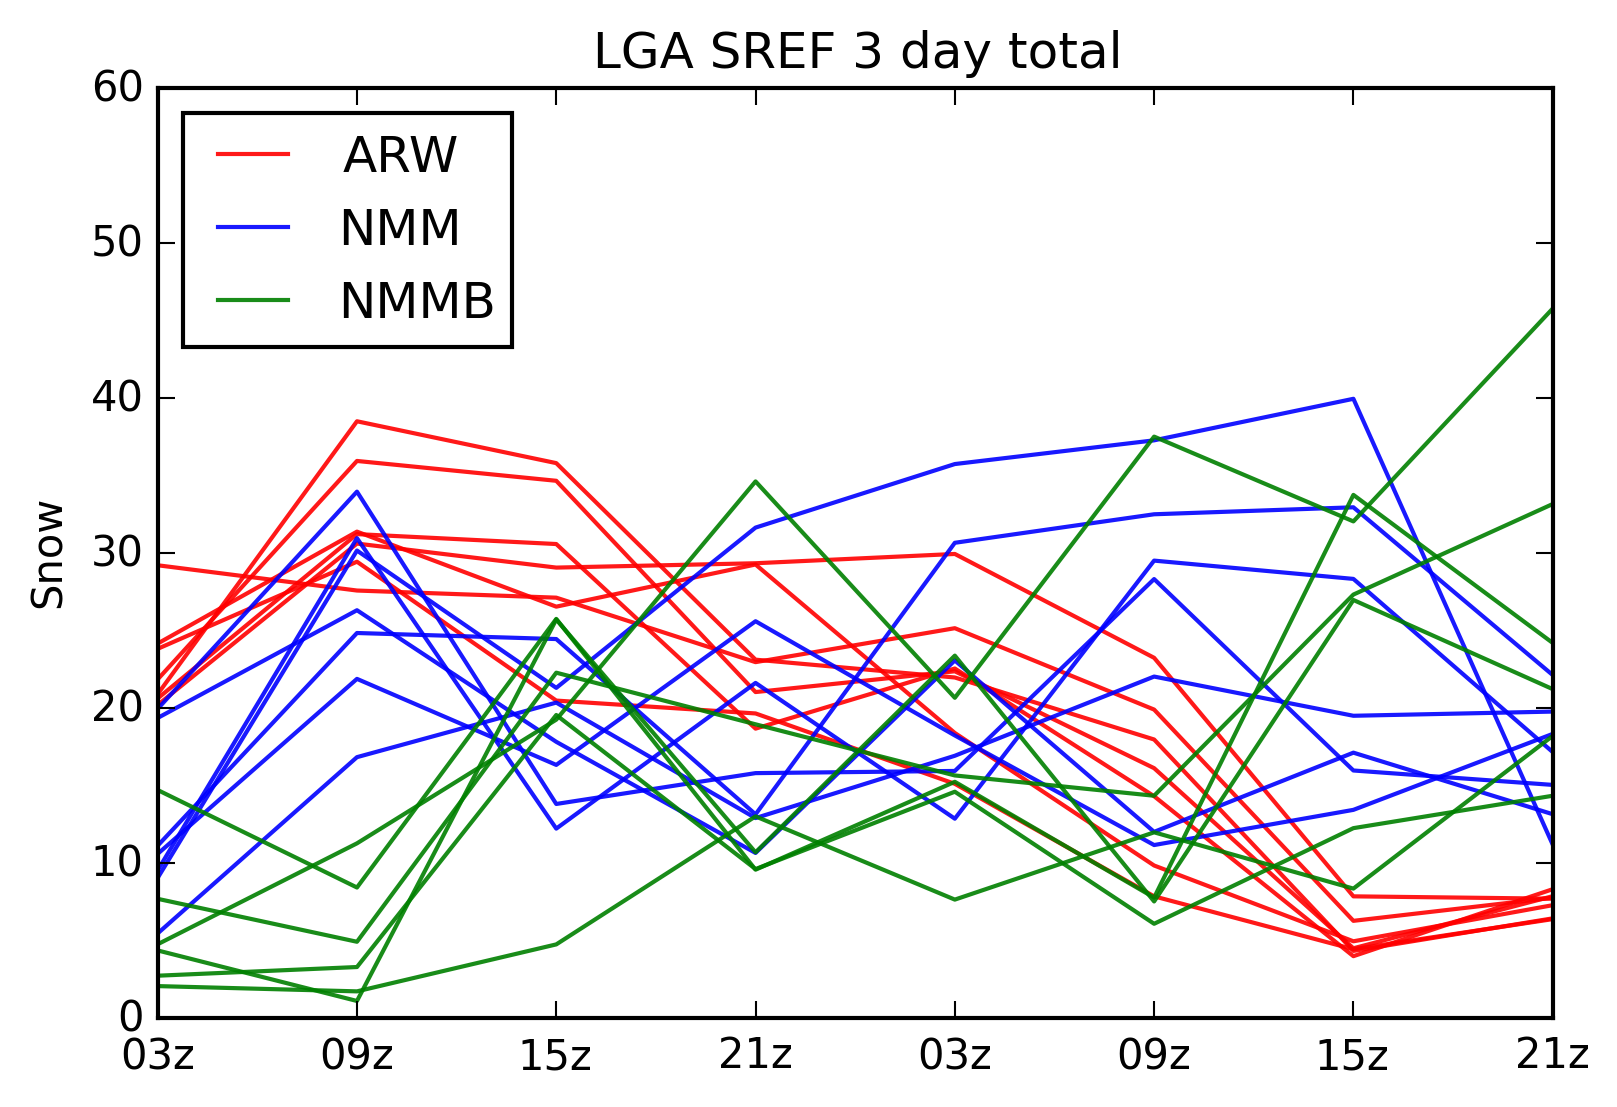
--------Tim Hewson's addendum to the above MAP post and description of his ECMWF Forecast & Reforecast Cumulative Probability Function plot
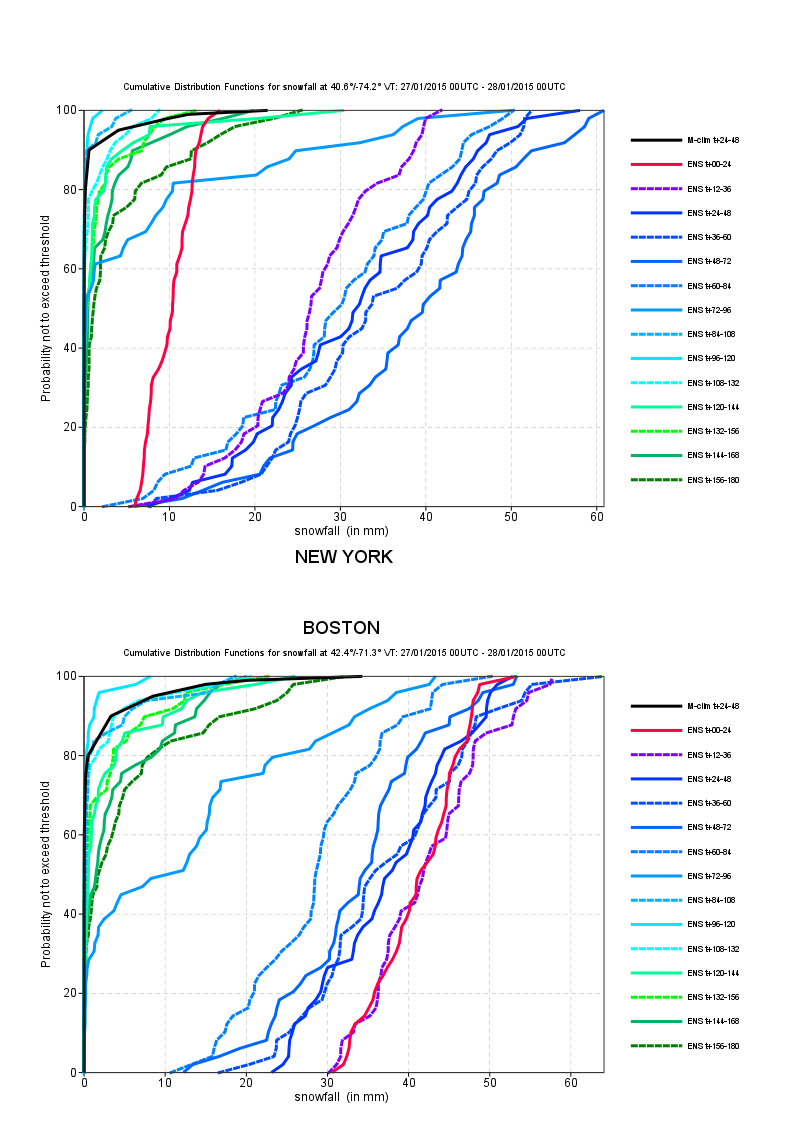
----Con-Way truck traffic on 27 Jan and 21 Jan
----HRRR frontogenesis analyses (Courtesy of Philippe Papin)
--------Radar loop (Courtesy of Philippe Papin)
--------Satellite loop (Courtesy of Philippe Papin)
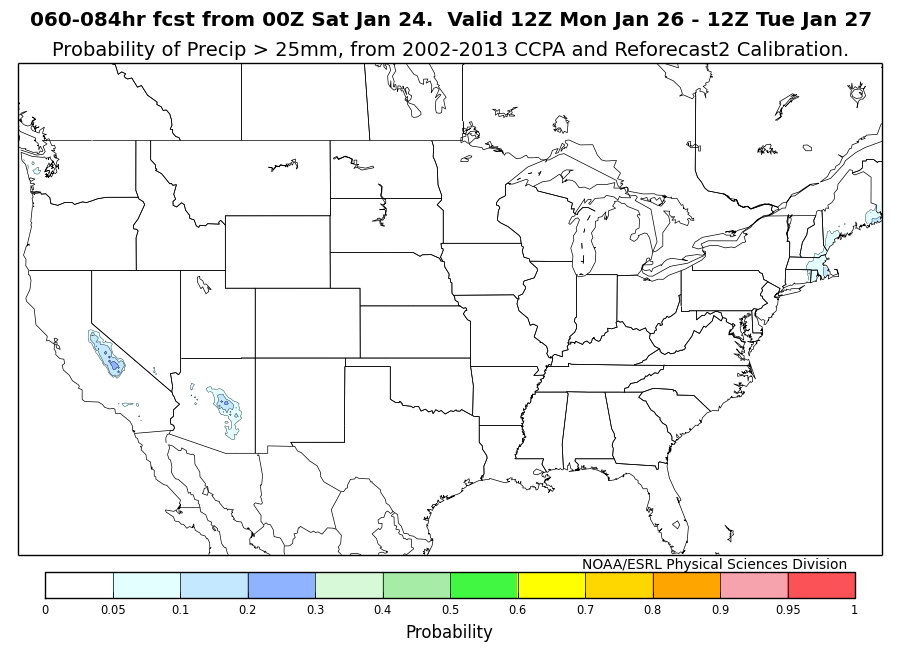
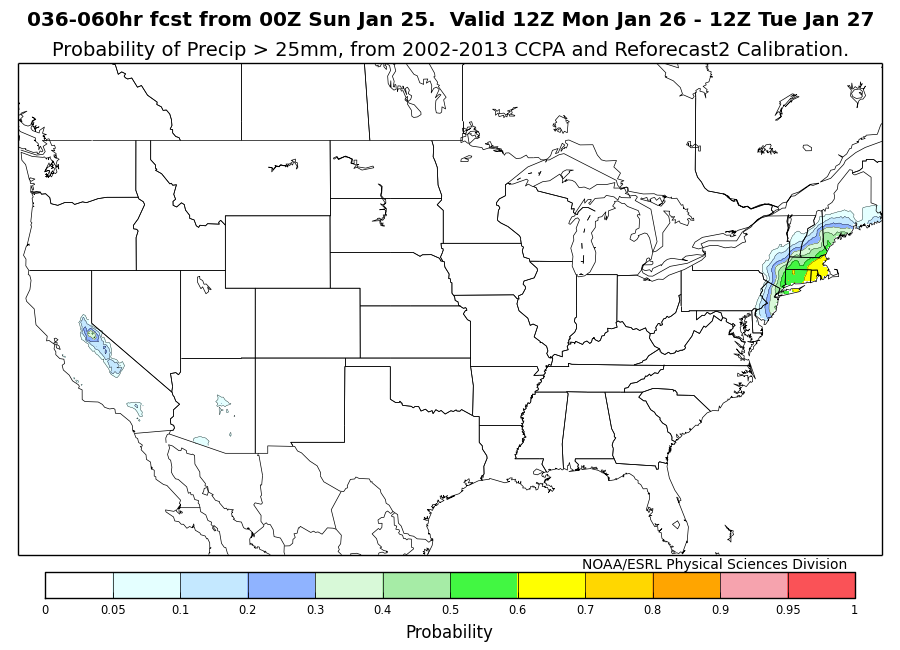
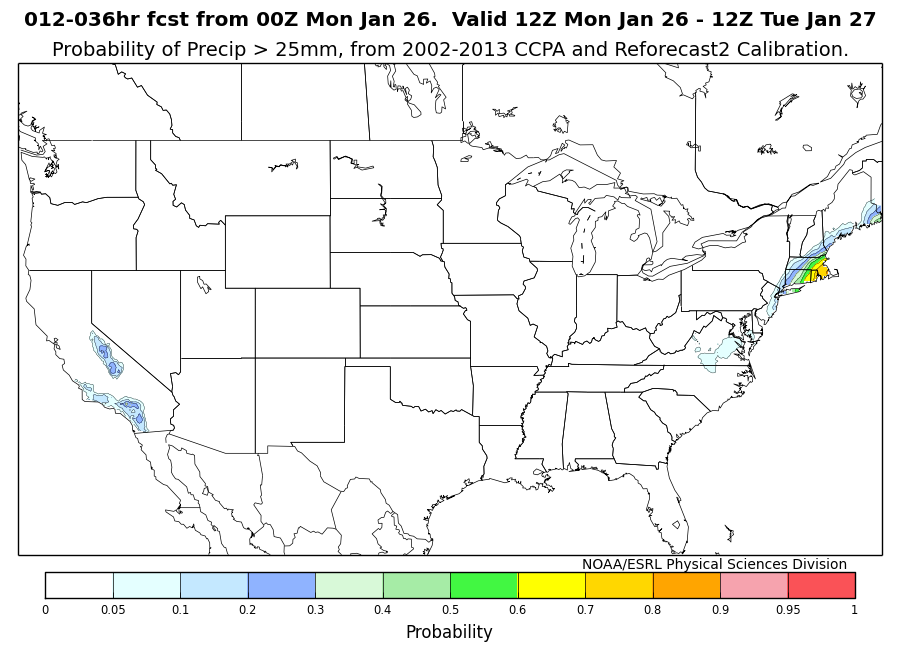
----GEFS Climatologically Calibrated Precipitation Analysis (CCPA) probabilities for 060-084hr forecast, 036-060hr forecast , and 012-036hr forecast.
----GEFS Ensemble Mean QPF vs. M-Climate for 120hr forecast, 96hr forecast , 72hr forecast , and 48hr forecast
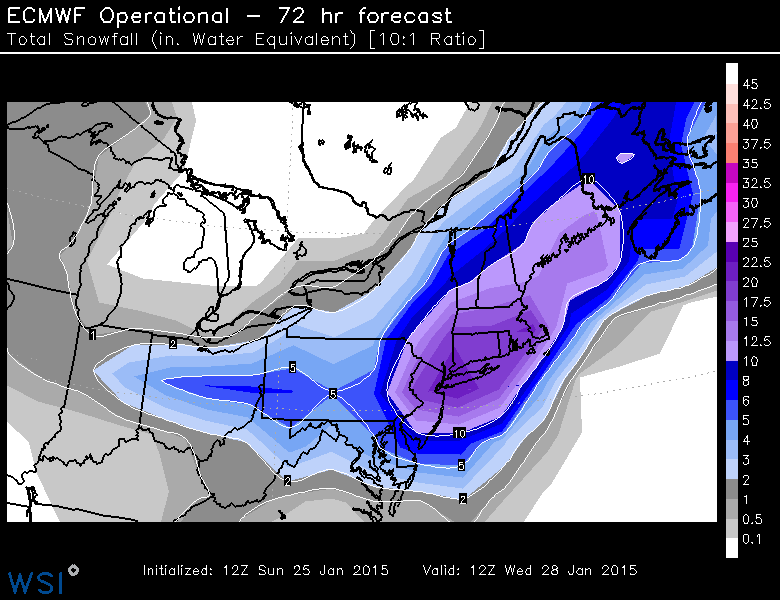
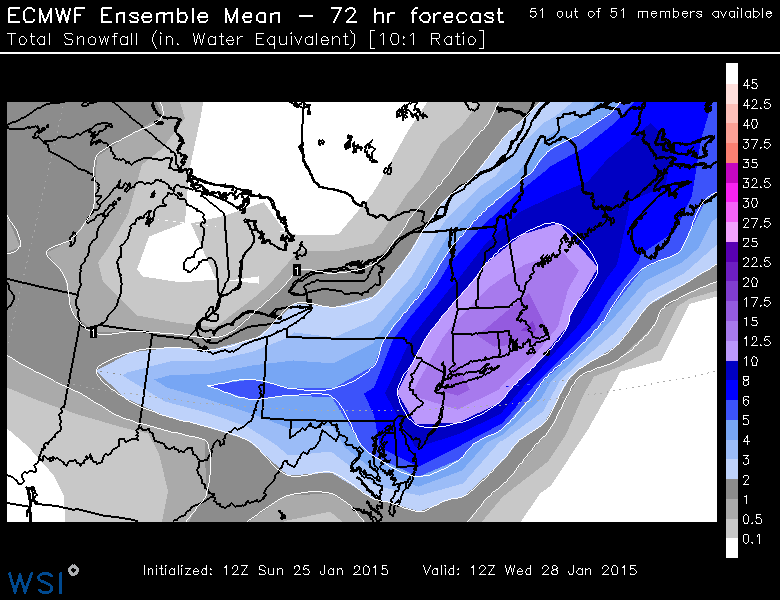
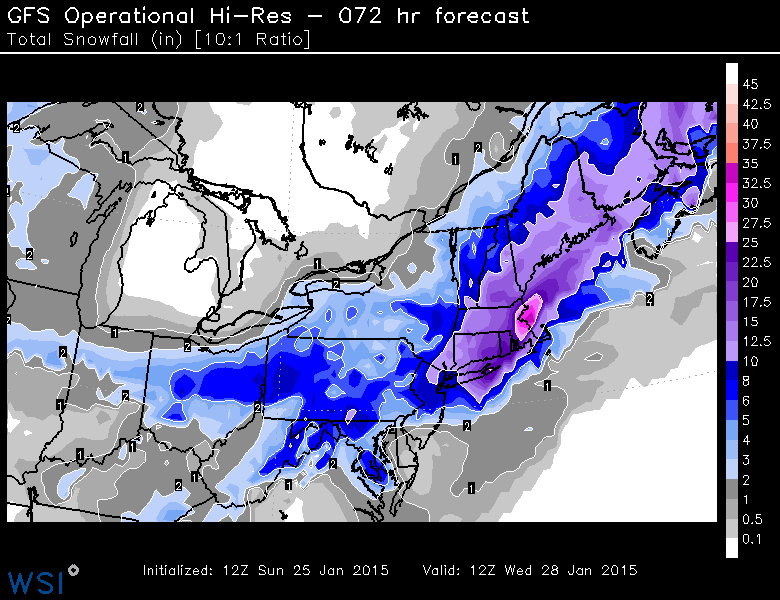
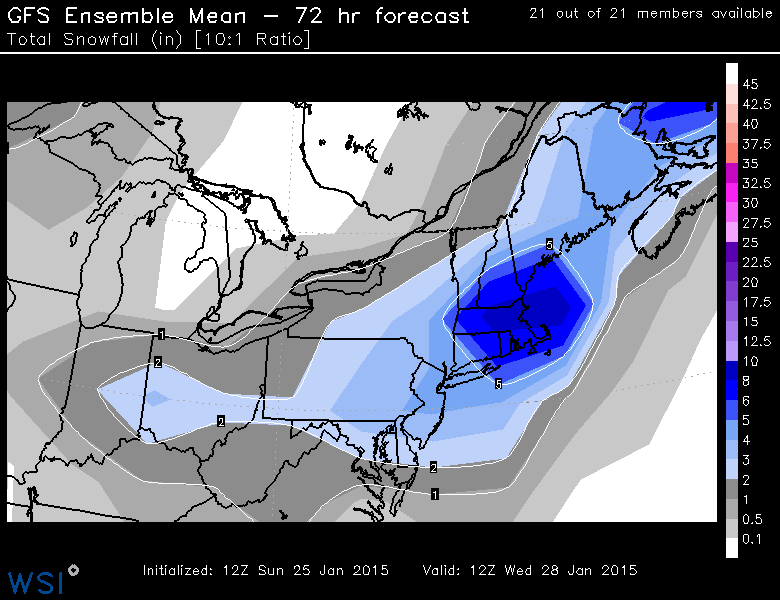
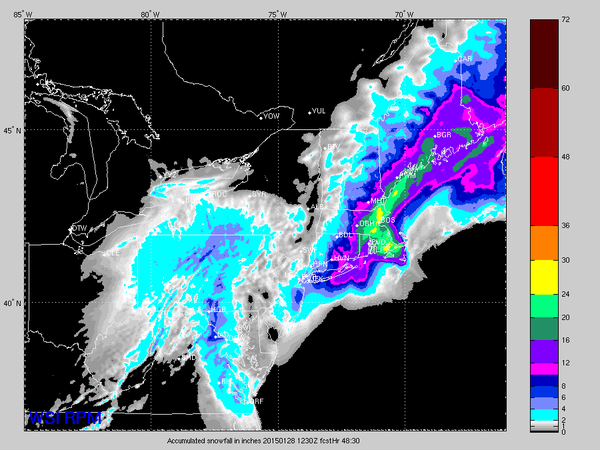
----72-hour Snowfall Accumulation forecasts (Courtesy of Michael Ventrice) from the ECMWF Deterministic Run, the ECMWF ensemble mean , the GFS Deterministic Run , the GFS Ensemble Mean , and WSI's RPM model.
----Greg Carbin's historical METAR analysis on MAP
----D(prog)/D(Time) of QPF from GFS, NAM , SREF , SREF fill.
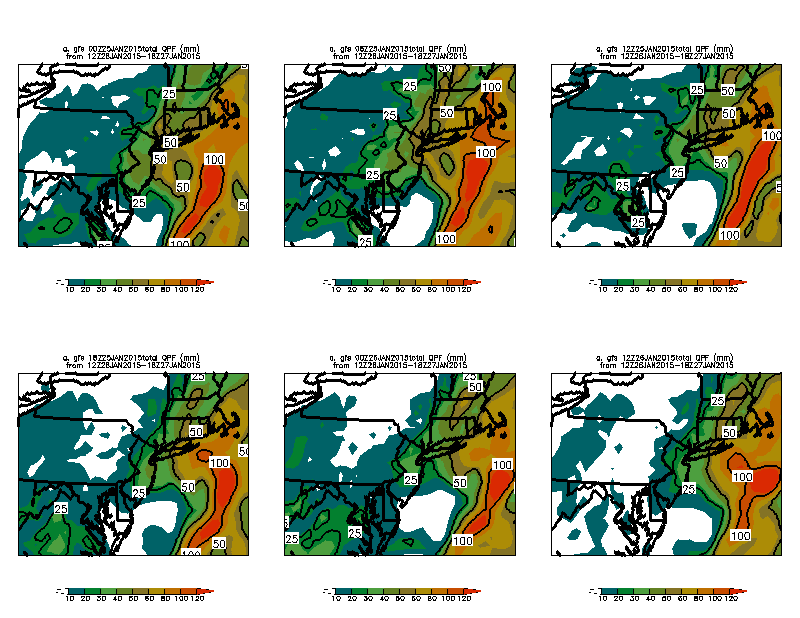
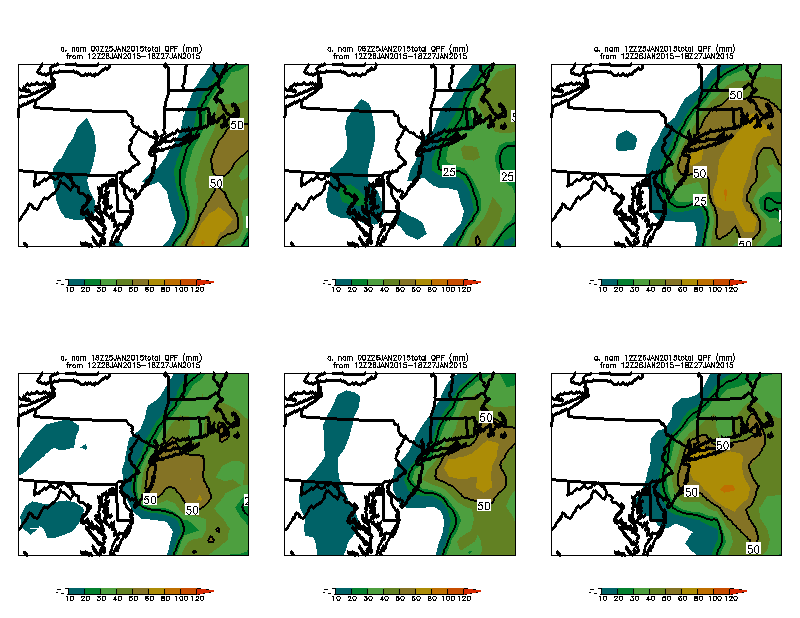
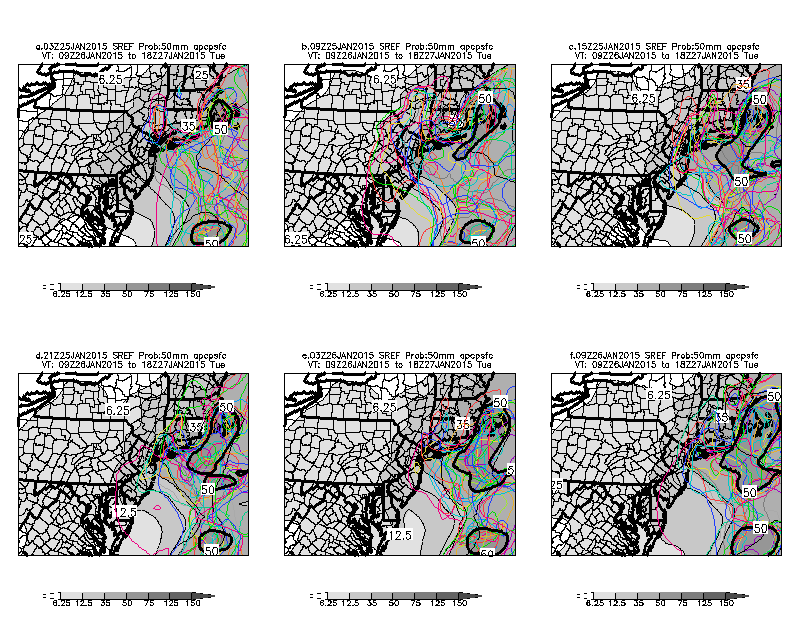
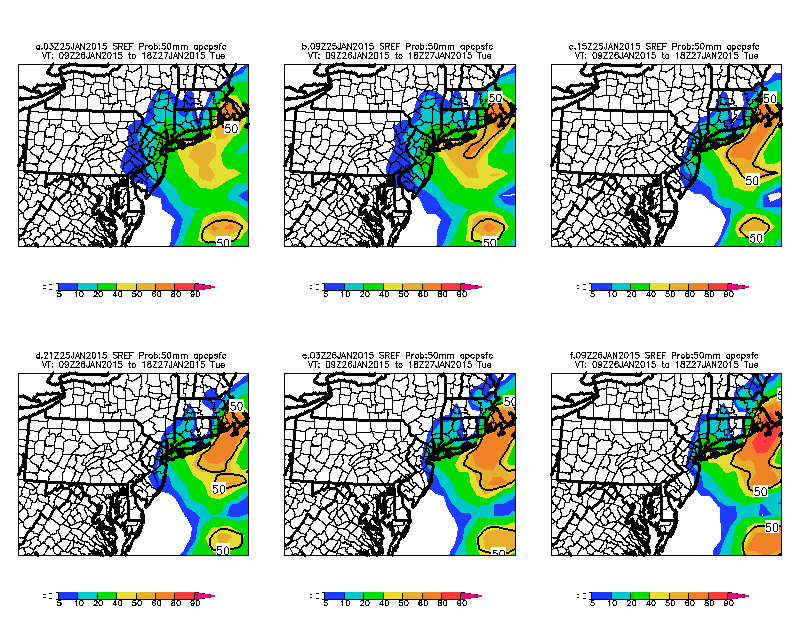
----ECMWF Post-mortem perspective on New England Blizzard
----D(prog)/D(time) maps for 1200 UTC on 25 Jan, 26 Jan, and 27 Jan.
Super-Typhoon Nuri
--------Nuri-Pacific (courtesy of Alicia Bentley)
--------Nuri-North America (courtesy of Alicia Bentley)
--------Nuri-Atlantic (courtesy of Alicia Bentley)
----Map Post (Lance)
--------NCEP surface analysis (06Z 8 Nov 2014)
----Map Post Regarding Nuri ET Intensity
--------Related Graphics
ECMWF Parallel runs between IBM & Cray Machines
----MSLP & Standard Deviation (ECMWF parallel)
26 Oct 2014 Short-lived KALB Nocturnal Thunderstorms
----Map post (Lance)
----Related Graphics
Extreme North Atlantic Cyclone (10 December 2014)
----Map Post (Joe Sienkiewicz)
--------Wave Height and Wind Graphics
Hawaiian Blizzard (23 December 2014)
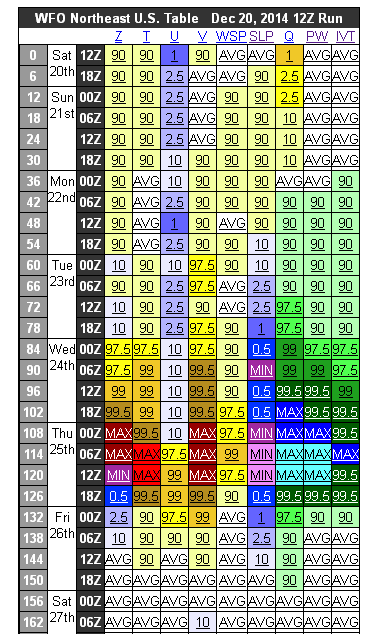
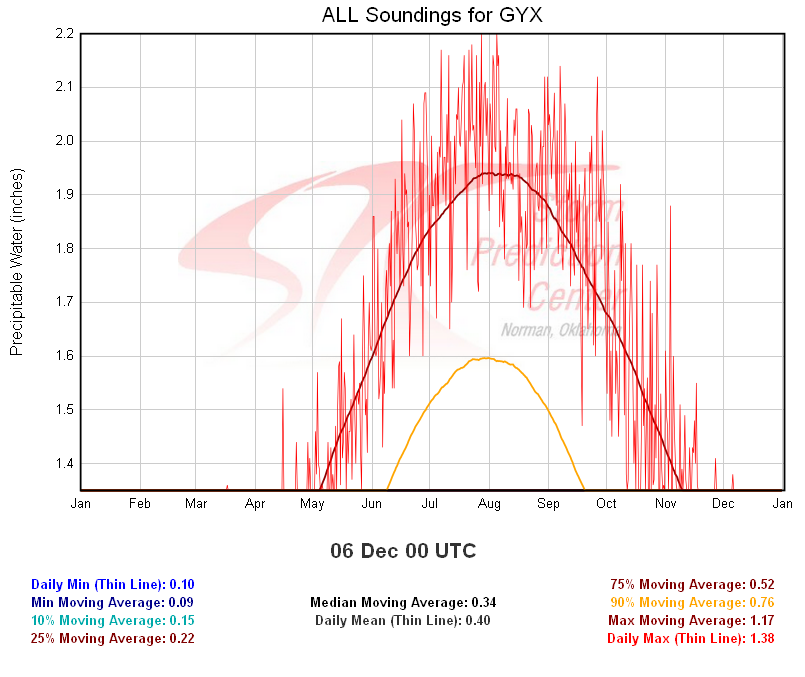
Northeast Christmas Eve Rainstorm (December 2014)
--------Ensemble Situational Awareness Table
--------PWAT Climo for Gray, ME
Items of Interest (Spring 2014):
1 May 2014: Historic Northeast TC Rainfall Events
----source
8 April 2014: QG Diagnostics of the 25-26 March 2014 coastal bomb (Tom Galarneau)
----Tom Galarneau's QG Homepage
26 Feburary 2014:
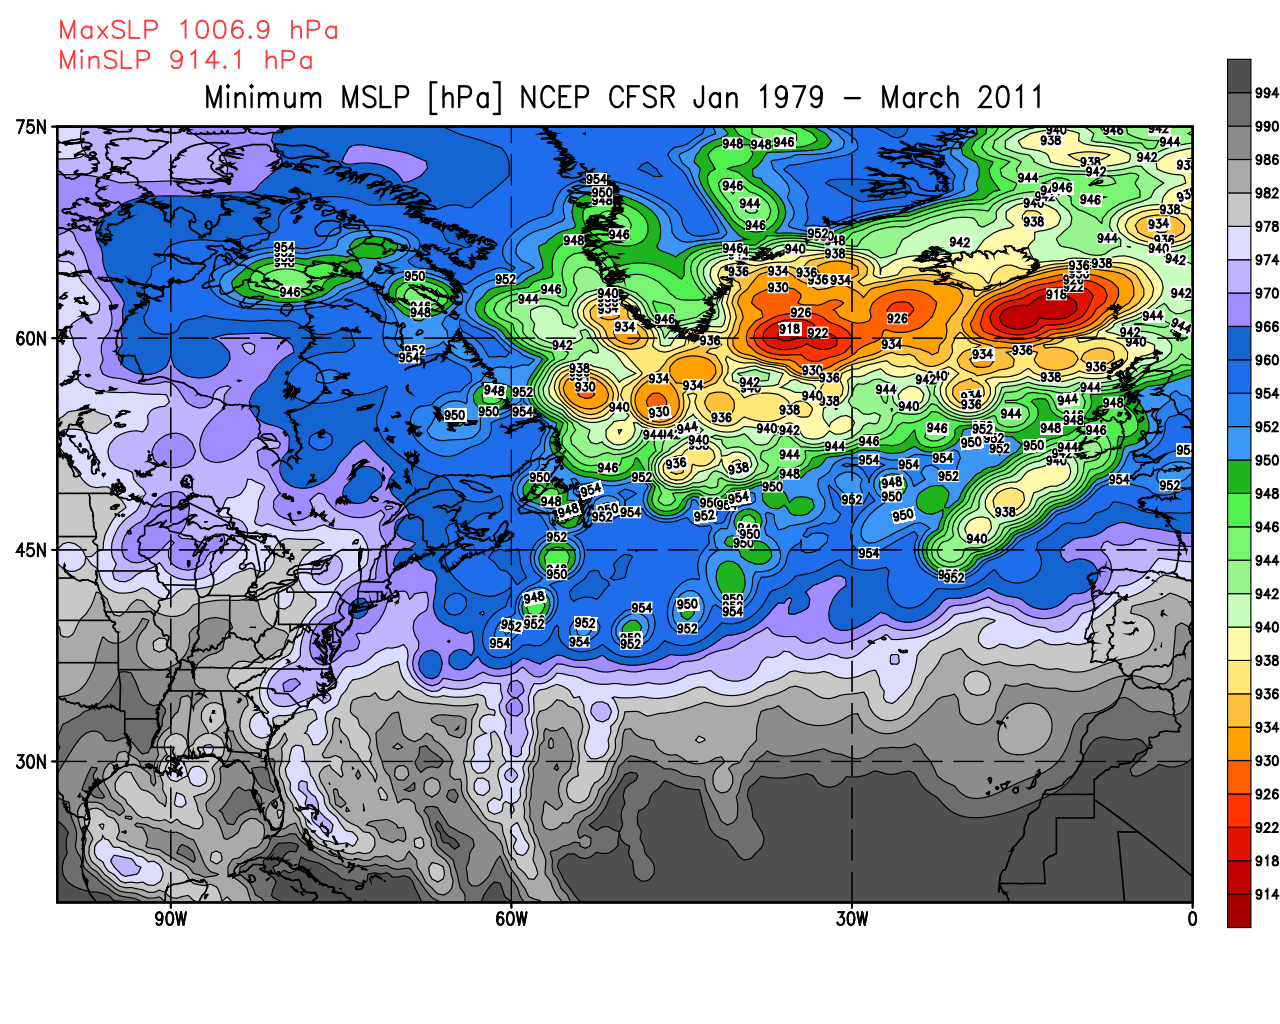
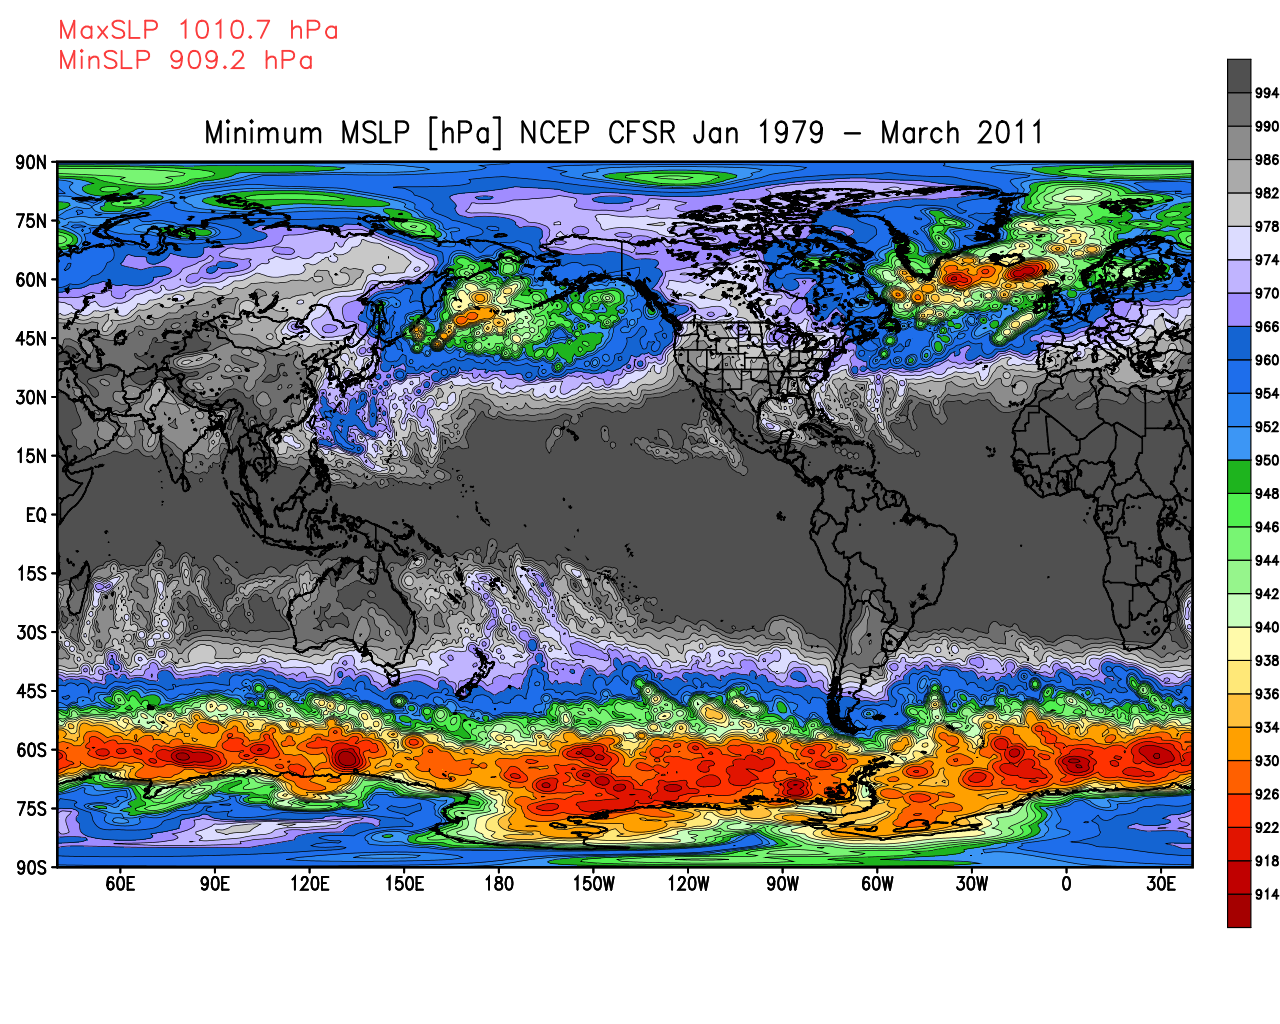
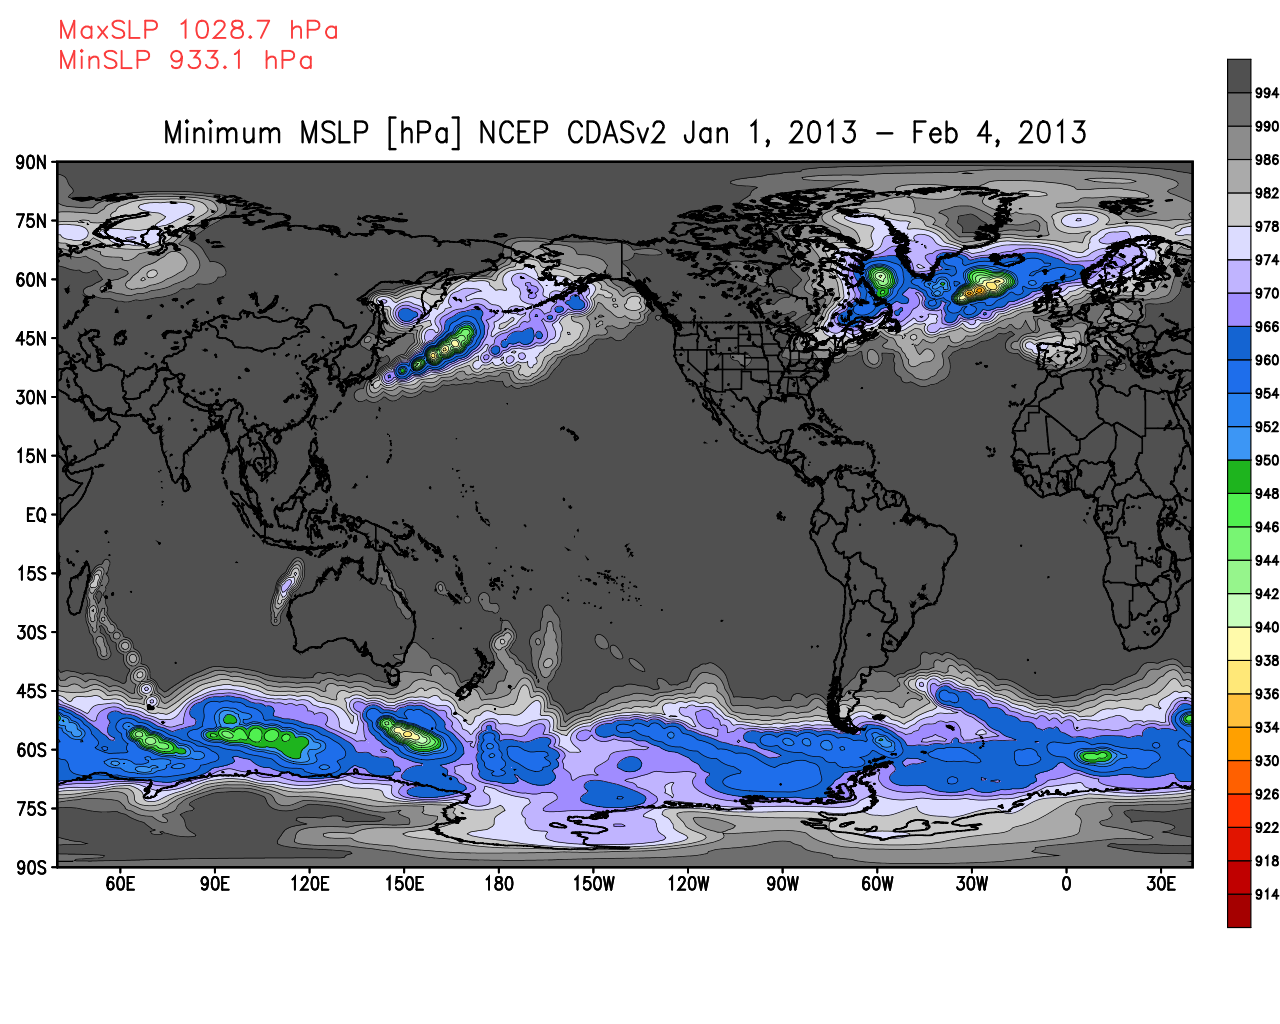
Minimum MSLP from CFSR across the globe
----Minimum Sea Level Pressure in Atlantic Basin
----Minimum Sea Level Pressure over Globe
----Minimum Sea Level Pressure over Globe (January 2013)
23 January 2014:
Persistent Anomalous Gulf of Alaska Ridge
----Northern Hemisphere Mean and Anomalies (1 May 2013 - 20 Jan 2014)
----North America Mean and Anomalies (24 Nov 2013 - 20 Jan 2014)
Dprog/Dt of 21-22 January Snowstorm For I-95 Corridor:
----All Maps
----6 hour precip / 850 hPa temps / 10 m winds
----500 hPa vort / Temp / Height / Wind
----MSLP / Thickness / 250 hPa Isotachs
SREF Ensemble Plume Diagrams (Substancial increase in precipitation amounts on 19 Jan)
----SREF Mean Snowfall (from 03 - 21 UTC 19 Jan 2014)
----SREF Ensemble Precip 03 UTC 19 Jan 2014
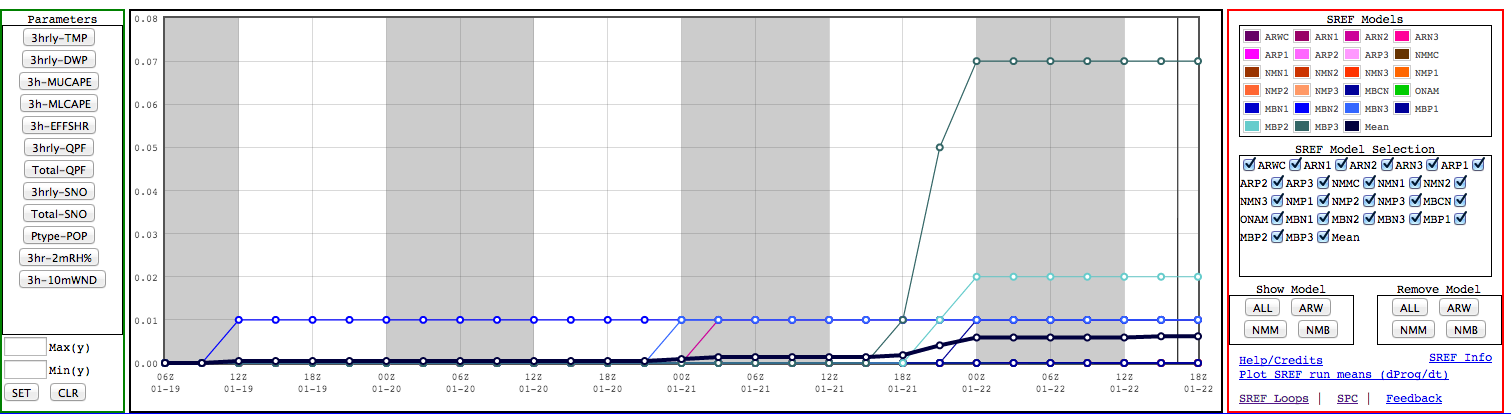
----SREF Ensemble Precip 09 UTC 19 Jan 2014
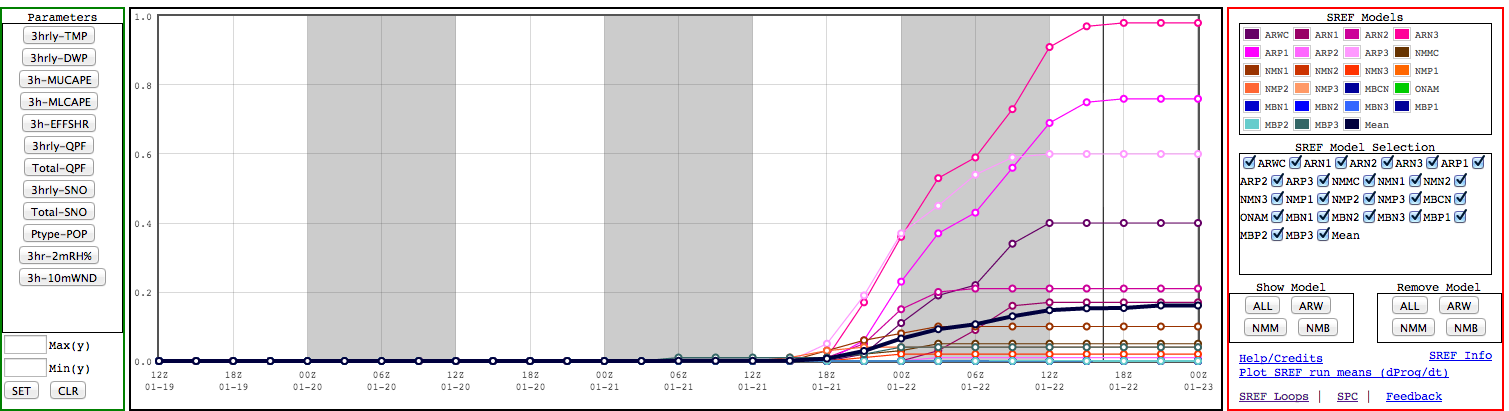
----SREF Ensemble Precip 15 UTC 19 Jan 2014
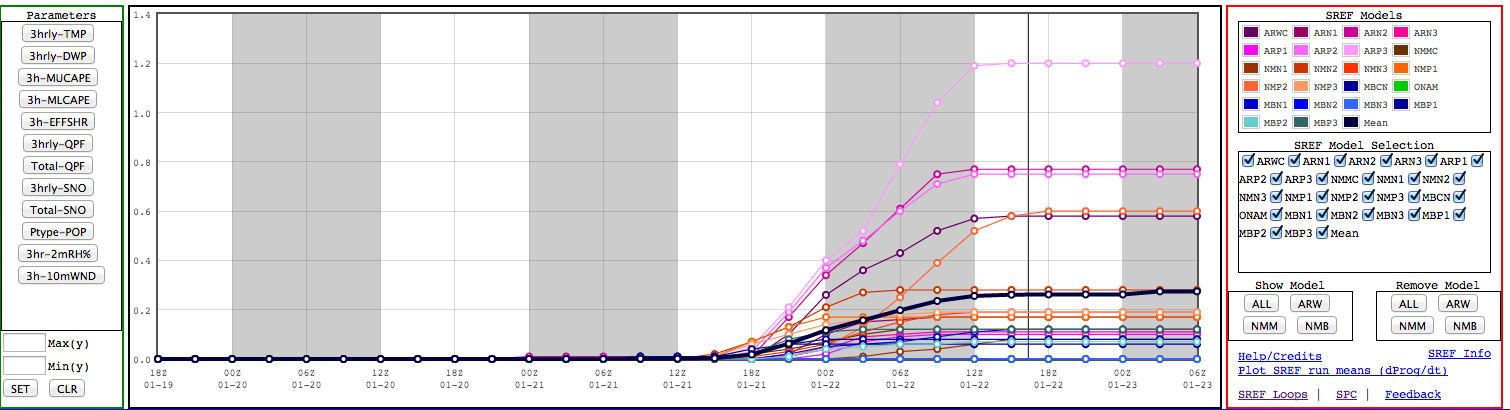
----SREF Ensemble Precip 21 UTC 19 Jan 2014
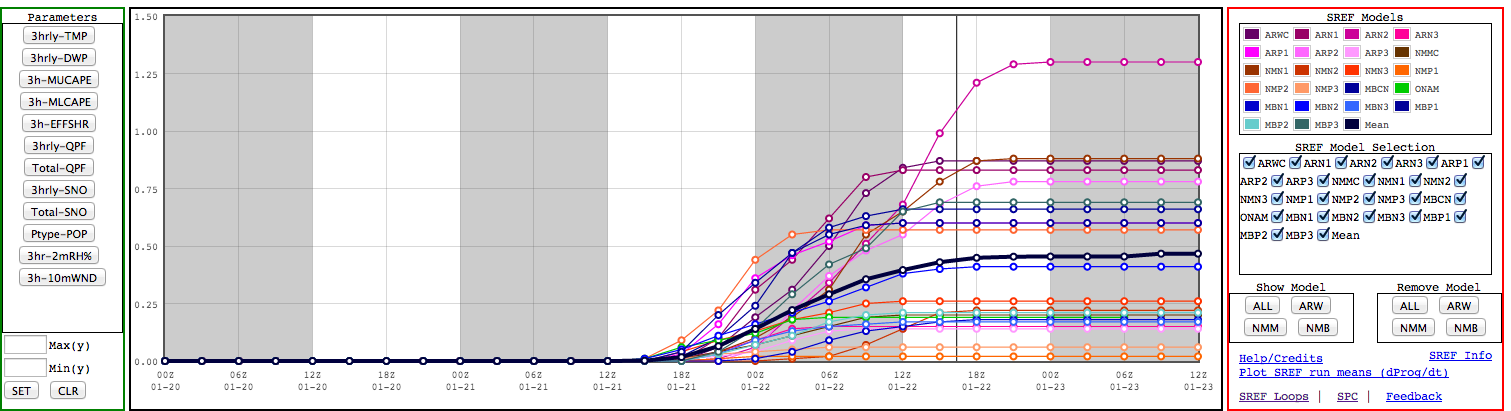
08 January 2014:NWS State College, PA writeup of 21-23 December 2013 Storm (Rich Grumm)
05 January 2014:Map post of western Atlantic bomb of 3-4 Jan 2014
----Graphics from Map post
----Sea Level Pressure Map of Bomb
----OSCT and ASCT passes over Bomb 4 January 2014
----Colorized IR Satellite + POES derived wave heights 5 January 2014 (0150 UTC)
----Colorized IR Satellite + POES derived wave heights 5 January 2014 (0750 UTC)
----Colorized IR Satellite + POES derived wave heights 5 January 2014 (1250 UTC)
----Zoomed in region of highest POES derived wave heights 5 January 2014 (1050 UTC)
----
----(Not Complete) GFS Analysis of North Atlantic
05 January 2014:(Not Complete) Dprog-DT of ECMWF for Jan 3-4 East Coast Storm
04 January 2014:CIPS Analog Guidance (St. Louis University)
03 January 2014:Jay Cordeira's text files of 850 hPa Radiosonde sorted by date (STATION_850.txt) and temperature (rank_STATION_850.txt)
----Jay Cordeira's Radiosonde Archive (Station IDs can be cross-listed with names with link above)
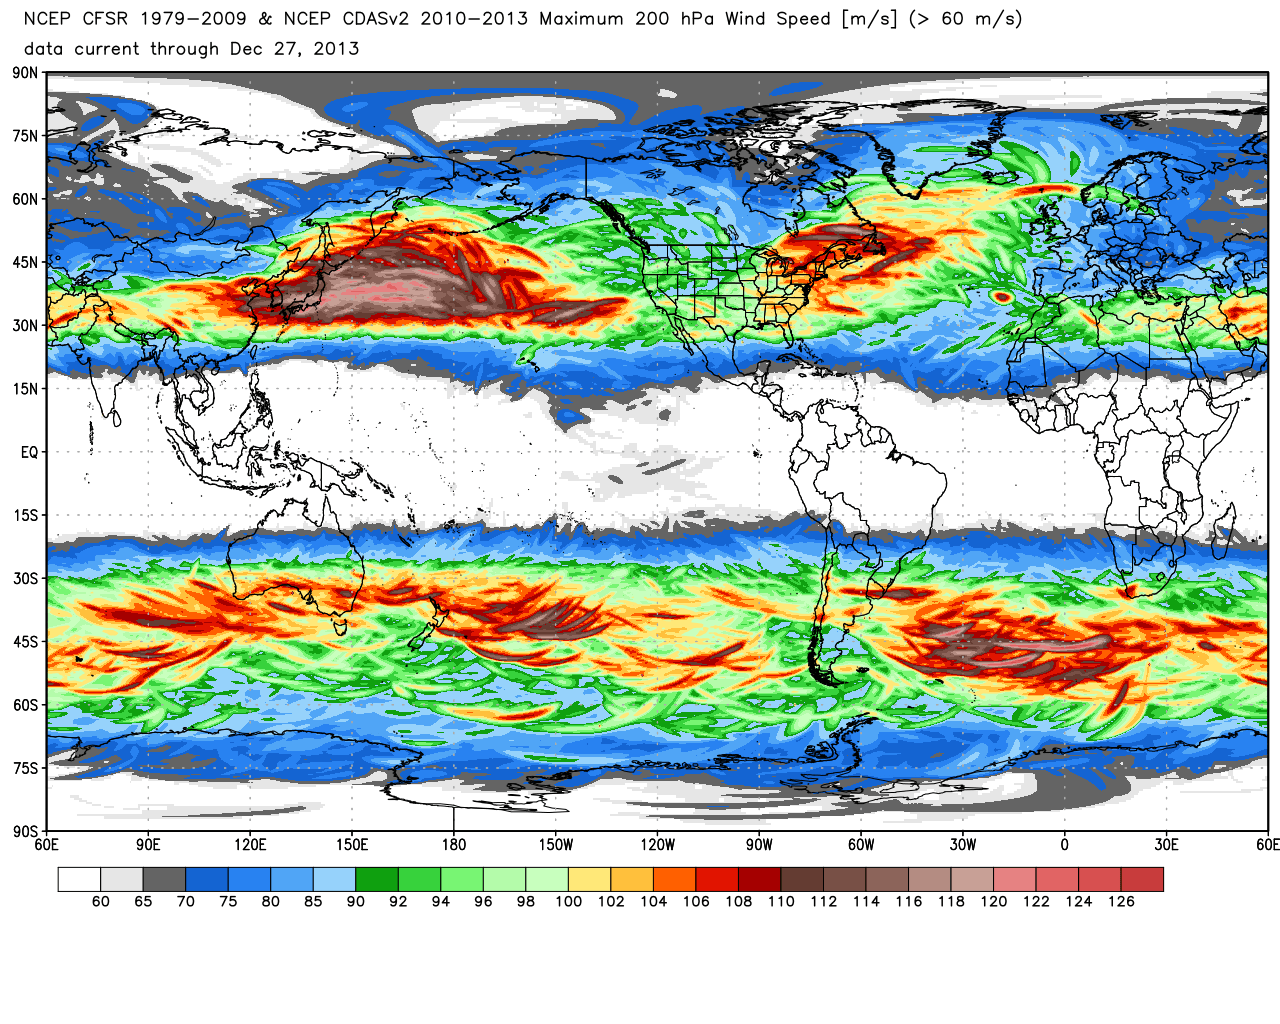
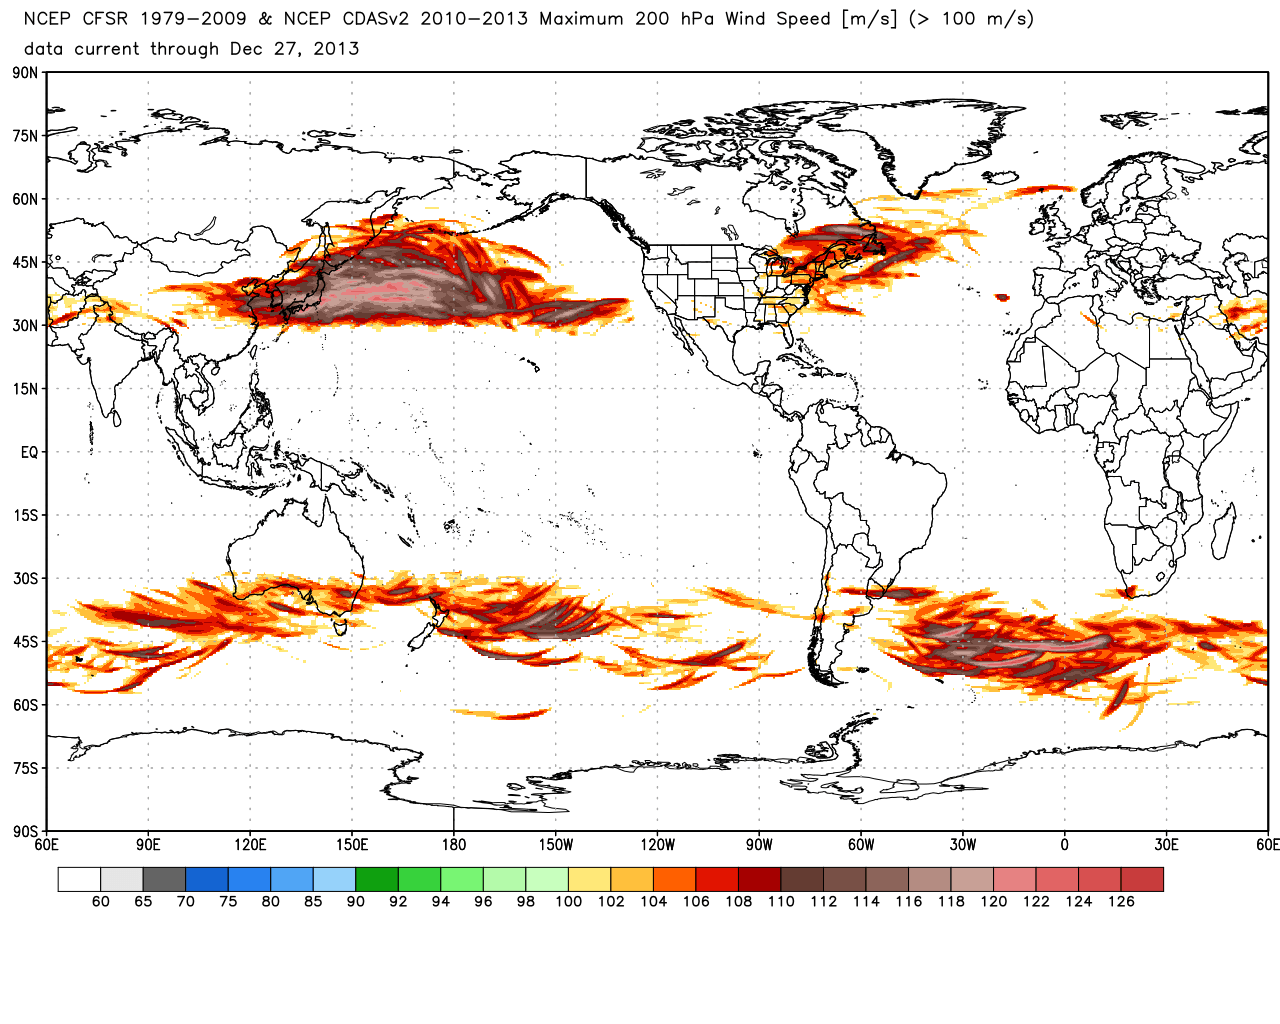
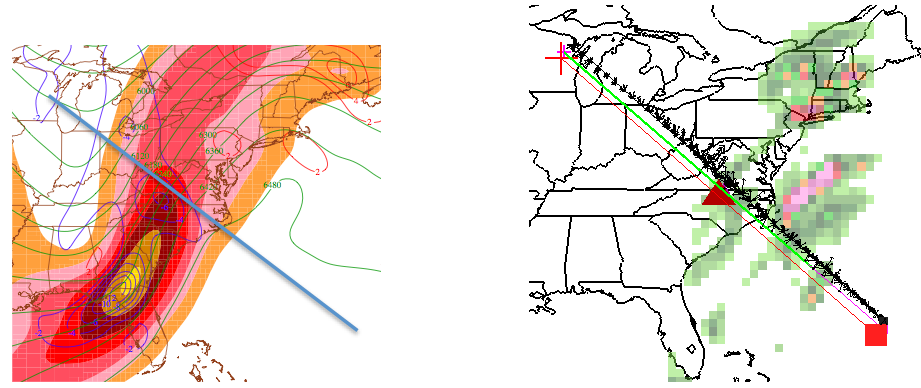
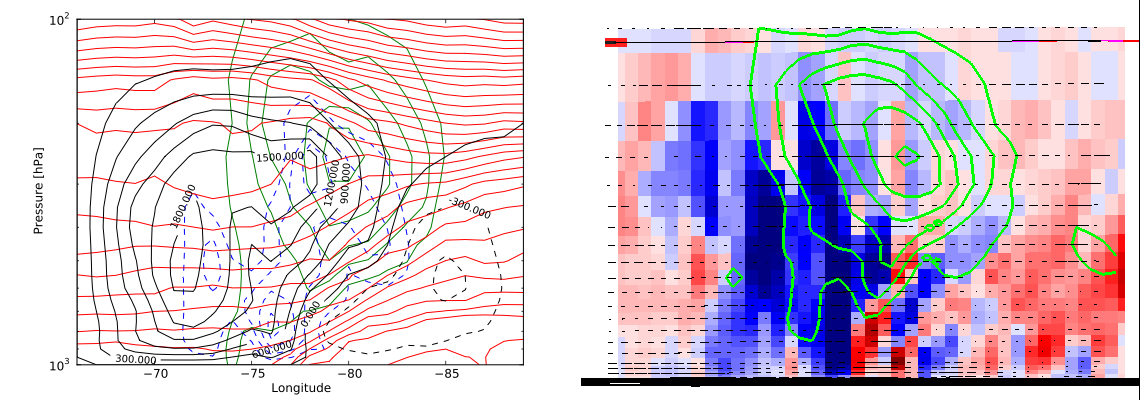
27 December 2013:Map post thread of 21-23 December 2013 Storm Featuring > 100 m s^-1 200 hPa wind speed over Quebec, Canada
----Graphics from Map post
----CFSR 1979-2009 + NCEP CDASv2 2010-2013 Grid point Maxima 200 hPa Wind Speed greater than 60 m s^-1
----CFSR 1979-2009 + NCEP CDASv2 2010-2013 Grid point Maxima 200 hPa Wind Speed greater than 100 m s^-1
----NCEP CDASv2 December 2013 Grid point Maxima 200 hPa Wind Speed greater than 60 m s^-1
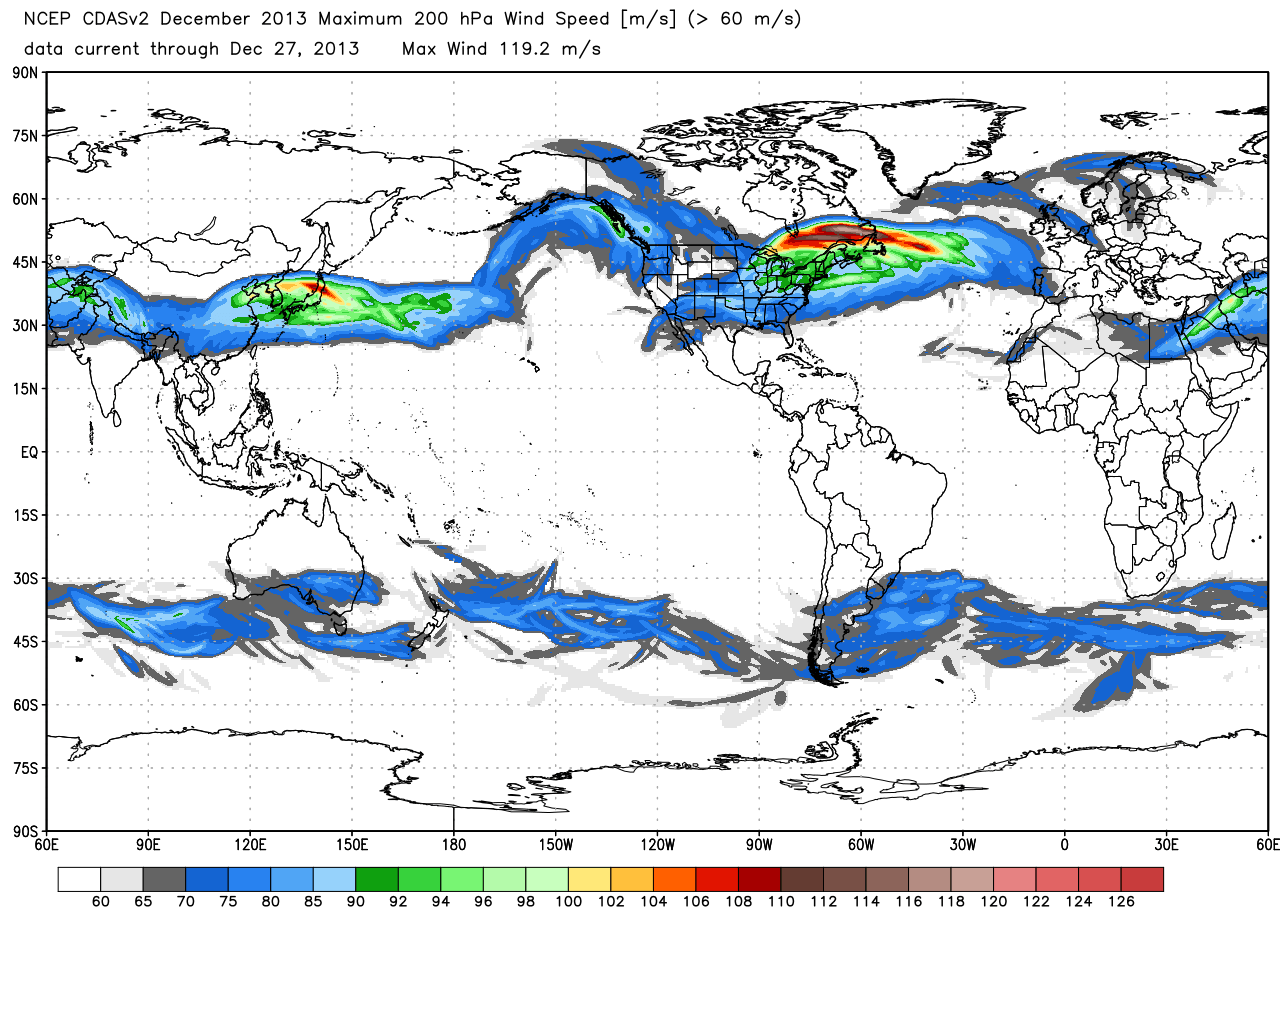
----
----(Not Complete) GFS Analysis of North America
----(Not Complete) GFS Analysis of North Atlantic
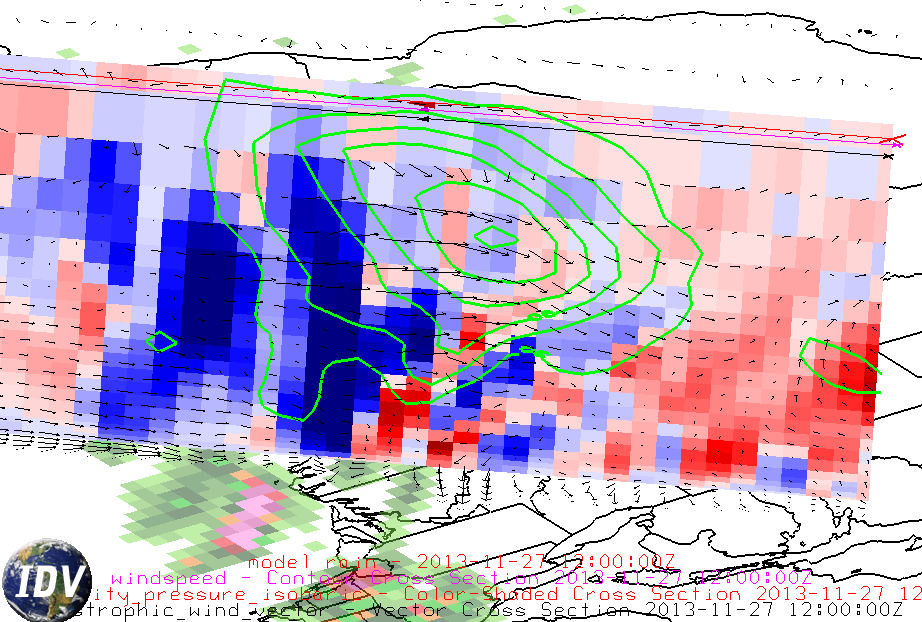
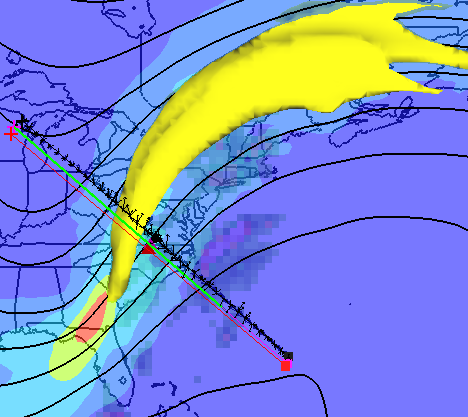
30 November 2013:Map post of NYC Macy Thanksgiving Parade Storm (Turkey Leg Jet) - Brian Mapes
----Graphics from Map post
----Same 3D view except with isotachs > 40 m s^-1 shaded in yellow
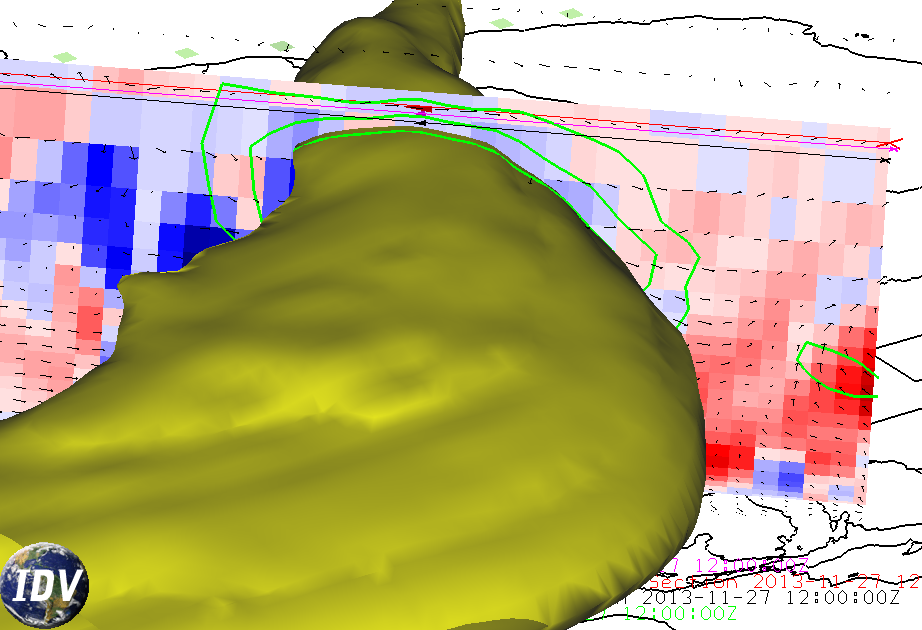
----Different 3D view with isotachs > 40 m s^-1 shaded in yellow with geostrophic wind (shaded contours)
13 November 2013:Map post of an Ensemble Forecast Bust - Tony Fracasso
----Graphics from Map post
----GEFS geopotential height error (in meters) from 204 hour forecast verifying 1200 UTC 11 Nov 2013
----Verifying 500mb height pattern with standardized anomalies (courtesy Mike Bodner / WPC)
----ECMWF ensemble normalised standard deviation from their public website (192 hr forecast valid 12Z 12 Nov)
Items of Interest (Spring 2013):
9 November 2012: "Weather Forecasts Slowly Clearing Up" (R. Kerr, Science Magazine)
28 November 2012: A West Coast atmospheric river and heavy precip ('Map' thread)
9 December 2012: Midwest cyclone GFS d(prog)/dt charts (from K. Griffin)
--MSLP/6hr precip: 1200 UTC 9 Dec | 0000 UTC 10 Dec
--500 hPa vort: 1200 UTC 9 Dec | 0000 UTC 10 Dec
--precipitable water: 1200 UTC 9 Dec | 0000 UTC 10 Dec
--850 hPa temp/mixing ratio: 1200 UTC 9 Dec | 0000 UTC 10 Dec
--DT pressure: 1200 UTC 9 Dec | 0000 UTC 10 Dec
--MSLP/thickness/250 hPa wind speed: 1200 UTC 9 Dec | 0000 UTC 10 Dec
26 December 2012: Ensemble bust in the west ('Map' thread)
--Related GFS d(prog)/dt charts (verifying 1200 UTC 26 Dec 12, from K. Griffin)
---500 hPa vort
---DT pressure
---MSLP/thickness/250 hPa wind speed
15 January 2013: Ship smoke plume tracks (CIMSS/SSEC)
15 January 2013: Global tropical cyclone tracks (Wikimedia)
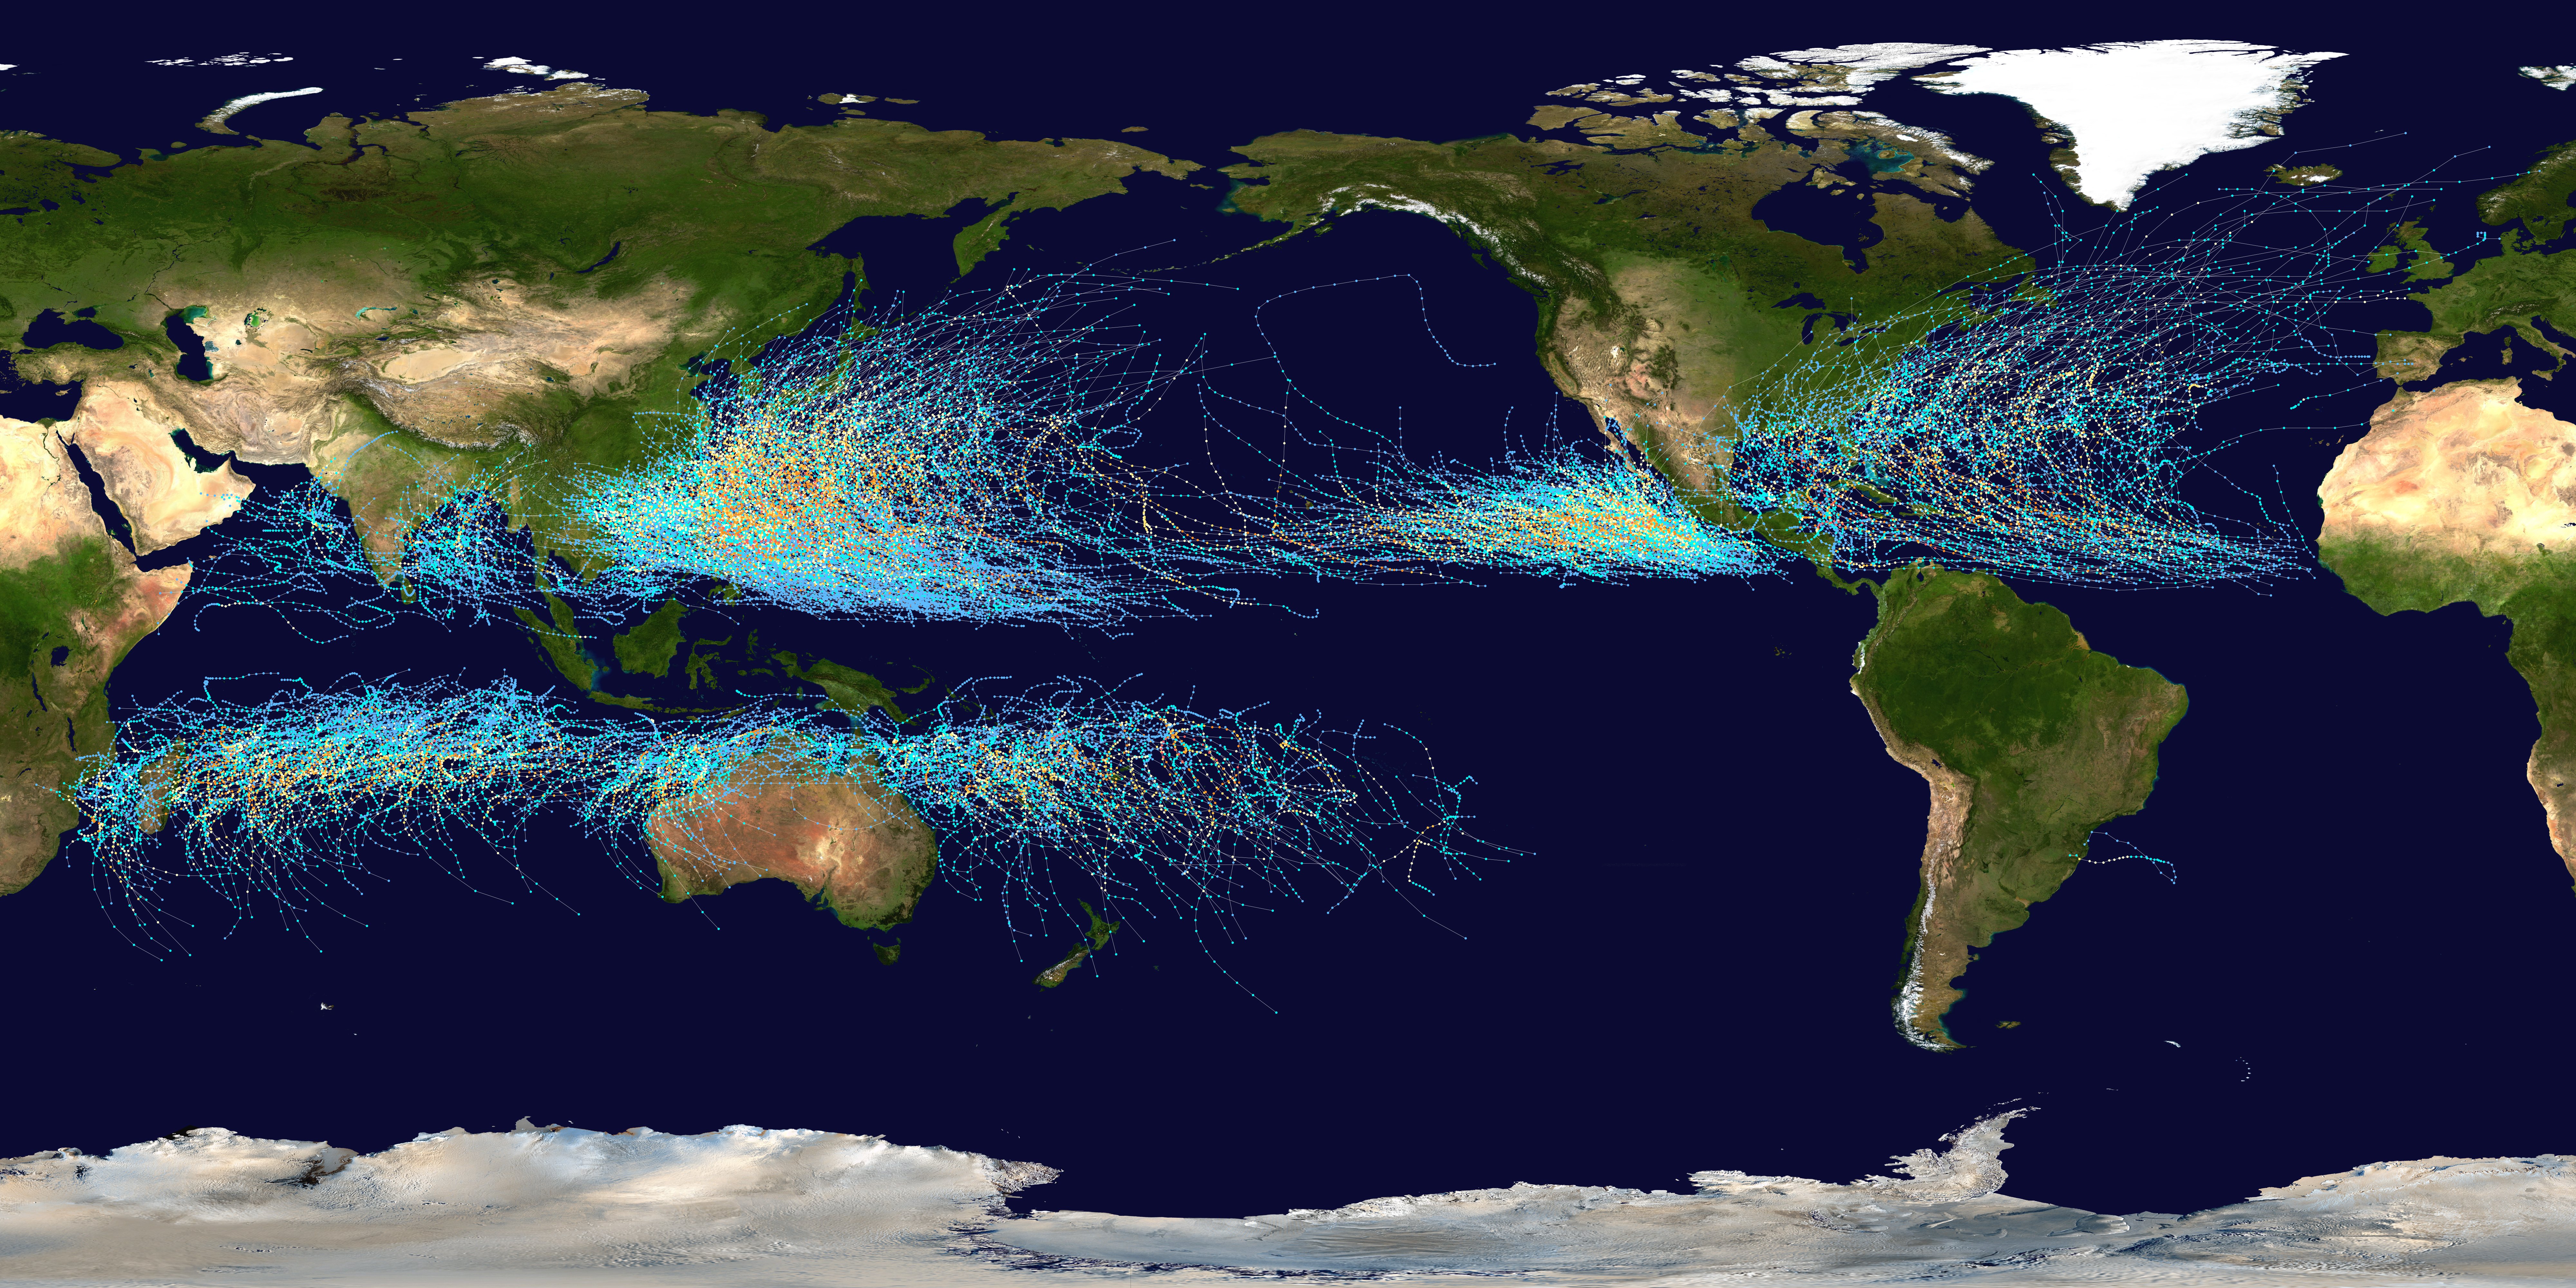
18 January 2013: Hottest day in Sydney's history ('Map' thread)
25 January 2013: Weekly map discussion synopsis ('Map' thread)
1 February 2013: Weekly map discussion synopsis ('Map' thread)
4 February 2013: Prof. Bosart's NH winter update ('Map' thread)
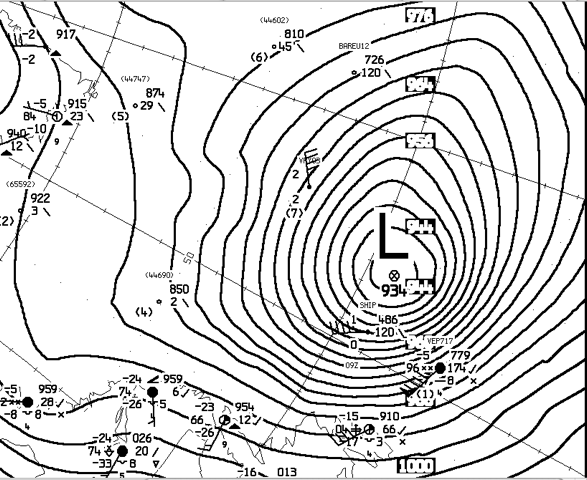
4 February 2013: Climatology of minimum MSLP (Ryan Maue) ('Map' thread)
8 February 2013: The Blizzard of 2013 (discussion and various images)
12 February 2013: NHC report on Hurricane Sandy
22 February 2013: Weekly map discussion synopsis ('Map' thread)
26 February 2013: "When the Butterfly Effect Took Flight" (P. Dizikes, MIT Technology Review)
28 February 2013: A fairly comprehensive collection of forecast skill metrics (Centre for Austrailian Weather and Climate Research)
1 March 2013: An overview of drylines (T. Schlatter, Weatherwise)
1 March 2013: Weekly map discussion synopsis ('Map' thread)
6 March 2013: Heavy Snow Forecast Bust for DC ('Map' thread)
6 March 2013: DC "Snowquester" Bust (Washington Post)
10 March 2013: ECMWF versus NCEP models (NBC News video)
15 March 2013: Weekly map discussion synopsis ('Map' thread)
26 March 2013: QG Diagnostics of the 6-8 March 2013 Cyclone (courtesy Tom Galarneau)
26 March 2013: Composite cross section of potential temperature (Jan 1964-2013 along 80W; source: NOAA/ESRL/PSD)
26 March 2013: Snowpack and cumulus over the Midwest: Visible Satellite - Surface Observations
5 April 2013: Weekly map discussion synopsis ('Map' thread)
8 April 2013: El Reno, OK tornado of 24 May 2011: Direct hit on a mesonet station ('Map' thread)
--Postscript: Mesonet station encounters with tornadoes on 7 Nov 2011 ('Map' thread)
15 April 2013: Intense mesoscale snowband in Colorado (UCAR/RAL)
26 April 2013: Weekly map discussion synopsis ('Map' thread)
2 May 2013: "Chaos at Fifty" (A. Motter and D. Campbell, Physics Today)
3 May 2013: Deformation and QG Forcing for Vertical Motion (Jaymes Kenyon)
7 Jun 2013: El Reno, OK EF-5 tornado of 31 May 2013 ('Map' postings)
Items of Interest (Spring 2012):
17-19 January 2012: West Coast Heavy Rain Event
19 January 2012: Terrain-induced gravity waves
19 January 2012: Impressive baroclinicity
19 January 2012: Downsloping along eastern foothills of Rockies
19 January 2012: Mesoscale thermal boundaries over Pacific Northwest
24 January 2012: Definition of threat score and bias (from WPC)
24 January 2012: SPC Storm Reports (1200 UTC 22 Jan - 1159 UTC 23 Jan)
24 January 2012: Soundings (22 - 23 Jan): SHV - LZK - JAN - DRT
24 January 2012: Impressive air mass boundary in TX
24 January 2012: West Coast Heavy Rainfall EFIs:
00 UTC 18 Jan - 00 UTC 19 Jan - 00 UTC 19 Jan - 00 UTC 20 Jan
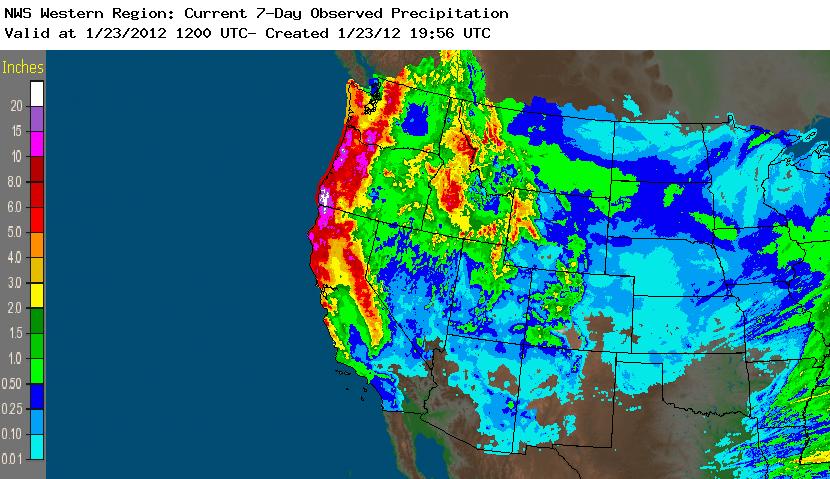
24 January 2012: 7-day Precip - 60-day Precip Anomaly (NWS Western Region)
31 January 2012: GFS 250 hPa Height Forecast & Ensemble Spread (courtesy of Heather Archambault)
31 January 2012: GFS MSLP Forecast & Ensemble Spread (courtesy of Heather Archambault)
31 January 2012: 1060-hPa Anticyclone & Climate Change (Rich Grumm)
31 January 2012: 1060-hPa Anticyclone & Climate Change (Kyle Griffin)
2 February 2012: Major Changes in Alaska
2 February 2012: Shallow inversion over Fairbanks, AK
2 February 2012: Svalbard, Norawy Backward Trajectory (00 UTC 27 Jan)
2 February 2012: Svalbard, Norawy Backward Trajectory (12 UTC 30 Jan)
2 February 2012: Amplifying 500-hPa trough
3 February 2012: Subsidence near Hawaii; Diurnal convection over Mexico
3 February 2012: Elevated (Kansas) vs. surface-based (Texas) convection
3 February 2012: Soundings (00 UTC 3 Feb) DDC - FWD
7 February 2012: NCEP 250-hPa Forecast (132-h) vs. Analysis (12 UTC 3 Feb)
.gif)
9 February 2012: UKMET Office Probabilistic Forecasting Experiment
16 February 2012: GEFS 500-hPa Height/Vorticity/Spread (12 UTC 15 Feb)
16 February 2012: GEFS 500-hPa Spaghetti Plots: 522/564 dam (12 UTC 15 Feb)
16 February 2012: GEFS 500-hPa Spaghetti Plots: 534/576 dam (12 UTC 15 Feb)
16 February 2012: GEFS 500-hPa Spaghetti Plots: 540/582 dam (12 UTC 15 Feb)
23 February 2012: Butterfly Effect & Chaos Theory (published by MIT)
10 April 2012: Increasing NOAA's Computational Capacity (Hamill et al., 2010)